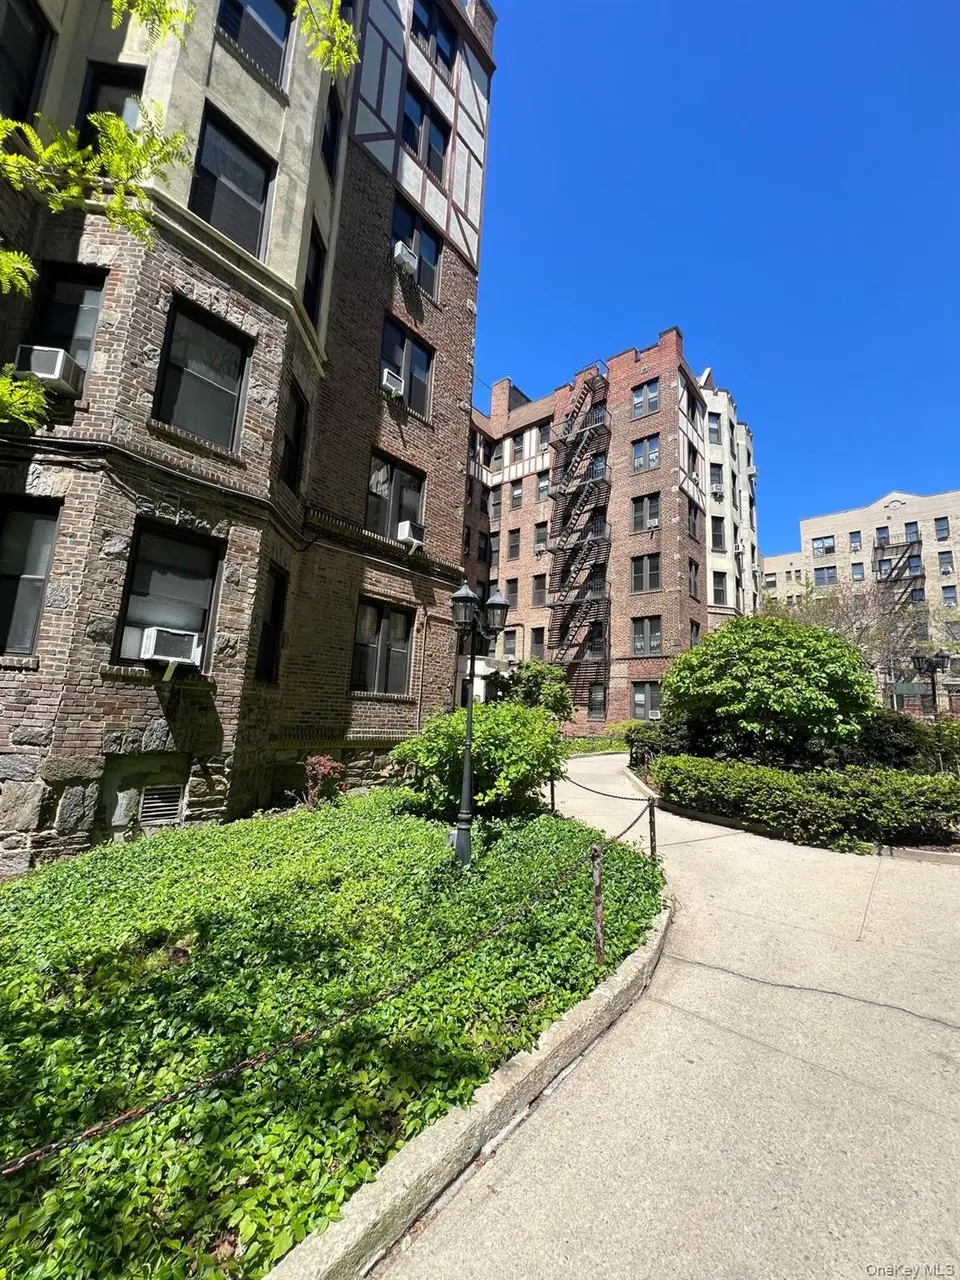
754 Brady Ave #201 · New York, NY
Flood risk 1/10 · Minimal
- FEMA flood zone
- X (unshaded)
- Chance of flooding over 30 yrs
- 0.0%
- Est. flood insurance / yr
- $507 – $1,088
Fire risk 1/10 · Minimal
- Est. fire insurance / yr
- $691 – $1,283
Heat risk 6/10 · Moderate
- Hot days now (above 99°F)
- 7 days/yr
- Hot days in 30 yrs
- 15 days/yr
Wind risk 6/10 · Moderate
- Chance of severe wind over 30 yrs
- 27.0%
Air-quality risk 3/10 · Minor
- Unhealthy air days now
- 3 days/yr
- Unhealthy air days in 30 yrs
- 4 days/yr
Risk factors via First Street. Map © Google.
Why this score? — see what drove the C- grade
The composite is a weighted blend of 9 inputs, each scored 0–100. Each bar is that input's sub-score; the figure is the points it added to the 100-point composite (weight × sub-score).
- Cash flow +12.4/30.0
- 1% rule +9.2/10.0
- ARV discount +7.5/15.0
- Schools +5.0/10.0
- Rent growth +4.9/5.0
- Livability +3.8/5.0
- Condition / age +3.8/5.0
- DSCR +3.7/10.0
- Appreciation +0.0/10.0
$209,000
🖨 Deal sheet 📄 Offer letter ✓ Due diligence
Listing remarks
Welcome to a second floor 2-bedroom, 1-bath unit in the Pelham Parkway section of the Bronx. This apartment offers a comfortable and practical layout with two bedrooms and one full bathroom, making it a great option for buyers looking for convenience, space, and accessibility. The location is close to neighborhood schools, including P. S. 105 Sen. Abraham Bernstein for elementary school, nearby middle school options such as Pelham Academy, and close access to Bronx High School for the Visual Arts. Enjoy being near local shopping, supermarkets, restaurants, banks, pharmacies, and everyday conveniences, with easy access to nearby parks, the Bronx Zoo, and the New York Botanical Garden. Transp
Key facts
- Nearby buses
- Built 1932
- Listed 43 days
Tags
Property features AI
Finance
- Other: Living area reported from public records
- HOA & community: Association fee includes heat
Exterior
- Parking: No carport; No designated parking
- Utilities: Public sewer; Cable connected; Electricity connected; Natural gas available
- Home design: Townhouse; Stock cooperative
- Construction: Brick construction
- Exterior features: Brick exterior; Not waterfront
Interior
- Kitchen: Gas oven; Gas range; Refrigerator
- Bedrooms: 2nd level entry
- Bathrooms: 1 full bathroom
- Heating & cooling: Natural gas heating; Wall/window air conditioning units
- Interior features: Open floorplan; Full basement
- Laundry & utility: Natural gas available
Neighborhood map
What this means for you Summary
Snapshot
- This is a 2-bed/1.0-bath condo listed at $209k. Condition is rated good.
Deal economics
- At list price, monthly cash flow is $-33 ($-399/yr) — negative.
- The deal already cash-flows at list — no discount required.
- Meets the 1% rule at list price ($3k rent vs $209k).
- Recommended offer: $203k (3.0% below list) — sets the bar for market timing.
- Cap rate 6.1% vs local median 2.6% in New York — top-decile yield for the area; either an underpriced asset or a hidden risk that comps aren't pricing in. Stress-test before assuming the spread holds.
Location & tenants
- Location reads 75/100 on livability (#268 in NY, #4,188 nationally) — a middle-class / working-renter tenant base. Strengths: amenities A+, commute A+, health & safety A; Watch: crime F, cost of living F.
- Market conditions: Rents rising fast (+9.4%/yr); 189 active listings in the ZIP; 3 comparable units currently listed for rent nearby; rentals at typical pace (median 25d on market — plan ~3-4 weeks tenant-placement turnaround); 6,929 units permitted in Bronx County in 2024 (6,829 in 5+ unit buildings).
- At $2,965/mo this rent would consume 58% of the median local household income ($61k/yr) (locally 7650% of renters already pay >50% of income on rent) — very limited rent-growth headroom before tenants either downsize or default.
Forward outlook
- Local home prices are declining (-3.0%/yr); year-one equity from $1k of loan paydown is wiped out by about $6k of value loss. Plan a longer hold.
- Bronx County population projected at +21% by 2050 — long-run rental-demand tailwind backs the buy-and-hold thesis.
- At projected returns (-3.0% appreciation + 8.0% rent growth), your $59k cash investment doubles in ~10 years — after that, you're playing with house money.
Negotiation context
- It's been on market 43 days — a 3% lower offer ($203k) is reasonable based on typical stale-listing flexibility.
Risks & watch-outs
- Watch-outs: HOA is 31% of rent; built in 1932 — expect roof / HVAC / electrical / plumbing capex.
- Climate carrying-cost: major wind risk, 27% chance of damaging wind over 30y; extreme-heat days projected 7→15/yr by 2055 (HVAC capex compounding) — expect insurance premiums to compound above CPI over the hold.
Questions for the listing agent
- What do current leases actually rent for vs. the listed asking? Can we see a recent rent roll and the last 12 months of T-12 income?
- It's been on market 43 days. Have you received any prior offers? Is the seller open to a 3% concession, seller financing, or rate buy-down credit?
- Built in 1932 — when were the roof, HVAC, electrical panel, plumbing, and water heater last replaced?
- What does the HOA fee cover, when was the last increase, and are there any pending special assessments or reserve-fund shortfalls?
- Any open or pending special assessments — roof, HVAC, plumbing, elevator, façade? What's the per-unit balance and payoff schedule, and is the seller paying it off at close or rolling it to the buyer?
- Is there a deadline driving the sale (1031 exchange, divorce, estate, relocation)? That informs how much negotiation room exists.
- Schools are B-rated — typically a magnet for longer-tenancy family renters. What's the average tenant stay here, and is there a school-zone premium baked into asking?
- Crime grade is F in this area — have there been break-ins, vandalism, or insurance claims at this property in the last 3 years? What carrier currently insures it and at what premium?
- What's the average days-on-market for RENTAL listings here right now (not sales)? A rising rental-DOM trend means longer vacancies and softer asking-rent achievability than the comps imply.
- What's the recent tenant-quality profile in this submarket — average credit score on applications, eviction rate, late-payment / NSF rate, and stable-employment percentage? A property-management company in the area should have these aggregated.
- How much new apartment / multifamily construction is in the pipeline within 1–3 miles? Heavy new supply (>2% of stock underway) typically softens rents 12–24 months out; light construction supports rent growth.
Investment metrics
- 1% rule
- 1.42% ✓
- Cap rate
- 6.10%
- Cash-on-cash
- -0.68%
- DSCR
- 0.97
- GRM
- 5.9
CMA / ARV
No comps found within radius.
Projected returns pro-forma
-3.0% appreciation · 8.0% rent growth · sell at horizon
- IRR
- -8.5%
- Equity multiple
- 0.66×
- Total profit
- $-19,702
- Equity at exit
- $31,163
- IRR
- 8.9%
- Equity multiple
- 1.92×
- Total profit
- $53,930
- Equity at exit
- $18,071
Cash invested: $58,520 (down + closing). Projections, not guarantees.
Landlord ↔ Tenant lean methodology
- Overall (CITY)
- 0 Strongly Tenant-Friendly
- State New York
- 15 Strongly Tenant-Friendly · D+10
- County
- — inherits STATE
- City New York
- 0 Strongly Tenant-Friendly · D+34
ZIP-level market 10462
- Home prices YoY
- -10.4%
- Rents YoY
- 9.4%
- Active inventory
- 189
- Price-to-rent
- 5.9×
Monthly cashflow live
- Estimated rent
- $2,965 medium interval (Pro) →
- Mortgage (P&I)
- −$1,096
- Tax est. 1.5%
- −$261 /mo · $3,135/yr
- Insurance
- −$87
- HOA est. from 1 same-building comp
- −$931
- Vacancy / Maint / Mgmt
- −$623
- Net cashflow
- $-33
Break-even live
UW: 25.0% down · 7.5% · 30yr · 1.5% tax · 5.0% vac · 8.0% maint · 8.0% mgmt
Financing live
Cash to close
- Down payment
- $52,250
- Closing costs
- $6,270
- Reserves months
- —
- Total cash needed
- —
Loan-product check · same deal, 3 products live
Conventional
25% down · 7.5% · 30yr
- Down + closing
- —
- Monthly P&I
- —
- Monthly cashflow
- —
- DSCR
- —
- Eligible?
- —
Personal DTI + credit; lowest rate.
DSCR
20% down · 8.5% · 30yr
- Down + closing
- —
- Monthly P&I
- —
- Monthly cashflow
- —
- DSCR
- —
- Eligible?
- —
No personal income docs; deal must DSCR.
Hard money
10% down · 12.0% · 12mo
- Down + closing
- —
- Monthly P&I
- —
- Monthly cashflow
- —
- DSCR
- —
- Eligible?
- —
Short-term bridge; refi at stabilization.
Rent comps 3 comps
| Address | Beds | Baths | Sqft | Rent | $/sqft | DOM | Units | Dist |
|---|---|---|---|---|---|---|---|---|
| 1250 Pelham Pkwy S Unit B Bronx, NY | 1.0 | 1.0 | 725 | $2,850 | $3.93 | 24d | 1 | 0.89mi |
| 2311 Crotona Ave Apt 2 Bronx, NY | 3.0 | 1.0 | 950 | $3,350 | $3.53 | 24d | 1 | 0.97mi |
| 2311 Crotona Ave Apt 1 Bronx, NY | 3.0 | 1.0 | 950 | $3,350 | $3.53 | 20d | 1 | 0.97mi |
HOA detail condo
- Monthly dues
- $0 · $0/yr
- Assessments
- None detected in remarks — confirm with the listing agent.
Listing history 11 events
-
2026-06-16status $209,000 Pending 43 DOM
-
2026-06-15days on market $209,000 Active 43 DOM
-
2026-06-13days on market $209,000 Active 41 DOM
-
2026-06-10days on market $209,000 Active 37 DOM
-
2026-06-08days on market $209,000 Active 36 DOM
-
2026-06-08days on market $209,000 Active 35 DOM
-
2026-06-04days on market $209,000 Active 32 DOM
-
2026-06-03days on market $209,000 Active 31 DOM
-
2026-06-01days on market $209,000 Active 29 DOM
-
2026-05-31days on market $209,000 Active 28 DOM
-
2026-05-02$209,000 Active
ⓘ Source: listings_history table (triggers on properties + properties_extension) + one-shot
backfill from property_details.listing_events for pre-trigger history.
Climate risk First Street
- Flood 1/10 Low FEMA zone X (unshaded) · 0% chance over 30 yrs
- Wildfire 1/10 Low
- Heat 6/10 Major 7 d/yr ≥99°F today · 15 d/yr by 30 yrs out
- Wind 6/10 Major 27% chance of damaging wind over 30 yrs
- Air quality 3/10 Moderate 3 unhealthy d/yr today · 4 by 30 yrs out
Nearby sold comps map
Loading sold comps map…
Walkable amenities ~0.75 mi
Loading nearby amenities…
Taxation est. · year 1
- Rental income
- $35,576
- − Mortgage interest
- −$11,707
- − Property taxes
- −$3,135
- − Insurance
- −$1,045
- − Repairs & maintenance
- −$2,846
- − Management
- −$2,846
- − HOA
- −$11,172
- − Depreciation
- −$6,080
- Taxable loss
- −$3,256
- Est. tax savings @ 24.0%
- +$781
- After-tax cash flow
- $382/yr
For passive investors: Depreciation is non-cash, so a rental often shows a tax loss while cash-flowing — sheltering income. Rental losses are passive: they offset passive income freely, and up to $25,000/yr can offset ordinary (W-2) income if you actively participate and your MAGI is under $100k (phasing out to $0 by $150k); unused losses carry forward. On sale, claimed depreciation is recaptured at up to 25%, and gains may owe capital-gains tax (a 1031 exchange can defer both). Figures are a year-1 estimate at your 24.0% rate — not tax advice; consult a CPA.
Condition & rehab AI · 12 photos
This property is in good condition with a good exterior and interior. It has a good curb appeal and is ready for a fresh coat of paint on the exterior walls and cleaning of the windows to further enhance its value.
Value-add opportunities
- Both Paint the exterior walls — Painting the exterior walls can enhance the curb appeal and increase the home's value.
- Both Clean the windows — Clean windows can improve natural light and make the home more attractive to potential buyers or renters.
Renovation cost estimate screening
Value-add ROI direction
- Both Paint the exterior walls — Painting the exterior walls can enhance the curb appeal and increase the home's value. ↑
- Both Clean the windows — Clean windows can improve natural light and make the home more attractive to potential buyers or renters. ↑
ⓘ Cost ranges are severity-bucket heuristics (US national rule-of-thumb). Get contractor quotes + a written scope before underwriting a rehab budget.
Schools (NCES district)
No district data.
Livability — New York
- Score
- 75/100
- State rank
- #268
- US rank
- #4188
Category grades
Schools grade is shown separately in the Schools card above.
Census & demographics
- Census place
- New York, NY
- County
- Bronx County · 1,197,324 people
- City population
- 7,731,280
- Metro
- New York-Newark-Jersey City, NY-NJ-PA
- Population (ZIP)
- 76,320
- Household income
- $60,966
- Rent vs Own
- Severe rent burden
- 7650.0
Population outlook (Bronx County) Hauer SSP2
- Today (2025)
- 1,607,353 people
- By 2030
- 1,681,852 · +4.6%
- By 2040
- 1,824,421 · +13.5%
- By 2050
- 1,945,470 · +21.0%
- By 2075
- 2,187,887 · +36.1%
- By 2100
- 2,244,136 · +39.6%
Race, ethnicity, and origin ACS 2023
- Neighborhood character
- Diverse neighborhood (Simpson 0.70)
- Race & ethnicity
- Hispanic / Latino 46% Black 22% Asian 18% White 10% Two or more races 9% Native American 1%
- Hispanic origin (detail)
- Mexican 4% Puerto Rican 17% Dominican 15%
- Foreign-born
- 34% · Canada, China, Vietnam
- Languages at home
- 39% English-only · Spanish 36% Other Indo-European 16% Arabic 3%
Political lean MEDSL · Bronx
- 2024 margin
- Solid D (+45.4) · D 72.7% · R 27.3%
- 2008→2024 swing
- -32.3pp toward R · 2008: 77.8pp · 2024: 45.4pp
- All cycles
- 2024: D+45.4 2020: D+67.6 2016: D+79.1 2012: D+82.9 2008: D+77.8
Not yet ingested
- Civics
- —
Market trends
- HPI YoY
- ▼ -41.59%
- Current HPI
- 356.326
- Rent YoY
- ▲ 9.43%
- Metro
- New York-Newark-Jersey City, NY-NJ-PA
- State GDP YoY
- ▲ 2.60%
- F500 in state
- 92
Industry mix (Fortune 500 HQ in NY)
| Industry | F500 HQs | Revenue |
|---|---|---|
| Financial Services | 10 | $950B |
|
||
| Consumer Goods | 9 | $162B |
|
||
| Insurance | 4 | $225B |
|
||
| Telecommunications | 2 | $144B |
|
||
| Pharmaceuticals | 2 | $112B |
|
||
| Media / Entertainment | 2 | $69B |
|
||
Price history
1 event — show timeline
- 2026-05-02 Listed $209,000 OneKey® MLS as Distributed by MLS Grid
Cash-flow waterfall
monthlySold comps — $/sqft
last 12 mo · ≤1 miLoading sold comps…