850 W Sallier St St W #6 · Lake Charles, LA
Flood risk No data
- FEMA flood zone
- —
- Chance of flooding over 30 yrs
- —
- Est. flood insurance / yr
- —
Fire risk No data
- Est. fire insurance / yr
- —
Heat risk No data
- Hot days now (above threshold)
- —
- Hot days in 30 yrs
- —
Wind risk No data
- Chance of severe wind over 30 yrs
- —
Air-quality risk No data
- Unhealthy air days now
- —
- Unhealthy air days in 30 yrs
- —
Risk factors via First Street. Map © Google.
Why this score? — see what drove the F grade
The composite is a weighted blend of 9 inputs, each scored 0–100. Each bar is that input's sub-score; the figure is the points it added to the 100-point composite (weight × sub-score).
- Cash flow +11.2/30.0
- Rent growth +4.0/5.0
- 1% rule +3.7/10.0
- Livability +3.4/5.0
- DSCR +3.3/10.0
- Schools +3.1/10.0
- ARV discount +2.5/15.0
- Condition / age +2.5/5.0
- Appreciation +0.0/10.0
$215,000
🖨 Deal sheet (PDF) 📄 Offer letter ✓ Due diligence
Listing remarks MLS
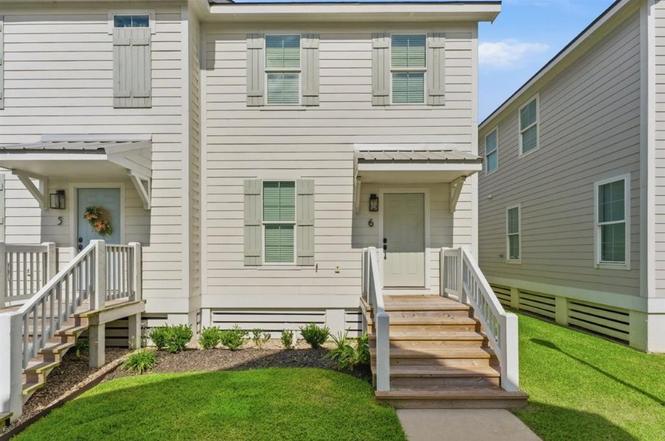
Welcome to Sallier Trace! Beautiful townhomes built by JC Homes and Development, near downtown! 2 bedroom or 3 bedroom options available. All units will have a covered back patio and covered parking. Neutral color palette and open concept make this home inviting to all. All measurements are more or less, all pictures are artist renderings. Yard maintenance and common area maintenance will be covered with HOA dues. All pictures are of the model home (Unit #1).
Key facts
- Open floor plan
- Spacious kitchen
- Natural light
Tags
Property features AI
Finance
- Other: Subdivision: REF4-NEW SUB
- HOA & community: Homeowners association with $75 monthly fee; Community street lights
Exterior
- Parking: 2 total parking spaces; Attached covered carport (2-car carport); Open parking available
- Utilities: Public water; Public sewer; Electricity connected; Water connected; Sewer connected
- Home design: Townhouse (attached with 1 common wall); Two-story; Raised foundation; Builder: JC Homes and Development; Entry level information not provided; Facing direction not provided
- Construction: Shingle roof; Raised foundation
- Exterior features: Covered patio/porch; City lot; Rectangular lot; City street frontage; Has a view
Interior
- Kitchen: Dishwasher; Microwave; Oven; Range
- Bedrooms: Townhouse with two levels (bedroom count not provided)
- Bathrooms: 1 full bathroom; 1 half bathroom; 1 main-level bathroom
- Heating & cooling: Central heating; Central air; Ceiling fans
- Interior features: Granite counters; Kitchen island; Pantry
- Laundry & utility: Washer hookup; Electric dryer hookup
Neighborhood map
What this means for you Summary
Snapshot
- This is a 2-bed/1.5-bath townhouse listed at $215k.
Deal economics
- At list price, monthly cash flow is $-81 ($-974/yr) — negative.
- To cash-flow at today's rent, offer at most $203k (5.5% below list).
- To meet the 1% rule (rent ≥ 1% of price), the offer needs to be $187k (12.9% below list).
- Recommended offer: $187k (12.9% below list) — sets the bar for 1% rule.
- Cap rate 5.8% vs local median 4.3% in Lake Charles — top-decile yield for the area; either an underpriced asset or a hidden risk that comps aren't pricing in. Stress-test before assuming the spread holds.
Location & tenants
- Location reads 68/100 on livability (#95 in LA) — a middle-class / working-renter tenant base. Strengths: commute A+, cost of living A+, housing A+; Watch: crime F, amenities F, employment D-.
- Calcasieu Parish (other): math 30% / reading 44% proficiency, ranked #29 of 98 in LA (top 30%) — families likely to look elsewhere, expect single-tenant / working-renter base with shorter leases.
- Zoned schools: Barbe Elementary School (math 12% / reading 32%, grade F, #415 of 646 statewide, top 67%, 164 students, 84% FRL); Washington/Marion Magnet High School (math 8% / reading 12%, grade F, #241 of 265 statewide, top 93%, 587 students, 80% FRL) — zoned schools average 82% FRL vs 52% district-wide (30 pts higher); higher-poverty schools than district average — tighter screening recommended.
- Zoned-school proficiency averages 16% at this address vs 37% district-wide (-21 pts) — the specific schools serving this property underperform the Calcasieu Parish average; the district grade overstates school quality for this exact location.
- Market conditions: Rents rising fast (+6.2%/yr); 364 active listings in the ZIP; 6 comparable units currently listed for rent nearby; rentals lingering (median 45d on market — plan ~5-8 weeks vacancy on turnover, expect pricing pressure); 83% of comp listings sitting > 30 days — soft ceiling on asking rent; 1,298 units permitted in Calcasieu Parish in 2024 (526 in 5+ unit buildings).
- This rent runs 45% of the median local income ($50k/yr) — at the standard rent-burdened threshold; future hikes will face affordability resistance.
Forward outlook
- Local home prices are declining (-3.0%/yr); year-one equity from $1k of loan paydown is wiped out by about $6k of value loss. Plan a longer hold.
- Calcasieu County population projected at +11% by 2050 — modest demand growth; plan on rents tracking national, not racing it.
Negotiation context
- Only 9 days on market — expect competitive offers; lowballing is unlikely to land.
- 2 sale attempts since 5y ago with the ask held roughly flat each time — persistent listings suggest the price (not the market) is what's stuck; bring a comps-based counter.
Questions for the listing agent
- What do current leases actually rent for vs. the listed asking? Can we see a recent rent roll and the last 12 months of T-12 income?
- What does the HOA fee cover, when was the last increase, and are there any pending special assessments or reserve-fund shortfalls?
- Is there a deadline driving the sale (1031 exchange, divorce, estate, relocation)? That informs how much negotiation room exists.
- Schools are B-rated — typically a magnet for longer-tenancy family renters. What's the average tenant stay here, and is there a school-zone premium baked into asking?
- Crime grade is F in this area — have there been break-ins, vandalism, or insurance claims at this property in the last 3 years? What carrier currently insures it and at what premium?
- The area grade is low — what's the realistic commute time and amenity access for the typical tenant pool here? Any planned neighborhood developments (good or bad) we should know about?
- What's the average days-on-market for RENTAL listings here right now (not sales)? A rising rental-DOM trend means longer vacancies and softer asking-rent achievability than the comps imply.
- What's the recent tenant-quality profile in this submarket — average credit score on applications, eviction rate, late-payment / NSF rate, and stable-employment percentage? A property-management company in the area should have these aggregated.
- How much new for-sale + rental construction is in the pipeline within 1–3 miles? Heavy new supply typically softens prices + rents 12–24 months out; constrained supply supports both.
Investment metrics
- 1% rule
- 0.87% ✗
- Cap rate
- 5.84%
- Cash-on-cash
- -1.62%
- DSCR
- 0.93
- GRM
- 9.6
CMA / ARV
- ARV (on-the-fly)
- $193,452
- Comps found
- 2
Show comp detail 2 sales within ~0.75 mi
| Address | Dist | Beds/Ba | Sqft | Sold | Price | $/sf | Match |
|---|---|---|---|---|---|---|---|
| 2328 Lake St | 0.36mi | 2/2.5 | 1,414 (+7%) | 2mo | $135,000 | $95 | 65 |
| 1705 Ethel St Unit A | 0.72mi | 2/2.5 | 1,364 (+4%) | 23mo | $201,000 | $147 | 37 |
Match score weights: distance 35% · size 25% · config 20% · recency 20%. Top-matched comps best support the ARV.
Projected returns pro-forma
-3.0% appreciation · 6.18% rent growth · sell at horizon
- IRR
- -15.3%
- Equity multiple
- 0.44×
- Total profit
- $-33,749
- Equity at exit
- $32,057
- IRR
- -1.8%
- Equity multiple
- 0.86×
- Total profit
- $-8,650
- Equity at exit
- $18,589
Cash invested: $60,200 (down + closing). Projections, not guarantees.
Landlord ↔ Tenant lean methodology
- Overall (STATE)
- 90 Strongly Landlord-Friendly
- State Louisiana
- 90 Strongly Landlord-Friendly · R+12
- County
- — inherits STATE
- City
- — inherits STATE
ZIP-level market 70601
- Rents YoY
- 6.2%
- Active inventory
- 364
- Price-to-rent
- 9.6×
Monthly cashflow live
- Estimated rent
- $1,873 high interval (Pro) →
- Mortgage (P&I)
- −$1,127
- Tax est. 1.5%
- −$269 /mo · $3,225/yr
- Insurance
- −$90
- HOA
- −$75
- Vacancy / Maint / Mgmt
- −$393
- Net cashflow
- $-81
Break-even live
Sensitivity live
| Price | -10% $67 | -5% $-7 | +0% $-81 | +5% $-155 | +10% $-230 |
|---|---|---|---|---|---|
| Rent | -10% $-229 | -5% $-155 | +0% $-81 | +5% $-7 | +10% $67 |
| Rate | -1.0pp $27 | -0.5pp $-26 | base $-81 | +0.5pp $-137 | +1.0pp $-194 |
UW: 25.0% down · 7.5% · 30yr · 1.5% tax · 5.0% vac · 8.0% maint · 8.0% mgmt
Financing live
Cash to close
- Down payment
- $53,750
- Closing costs
- $6,450
- Reserves months
- —
- Total cash needed
- —
Loan-product check · same deal, 3 products live
Conventional
25% down · 7.5% · 30yr
- Down + closing
- —
- Monthly P&I
- —
- Monthly cashflow
- —
- DSCR
- —
- Eligible?
- —
Personal DTI + credit; lowest rate.
DSCR
20% down · 8.5% · 30yr
- Down + closing
- —
- Monthly P&I
- —
- Monthly cashflow
- —
- DSCR
- —
- Eligible?
- —
No personal income docs; deal must DSCR.
Hard money
10% down · 12.0% · 12mo
- Down + closing
- —
- Monthly P&I
- —
- Monthly cashflow
- —
- DSCR
- —
- Eligible?
- —
Short-term bridge; refi at stabilization.
Rent comps 6 comps
| Address | Beds | Baths | Sqft | Rent | $/sqft | DOM | Units | Dist |
|---|---|---|---|---|---|---|---|---|
| 1812 Ethel St Lake Charles, LA | 3.0 | 2.0 | 1589 | $3,850 | $2.42 | 45d | 1 | 0.68mi |
| 1731 Elms St Lake Charles, LA | 3.0 | 2.0 | 1575 | $2,000 | $1.27 | 45d | 1 | 0.82mi |
| 125 East St Lake Charles, LA | 3.0 | 2.0 | 1138 | $3,850 | $3.38 | 45d | 1 | 0.83mi |
| 2700 Ernest St Lake Charles, LA | 1.0–3.0 | 1.0–2.0 | 1054 | $1,333 | $1.26 | 14d | 1 | 0.89mi |
| 1710 Granger St Lake Charles, LA | 3.0 | 2.5 | 1450 | $1,900 | $1.31 | 45d | 1 | 1.05mi |
| 422 W Lagrange St Lake Charles, LA | 2.0 | 2.0 | 995 | $1,050 | $1.06 | 45d | 1 | 1.38mi |
HOA detail
- Monthly dues
- $75 · $900/yr
Listing history 9 events
-
2026-06-21statusdays on market $215,000 Pending 9 DOM
-
2026-06-19days on market $215,000 Active 8 DOM
-
2026-06-18days on market $215,000 Active 7 DOM
-
2026-06-17days on market $215,000 Active 6 DOM
-
2026-06-16days on market $215,000 Active 5 DOM
-
2026-06-15days on market $215,000 Active 4 DOM
-
2026-06-14days on market $215,000 Active 2 DOM
-
2026-06-13remarks 699-char remark
-
2026-06-13$215,000 Active 1 DOM
ⓘ Source: listings_history table (triggers on properties + properties_extension) + one-shot
backfill from property_details.listing_events for pre-trigger history.
Nearby sold comps map
Loading sold comps map…
Walkable amenities ~0.75 mi
Loading nearby amenities…
Taxation est. · year 1
- Rental income
- $22,476
- − Mortgage interest
- −$12,043
- − Property taxes
- −$3,225
- − Insurance
- −$1,075
- − Repairs & maintenance
- −$1,798
- − Management
- −$1,798
- − HOA
- −$900
- − Depreciation
- −$6,255
- Taxable loss
- −$4,618
- Est. tax savings @ 24.0%
- +$1,108
- After-tax cash flow
- $135/yr
For passive investors: Depreciation is non-cash, so a rental often shows a tax loss while cash-flowing — sheltering income. Rental losses are passive: they offset passive income freely, and up to $25,000/yr can offset ordinary (W-2) income if you actively participate and your MAGI is under $100k (phasing out to $0 by $150k); unused losses carry forward. On sale, claimed depreciation is recaptured at up to 25%, and gains may owe capital-gains tax (a 1031 exchange can defer both). Figures are a year-1 estimate at your 24.0% rate — not tax advice; consult a CPA.
Schools (NCES district)
- District
- Calcasieu Parish
- NCES district ID
- 2200330
- Math proficiency
- 30% ▼ -39.00%
- Reading proficiency
- 44% ▼ -33.00%
- Median HH income
- $44,700
- Composite
- 31.45/100
- National rank
- #5979
- State rank
- #29 of 98 in LA
Livability — Lake Charles
- Score
- 68/100
- State rank
- #95
- US rank
- #9820
Category grades
Schools grade is shown separately in the Schools card above.
Census & demographics
- Census place
- Lake Charles, LA
- County
- Calcasieu Parish · 170,889 people
- City population
- 133,538
- Metro
- Lake Charles, LA
- Population (ZIP)
- 30,872
- Household income
- $49,992
- Rent vs Own
- Severe rent burden
- 1304.0
Population outlook (Calcasieu County) Hauer SSP2
- Today (2025)
- 212,179 people
- By 2030
- 218,199 · +2.8%
- By 2040
- 228,486 · +7.7%
- By 2050
- 236,208 · +11.3%
- By 2075
- 251,696 · +18.6%
- By 2100
- 247,848 · +16.8%
Race, ethnicity, and origin ACS 2023
- Neighborhood character
- Diverse neighborhood (Simpson 0.55)
- Race & ethnicity
- Black 59% White 31% Two or more races 7% Hispanic / Latino 5%
- Common ancestry
- Lithuanian 7% Iranian 1% Serbian 1%
- Foreign-born
- 3% · Canada
- Languages at home
- 95% English-only · Spanish 2% French/Haitian/Cajun 1%
Political lean MEDSL · Calcasieu
- 2024 margin
- Solid R (+39.6) · D 29.5% · R 69.0% · Other 1.5%
- 2008→2024 swing
- -15.0pp toward R · 2008: -24.6pp · 2024: -39.6pp
- All cycles
- 2024: R+39.6 2020: R+35.2 2016: R+33.3 2012: R+28.7 2008: R+24.6
Not yet ingested
- Civics
- —
Market trends
- HPI YoY
- ▼ -109.32%
- Current HPI
- 55.6127
- Rent YoY
- ▲ 6.18%
- Metro
- Lake Charles, LA
- State GDP YoY
- ▲ 3.29%
- F500 in state
- 10
Industry mix (Fortune 500 HQ in LA)
| Industry | F500 HQs | Revenue |
|---|---|---|
| Telecommunications | 2 | $23B |
|
||
| Utilities | 1 | $12B |
|
||
| Wholesale / Distribution | 1 | $5B |
|
||
| Advertising | 1 | $2B |
|
||
Price history
+1.2% since first listed3 events — show timeline
- 2026-06-11 Listed $215,000 SWLAR
- 2022-07-08 Sold (MLS) — SWLAR
- 2021-08-31 Listed $212,500 SWLAR
Cash-flow waterfall
monthlySold comps — $/sqft
last 12 mo · ≤1 miLoading sold comps…