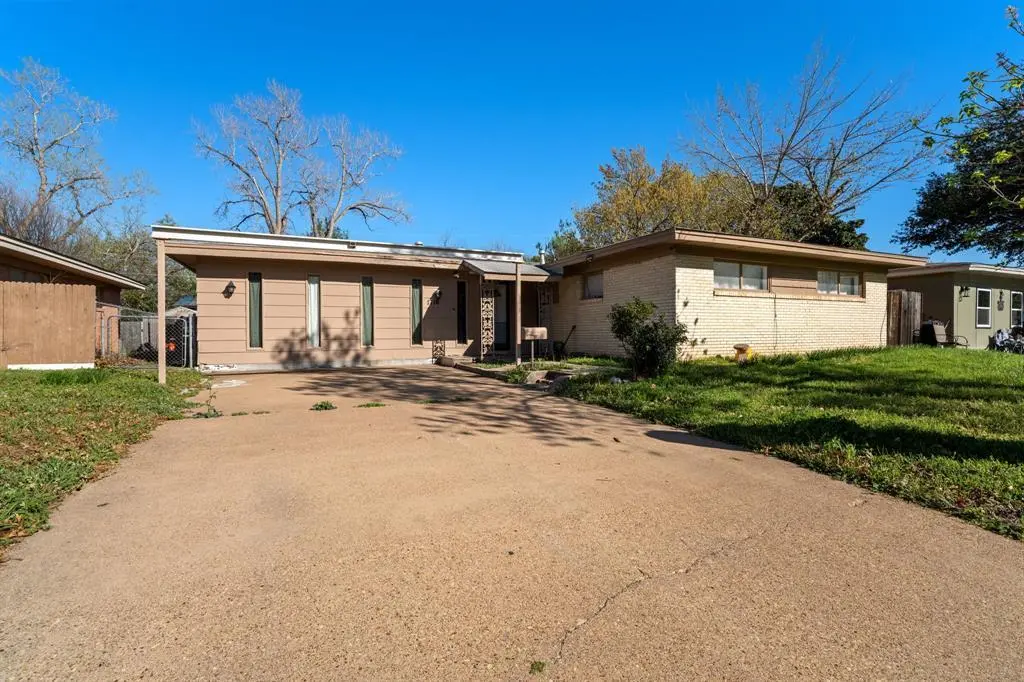
1716 John Smith Dr · Irving, TX
Flood risk 1/10 · Minimal
- FEMA flood zone
- X (unshaded)
- Chance of flooding over 30 yrs
- 0.0%
- Est. flood insurance / yr
- $507 – $1,088
Fire risk 1/10 · Minimal
- Est. fire insurance / yr
- $1,222 – $2,270
Heat risk 7/10 · Major
- Hot days now (above 109°F)
- 7 days/yr
- Hot days in 30 yrs
- 23 days/yr
Wind risk 6/10 · Moderate
- Chance of severe wind over 30 yrs
- 27.0%
Air-quality risk 3/10 · Minor
- Unhealthy air days now
- 2 days/yr
- Unhealthy air days in 30 yrs
- 3 days/yr
Risk factors via First Street. Map © Google.
Why this score? — see what drove the F grade
The composite is a weighted blend of 9 inputs, each scored 0–100. Each bar is that input's sub-score; the figure is the points it added to the 100-point composite (weight × sub-score).
- ARV discount +10.1/15.0
- Cash flow +8.0/30.0
- Livability +4.0/5.0
- 1% rule +2.7/10.0
- Rent growth +2.7/5.0
- Condition / age +2.5/5.0
- DSCR +2.1/10.0
- Schools +1.9/10.0
- Appreciation +0.0/10.0
$330,000
🖨 Deal sheet 📄 Offer letter ✓ Due diligence
Listing remarks MLS
This spacious 6-bedroom, 3.5-bath home offers incredible flexibility for a variety of living arrangements. The previous owner utilized the home as an investment property, creating strong income potential. With generous square footage and multiple bedrooms, it presents a unique opportunity for both investors and homeowners alike. Most furniture in photos is negotiable with acceptable offer.
Key facts
- 7,405 sq ft lot
- 2 parking spots
- Built 1954
Neighborhood map
What this means for you Summary
Snapshot
- This is a 4-bed/1.5-bath single-family listed at $330k.
Deal economics
- At list price, monthly cash flow is $-337 ($-4k/yr) — negative.
- To cash-flow at today's rent, offer at most $270k (18.0% below list).
- To meet the 1% rule (rent ≥ 1% of price), the offer needs to be $254k (23.0% below list).
- Recommended offer: $254k (23.0% below list) — sets the bar for 1% rule.
- Cap rate 5.1% vs local median 2.6% in Irving — top-decile yield for the area; either an underpriced asset or a hidden risk that comps aren't pricing in. Stress-test before assuming the spread holds.
Location & tenants
- Location reads 80/100 on livability (#45 in TX, #1,913 nationally) — a professional / high-income tenant draw. Strengths: commute A+, cost of living A+, housing A+; Watch: amenities C-.
- Irving ISD (urban): math 19% / reading 25% proficiency, ranked #751 of 826 in TX (top 91%) — low school quality limits family demand, transient renter base, plan for 1-2y turnover; 72% free/reduced lunch — lower-income household profile, screen leases tightly.
- Market conditions: Rents flat; 101 active listings in the ZIP; 24 comparable units currently listed for rent nearby; rentals at typical pace (median 24d on market — plan ~3-4 weeks tenant-placement turnaround); 46% of comp listings sitting > 30 days — soft ceiling on asking rent; 12,577 units permitted in Dallas County in 2024 (6,829 in 5+ unit buildings).
- At $2,542/mo this rent would consume 48% of the median local household income ($64k/yr) (locally 2930% of renters already pay >50% of income on rent) — very limited rent-growth headroom before tenants either downsize or default.
Forward outlook
- Local home prices are declining (-3.0%/yr); year-one equity from $2k of loan paydown is wiped out by about $10k of value loss. Plan a longer hold.
- Dallas County population projected at +35% by 2050 — long-run rental-demand tailwind backs the buy-and-hold thesis.
Negotiation context
- It's been on market 96 days — a 9% lower offer ($300k) is reasonable based on typical stale-listing flexibility.
- 5 sale attempts since 24y ago; this cycle's ask has dropped $45k (12%) from the opening price — seller is motivated, your offer sets the floor, not the list.
Risks & watch-outs
- Watch-outs: built in 1954 — expect roof / HVAC / electrical / plumbing capex.
- Climate carrying-cost: major wind risk, 27% chance of damaging wind over 30y; extreme-heat days projected 7→23/yr by 2055 (HVAC capex compounding) — expect insurance premiums to compound above CPI over the hold.
Questions for the listing agent
- What do current leases actually rent for vs. the listed asking? Can we see a recent rent roll and the last 12 months of T-12 income?
- It's been on market 96 days. Have you received any prior offers? Is the seller open to a 23% concession, seller financing, or rate buy-down credit?
- Built in 1954 — when were the roof, HVAC, electrical panel, plumbing, and water heater last replaced?
- Why hasn't it sold? Are there any deal-killer items the seller is aware of (foundation, flood, title, zoning, code violations)?
- Is there a deadline driving the sale (1031 exchange, divorce, estate, relocation)? That informs how much negotiation room exists.
- The area grade is low — what's the realistic commute time and amenity access for the typical tenant pool here? Any planned neighborhood developments (good or bad) we should know about?
- What's the average days-on-market for RENTAL listings here right now (not sales)? A rising rental-DOM trend means longer vacancies and softer asking-rent achievability than the comps imply.
- What's the recent tenant-quality profile in this submarket — average credit score on applications, eviction rate, late-payment / NSF rate, and stable-employment percentage? A property-management company in the area should have these aggregated.
- How much new for-sale + rental construction is in the pipeline within 1–3 miles? Heavy new supply typically softens prices + rents 12–24 months out; constrained supply supports both.
Investment metrics
- 1% rule
- 0.77% ✗
- Cap rate
- 5.07%
- Cash-on-cash
- -4.37%
- DSCR
- 0.81
- GRM
- 10.8
CMA / ARV
- ARV (median comp)
- $349,900
- List price
- $330,000
- Delta
- -5.69%
- Verdict
- FAIR
- Comps
- 7 within 1.0 mi
Show comp detail 12 sales within ~0.75 mi
| Address | Dist | Beds/Ba | Sqft | Sold | Price | $/sf | Match |
|---|---|---|---|---|---|---|---|
| 1933 Standish Dr | 0.06mi | 4/2.0 | 1,970 (+2%) | 2mo | $324,900 | $165 | 91 |
| 1812 Pilgrim Dr | 0.20mi | 3/2.0 (-1) | 2,092 (+8%) | 2mo | $385,000 | $184 | 69 |
| 2606 William Brewster Dr | 0.57mi | 5/2.5 (+1) | 1,945 (+0%) | 3mo | $349,900 | $180 | 61 |
| 1904 Sunnybrook Dr | 0.50mi | 3/2.0 (-1) | 1,912 (-1%) | 8mo | $420,000 | $220 | 61 |
| 1809 James St | 0.28mi | 3/2.0 (-1) | 1,728 (-11%) | 3mo | $300,000 | $174 | 60 |
| 1912 Sunnybrook Dr | 0.51mi | 3/2.0 (-1) | 1,826 (-6%) | 1mo | $405,000 | $222 | 59 |
| 1601 Briarwood Ln | 0.49mi | 4/2.0 | 1,787 (-8%) | 9mo | $349,999 | $196 | 55 |
| 1719 Belmead Ln | 0.45mi | 4/3.0 | 1,756 (-9%) | 3mo | $320,000 | $182 | 55 |
| 1912 S Harvard St | 0.69mi | 3/2.0 (-1) | 2,027 (+5%) | 1mo | $310,000 | $153 | 52 |
| 820 Belltower Dr | 0.66mi | 3/3.0 (-1) | 1,810 (-6%) | 4mo | $389,000 | $215 | 44 |
| 909 Lexington Dr | 0.71mi | 4/2.0 | 1,692 (-13%) | 3mo | $279,000 | $165 | 41 |
| 2812 William Brewster Dr | 0.74mi | 4/3.0 | 2,162 (+12%) | 1mo | $454,000 | $210 | 39 |
Match score weights: distance 35% · size 25% · config 20% · recency 20%. Top-matched comps best support the ARV.
Projected returns pro-forma
-3.0% appreciation · 0.72% rent growth · sell at horizon
- IRR
- -26.3%
- Equity multiple
- 0.13×
- Total profit
- $-80,551
- Equity at exit
- $49,204
- IRR
- -33.5%
- Equity multiple
- -0.30×
- Total profit
- $-119,800
- Equity at exit
- $28,532
Cash invested: $92,400 (down + closing). Projections, not guarantees.
Landlord ↔ Tenant lean methodology
- Overall (STATE)
- 87 Strongly Landlord-Friendly
- State Texas
- 87 Strongly Landlord-Friendly · R+5
- County
- — inherits STATE
- City
- — inherits STATE
ZIP-level market 75061
- Rents YoY
- 0.7%
- Active inventory
- 101
- Price-to-rent
- 10.8×
Monthly cashflow live
- Estimated rent
- $2,542 high interval (Pro) →
- Mortgage (P&I)
- −$1,731
- Tax from tax record
- −$477 /mo · $5,721/yr
- Insurance
- −$138
- HOA
- −$0
- Vacancy / Maint / Mgmt
- −$534
- Net cashflow
- $-337
Break-even live
UW: 25.0% down · 7.5% · 30yr · 1.5% tax · 5.0% vac · 8.0% maint · 8.0% mgmt
Financing live
Cash to close
- Down payment
- $82,500
- Closing costs
- $9,900
- Reserves months
- —
- Total cash needed
- —
Loan-product check · same deal, 3 products live
Conventional
25% down · 7.5% · 30yr
- Down + closing
- —
- Monthly P&I
- —
- Monthly cashflow
- —
- DSCR
- —
- Eligible?
- —
Personal DTI + credit; lowest rate.
DSCR
20% down · 8.5% · 30yr
- Down + closing
- —
- Monthly P&I
- —
- Monthly cashflow
- —
- DSCR
- —
- Eligible?
- —
No personal income docs; deal must DSCR.
Hard money
10% down · 12.0% · 12mo
- Down + closing
- —
- Monthly P&I
- —
- Monthly cashflow
- —
- DSCR
- —
- Eligible?
- —
Short-term bridge; refi at stabilization.
Rent comps 24 comps
| Address | Beds | Baths | Sqft | Rent | $/sqft | DOM | Units | Dist |
|---|---|---|---|---|---|---|---|---|
| 1919 Puritan Dr Irving, TX | 5.0 | 2.0 | 1947 | $8,250 | $4.24 | 24d | 1 | 0.24mi |
| 1919 Puritan Dr Unit 1019566P Irving, TX | 5.0 | 2.0 | 1937 | $13,405 | $6.92 | 21d | 1 | 0.24mi |
| 2404 Crestview Cir Irving, TX | 5.0 | 2.5 | 2497 | $5,000 | $2.00 | 1d | 1 | 0.54mi |
| 1800 Navajo Pl Irving, TX | 3.0 | 2.5 | 1557 | $2,300 | $1.48 | 7d | 1 | 0.63mi |
| 1809 Salem St Unit 1019481P Irving, TX | 4.0 | 2.0 | 1517 | $13,891 | $9.16 | 21d | 1 | 0.64mi |
| 1809 Salem St Irving, TX | 4.0 | 2.0 | 1523 | $8,750 | $5.75 | 24d | 1 | 0.64mi |
| 2540 W Rochelle Rd Irving, TX | 4.0 | 3.0 | 1600 | $2,600 | $1.62 | 43d | 1 | 0.76mi |
| 2508 McClure St Irving, TX | 4.0 | 2.0 | 1895 | $2,500 | $1.32 | 43d | 1 | 0.77mi |
| 2613 Fairbrook St Irving, TX | 4.0 | 3.5 | 1876 | $2,699 | $1.44 | 7d | 1 | 0.82mi |
| 2717 Wesleyan Dr Irving, TX | 4.0 | 2.0 | 1603 | $2,295 | $1.43 | 43d | 1 | 0.85mi |
| 2138 Onetta Dr Irving, TX | 3.0 | 2.0 | 1467 | $2,085 | $1.42 | 24d | 1 | 0.91mi |
| 111 Saint Clair Dr E Irving, TX | 3.0 | 2.0 | 1362 | $2,500 | $1.84 | 43d | 1 | 0.94mi |
| 2346 N MacArthur Blvd Irving, TX | 1.0–3.0 | 1.0–2.0 | 1031 | $1,616 | $1.57 | 1d | 27 | 0.95mi |
| 2801 Clearbrook Dr Irving, TX | 3.0 | 2.0 | 2259 | $3,500 | $1.55 | 43d | 1 | 0.98mi |
| 2924 Pritchett Dr Irving, TX | 3.0 | 2.0 | 1579 | $2,245 | $1.42 | 18d | 1 | 1.03mi |
| 919 W Rochelle Rd Unit 921 Irving, TX | 3.0 | 2.5 | 1495 | $1,895 | $1.27 | 43d | 1 | 1.17mi |
| 2003 N O Connor Rd Irving, TX | 3.0 | 2.0 | 1682 | $8,850 | $5.26 | 43d | 1 | 1.20mi |
| 3031 Lela St Irving, TX | 3.0 | 2.0 | 1242 | $2,150 | $1.73 | 43d | 1 | 1.22mi |
| 2213 Jimmydee Dr Irving, TX | 3.0 | 2.0 | 1393 | $2,400 | $1.72 | 14d | 1 | 1.30mi |
| 1621 Finley Rd Irving, TX | 3.0 | 2.0 | 1645 | $2,300 | $1.40 | 7d | 1 | 1.31mi |
| 110 Crandall Rd Unit 112-Right Side Irving, TX | 3.0 | 2.5 | 1425 | $1,975 | $1.39 | 43d | 1 | 1.36mi |
| 3506 Bangor Ct E Irving, TX | 3.0 | 1.5 | 1469 | $2,250 | $1.53 | 43d | 1 | 1.43mi |
| 1928 Canterbury St Irving, TX | 4.0 | 2.0 | 1790 | $2,509 | $1.40 | 43d | 1 | 1.43mi |
| 1009 McCoy Dr Irving, TX | 4.0 | 3.0 | 2285 | $3,000 | $1.31 | 24d | 1 | 1.44mi |
Listing history 33 events
-
2026-06-18days on market $330,000 Active 96 DOM
-
2026-06-17days on market $330,000 Active 95 DOM
-
2026-06-16days on market $330,000 Active 94 DOM
-
2026-06-15days on market $330,000 Active 93 DOM
-
2026-06-13days on market $330,000 Active 91 DOM
-
2026-06-13days on market $330,000 Active 90 DOM
-
2026-06-09days on market $330,000 Active 87 DOM
-
2026-06-08days on market $330,000 Active 86 DOM
-
2026-06-07days on market $330,000 Active 85 DOM
-
2026-06-04days on market $330,000 Active 82 DOM
-
2026-06-03days on market $330,000 Active 81 DOM
-
2026-06-02days on market $330,000 Active 80 DOM
-
2026-06-01days on market $330,000 Active 79 DOM
-
2026-05-31days on market $330,000 Active 78 DOM
-
2026-04-10price $349,000 394-char remark
Show marketing remark (394 chars)
This spacious 6-bedroom, 3.5-bath home offers incredible flexibility for a variety of living arrangements. The previous owner utilized the home as an investment property, creating strong income potential. With generous square footage and multiple bedrooms, it presents a unique opportunity for both investors and homeowners alike. Most furniture in photos is negotiable with acceptable offer.
-
2026-03-07$375,000 Active 394-char remark
Show marketing remark (394 chars)
This spacious 6-bedroom, 3.5-bath home offers incredible flexibility for a variety of living arrangements. The previous owner utilized the home as an investment property, creating strong income potential. With generous square footage and multiple bedrooms, it presents a unique opportunity for both investors and homeowners alike. Most furniture in photos is negotiable with acceptable offer.
-
2021-10-18soldstatus
-
2021-10-15soldstatus Sold 493-char remark
Show marketing remark (493 chars)
Charming 5 bed, huge living room, foyer, and laundry room. Ceramic tile and Hardwood floors throughout entire home. No Carpet! Great room at back of home could be used as office. Walking distance to the elementary, junior high school. Minutes away from DFW Airport and Love Field Airport. Minutes away from Dallas, Coppell, Carrollton, Farmer Branch, Addison, Lewisville, Euless, Bedford, Hurst, Grand Prairie, Arlington, and Fort Worth. Walking distance from restaurants and shopping centers.
-
2021-09-16status Pending 493-char remark
Show marketing remark (493 chars)
Charming 5 bed, huge living room, foyer, and laundry room. Ceramic tile and Hardwood floors throughout entire home. No Carpet! Great room at back of home could be used as office. Walking distance to the elementary, junior high school. Minutes away from DFW Airport and Love Field Airport. Minutes away from Dallas, Coppell, Carrollton, Farmer Branch, Addison, Lewisville, Euless, Bedford, Hurst, Grand Prairie, Arlington, and Fort Worth. Walking distance from restaurants and shopping centers.
-
2021-08-17price $269,900 493-char remark
Show marketing remark (493 chars)
Charming 5 bed, huge living room, foyer, and laundry room. Ceramic tile and Hardwood floors throughout entire home. No Carpet! Great room at back of home could be used as office. Walking distance to the elementary, junior high school. Minutes away from DFW Airport and Love Field Airport. Minutes away from Dallas, Coppell, Carrollton, Farmer Branch, Addison, Lewisville, Euless, Bedford, Hurst, Grand Prairie, Arlington, and Fort Worth. Walking distance from restaurants and shopping centers.
-
2021-07-07$299,900 Active 493-char remark
Show marketing remark (493 chars)
Charming 5 bed, huge living room, foyer, and laundry room. Ceramic tile and Hardwood floors throughout entire home. No Carpet! Great room at back of home could be used as office. Walking distance to the elementary, junior high school. Minutes away from DFW Airport and Love Field Airport. Minutes away from Dallas, Coppell, Carrollton, Farmer Branch, Addison, Lewisville, Euless, Bedford, Hurst, Grand Prairie, Arlington, and Fort Worth. Walking distance from restaurants and shopping centers.
-
2021-04-25historical
-
2021-04-23$286,670 Active
-
2019-02-19soldstatus
-
2019-02-15soldstatus Sold
-
2019-01-11historical Active Contingent
-
2018-12-12price $175,000
-
2018-10-31$180,000 Active
-
2009-04-22soldstatus
-
2003-05-21soldstatus
-
2003-04-28historical
-
2002-11-15$119,000
-
1985-07-02soldstatus
ⓘ Source: listings_history table (triggers on properties + properties_extension) + one-shot
backfill from property_details.listing_events for pre-trigger history.
Tax reassessment forecast TX · Resets to sale price
- Current annual tax
- $5,721 · $477/mo
- Projected year-2 tax
- $6,039 · $503/mo
- Expected delta
- +$318/yr (+$26/mo · 5.6%)
ⓘ Screening estimate from a state-policy table — verify with the county assessor before closing.
Climate risk First Street
- Flood 1/10 Low FEMA zone X (unshaded) · 0% chance over 30 yrs
- Wildfire 1/10 Low
- Heat 7/10 Severe 7 d/yr ≥109°F today · 23 d/yr by 30 yrs out
- Wind 6/10 Major 27% chance of damaging wind over 30 yrs
- Air quality 3/10 Moderate 2 unhealthy d/yr today · 3 by 30 yrs out
Nearby sold comps map
Loading sold comps map…
Walkable amenities ~0.75 mi
Loading nearby amenities…
Taxation est. · year 1
- Rental income
- $30,501
- − Mortgage interest
- −$18,485
- − Property taxes
- −$5,721
- − Insurance
- −$1,650
- − Repairs & maintenance
- −$2,440
- − Management
- −$2,440
- − Depreciation
- −$9,600
- Taxable loss
- −$9,835
- Est. tax savings @ 24.0%
- +$2,360
- After-tax cash flow
- $-1,681/yr
For passive investors: Depreciation is non-cash, so a rental often shows a tax loss while cash-flowing — sheltering income. Rental losses are passive: they offset passive income freely, and up to $25,000/yr can offset ordinary (W-2) income if you actively participate and your MAGI is under $100k (phasing out to $0 by $150k); unused losses carry forward. On sale, claimed depreciation is recaptured at up to 25%, and gains may owe capital-gains tax (a 1031 exchange can defer both). Figures are a year-1 estimate at your 24.0% rate — not tax advice; consult a CPA.
Schools (NCES district)
- District
- Irving ISD
- NCES district ID
- 4824420
- Math proficiency
- 19% ▼ -28.00%
- Reading proficiency
- 25% ▼ -11.00%
- Median HH income
- $44,870
- Composite
- 19.06/100
- National rank
- #8840
- State rank
- #751 of 826 in TX
Livability — Irving
- Score
- 80/100
- State rank
- #45
- US rank
- #1913
Category grades
Schools grade is shown separately in the Schools card above.
Census & demographics
- Census place
- Irving, TX
- County
- Dallas County · 2,612,404 people
- City population
- 258,488
- Metro
- Dallas-Fort Worth-Arlington, TX
- Population (ZIP)
- 56,013
- Household income
- $63,798
- Rent vs Own
- Severe rent burden
- 2930.0
Population outlook (Dallas County) Hauer SSP2
- Today (2025)
- 2,979,839 people
- By 2030
- 3,191,823 · +7.1%
- By 2040
- 3,619,611 · +21.5%
- By 2050
- 4,026,915 · +35.1%
- By 2075
- 4,957,073 · +66.4%
- By 2100
- 5,508,725 · +84.9%
Race, ethnicity, and origin ACS 2023
- Neighborhood character
- Predominantly Hispanic (71%)
- Race & ethnicity
- Hispanic / Latino 71% Two or more races 17% White 14% Black 8% Asian 5%
- Hispanic origin (detail)
- Mexican 41%
- Common ancestry
- Serbian 1% Italian 1% Slovak 1%
- Foreign-born
- 41% · Canada, Vietnam, China
- Languages at home
- 30% English-only · Spanish 64% Other Indo-European 3% Vietnamese 1%
Political lean MEDSL · Dallas
- 2024 margin
- Strong D (+22.2) · D 60.2% · R 38.0% · Other 1.8%
- 2008→2024 swing
- +6.9pp toward D · 2008: 15.3pp · 2024: 22.2pp
- All cycles
- 2024: D+22.2 2020: D+31.6 2016: D+26.2 2012: D+15.4 2008: D+15.3
Not yet ingested
- Civics
- —
Market trends
- HPI YoY
- ▼ -213.97%
- Current HPI
- 333.2765
- Rent YoY
- ▲ 0.72%
- Metro
- Dallas-Fort Worth-Arlington, TX
- State GDP YoY
- ▲ 3.95%
- F500 in state
- 110
Industry mix (Fortune 500 HQ in TX)
| Industry | F500 HQs | Revenue |
|---|---|---|
| Energy | 16 | $1,198B |
|
||
| Technology | 5 | $198B |
|
||
| Engineering / Construction | 4 | $72B |
|
||
| Energy Services | 3 | $60B |
|
||
| Utilities | 3 | $41B |
|
||
| Healthcare | 2 | $330B |
|
||
Price history
+193.3% since first listed19 events — show timeline
- 2026-04-10 Price Changed $349,000 NTREIS
- 2026-03-07 Listed $375,000 NTREIS
- 2021-10-18 Sold (Public Records) — Public Records
- 2021-10-15 Sold (MLS) — NTREIS
- 2021-09-16 Pending — NTREIS
- 2021-08-17 Price Changed $269,900 NTREIS
- 2021-07-07 Listed $299,900 NTREIS
- 2021-04-25 Listing Removed — NTREIS
- 2021-04-23 Listed $286,670 NTREIS
- 2019-02-19 Sold (Public Records) — Public Records
- 2019-02-15 Sold (MLS) — NTREIS
- 2019-01-11 Contingent — NTREIS
- 2018-12-12 Price Changed $175,000 NTREIS
- 2018-10-31 Listed $180,000 NTREIS
- 2009-04-22 Sold (Public Records) — Public Records
- 2003-05-21 Sold (Public Records) — Public Records
- 2003-04-28 Listing Removed — NTREIS
- 2002-11-15 Listed $119,000 NTREIS
- 1985-07-02 Sold (Public Records) — Public Records
Property tax history
+4.7%/yrLatest (2025): $5,721 · -3.4% YoY. Source: county tax records.
Cash-flow waterfall
monthlySold comps — $/sqft
last 12 mo · ≤1 miLoading sold comps…