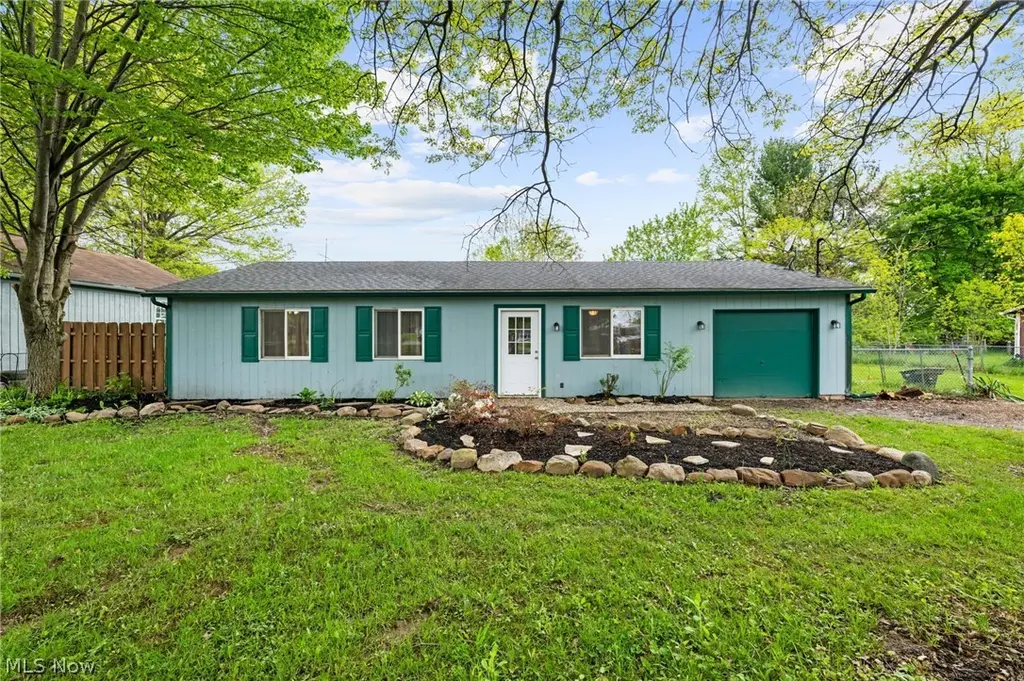
12360 Cowley Rd · Eaton Estates, OH
Flood risk 5/10 · Moderate
- FEMA flood zone
- X (unshaded)
- Chance of flooding over 30 yrs
- 0.65%
- Est. flood insurance / yr
- $473 – $860
Fire risk 1/10 · Minimal
- Est. fire insurance / yr
- $713 – $1,323
Heat risk 3/10 · Minor
- Hot days now (above 98°F)
- 7 days/yr
- Hot days in 30 yrs
- 16 days/yr
Wind risk 1/10 · Minimal
- Chance of severe wind over 30 yrs
- —
Air-quality risk 2/10 · Minimal
- Unhealthy air days now
- 1 days/yr
- Unhealthy air days in 30 yrs
- 2 days/yr
Risk factors via First Street. Map © Google.
Why this score? — see what drove the D grade
The composite is a weighted blend of 9 inputs, each scored 0–100. Each bar is that input's sub-score; the figure is the points it added to the 100-point composite (weight × sub-score).
- ARV discount +15.0/15.0
- Cash flow +8.1/30.0
- Schools +5.0/10.0
- Livability +3.2/5.0
- Rent growth +2.5/5.0
- Condition / age +2.5/5.0
- DSCR +2.1/10.0
- 1% rule +2.0/10.0
- Appreciation +0.0/10.0
$225,000
🖨 Deal sheet 📄 Offer letter ✓ Due diligence
Listing remarks MLS
Almost An Acre! Clean! Full Bath Of Master Br. Large Pretty Eat-in Kitchen. Big Bright Family Rm. Awsome Pool & Fenced Yard. Conveniantly Located. Attached Garage W/ Floored Attic. Big Shed. Plenty Of Storage. Immediate Occupancy.
Key facts
- Attached garage
- Expansive yard
- First floor laundry
Tags
Property features AI
Exterior
- Parking: Attached garage with 1 car space
- Utilities: Public water; Public sewer
- Home design: Single-story home
- Construction: Built (year per public records); Wood siding; Asphalt/fiberglass roof; Below-grade finished area reported
- Exterior features: 0.8-acre lot
Interior
- Bedrooms: 3 main-level bedrooms
- Bathrooms: 2 full bathrooms (both on main level)
- Heating & cooling: Baseboard heating; Has heating
- Interior features: Updated/remodeled condition; 6 total rooms
Neighborhood map
What this means for you Summary
Snapshot
- This is a 3-bed/2.0-bath single-family listed at $225k.
Deal economics
- At list price, monthly cash flow is $-223 ($-3k/yr) — negative.
- To cash-flow at today's rent, offer at most $186k (17.5% below list).
- To meet the 1% rule (rent ≥ 1% of price), the offer needs to be $157k (30.3% below list).
- Recommended offer: $157k (30.3% below list) — sets the bar for 1% rule.
Location & tenants
- Location reads 63/100 on livability (#810 in OH) — a middle-class / working-renter tenant base. Strengths: crime A+, cost of living A+, housing A+; Watch: schools F, amenities F, commute F.
- Midview Local (suburban): math 55% / reading 59% proficiency, ranked #314 of 656 in OH (top 48%) — acceptable for families but not a draw, mixed tenant base, ~2y average lease.
- Market conditions: 93 active listings in the ZIP; solid renter incomes; 1,098 units permitted in Lorain County in 2024 (20 in 5+ unit buildings).
Forward outlook
- Local home prices are declining (-3.0%/yr); year-one equity from $2k of loan paydown is wiped out by about $7k of value loss. Plan a longer hold.
Negotiation context
- Only 10 days on market — expect competitive offers; lowballing is unlikely to land.
- 3 sale attempts since 22y ago with the ask held roughly flat each time — persistent listings suggest the price (not the market) is what's stuck; bring a comps-based counter.
- Current owner paid $122k; list at $225k implies a 85% gain — meaningful room to come down on a strong offer.
Risks & watch-outs
- Climate carrying-cost: moderate flood risk — expect insurance premiums to compound above CPI over the hold.
Questions for the listing agent
- What do current leases actually rent for vs. the listed asking? Can we see a recent rent roll and the last 12 months of T-12 income?
- Built in 1977 — when were the roof, HVAC, electrical panel, plumbing, and water heater last replaced?
- Is there a deadline driving the sale (1031 exchange, divorce, estate, relocation)? That informs how much negotiation room exists.
- Schools are F-rated, which usually means shorter tenancies and higher turnover. Who's the typical renter profile here, and what's been the actual vacancy rate?
- The area grade is low — what's the realistic commute time and amenity access for the typical tenant pool here? Any planned neighborhood developments (good or bad) we should know about?
- What's the average days-on-market for RENTAL listings here right now (not sales)? A rising rental-DOM trend means longer vacancies and softer asking-rent achievability than the comps imply.
- What's the recent tenant-quality profile in this submarket — average credit score on applications, eviction rate, late-payment / NSF rate, and stable-employment percentage? A property-management company in the area should have these aggregated.
- How much new for-sale + rental construction is in the pipeline within 1–3 miles? Heavy new supply typically softens prices + rents 12–24 months out; constrained supply supports both.
Investment metrics
- 1% rule
- 0.70% ✗
- Cap rate
- 5.11%
- Cash-on-cash
- -4.24%
- DSCR
- 0.81
- GRM
- 12.0
CMA / ARV
- ARV (median comp)
- $354,103
- List price
- $225,000
- Delta
- -36.46%
- Verdict
- UNDERPRICED
- Comps
- 12 within 1.0 mi
Show comp detail 2 sales within ~0.75 mi
| Address | Dist | Beds/Ba | Sqft | Sold | Price | $/sf | Match |
|---|---|---|---|---|---|---|---|
| 34718 Maurer Blvd | 0.62mi | 3/3.0 | 1,365 (+12%) | 1mo | $375,000 | $275 | 47 |
| 12045 Kara Ct Unit S/L 97 | 0.70mi | 3/3.0 | 1,365 (+12%) | 10mo | $335,300 | $246 | 36 |
Match score weights: distance 35% · size 25% · config 20% · recency 20%. Top-matched comps best support the ARV.
Projected returns pro-forma
-3.0% appreciation · 3.0% rent growth · sell at horizon
- IRR
- -23.5%
- Equity multiple
- 0.20×
- Total profit
- $-50,671
- Equity at exit
- $33,548
- IRR
- -18.3%
- Equity multiple
- 0.01×
- Total profit
- $-62,517
- Equity at exit
- $19,454
Cash invested: $63,000 (down + closing). Projections, not guarantees.
Landlord ↔ Tenant lean methodology
- Overall (STATE)
- 73 Landlord-Friendly
- State Ohio
- 73 Landlord-Friendly · R+6
- County
- — inherits STATE
- City
- — inherits STATE
ZIP-level market 44028
- Home prices YoY
- -29.7%
- Active inventory
- 93
- Price-to-rent
- 12.0×
Monthly cashflow live
- Estimated rent
- $1,567 medium interval (Pro) →
- Mortgage (P&I)
- −$1,180
- Tax from tax record
- −$187 /mo · $2,244/yr
- Insurance
- −$94
- HOA
- −$0
- Vacancy / Maint / Mgmt
- −$329
- Net cashflow
- $-223
Break-even live
UW: 25.0% down · 7.5% · 30yr · 1.5% tax · 5.0% vac · 8.0% maint · 8.0% mgmt
Financing live
Cash to close
- Down payment
- $56,250
- Closing costs
- $6,750
- Reserves months
- —
- Total cash needed
- —
Loan-product check · same deal, 3 products live
Conventional
25% down · 7.5% · 30yr
- Down + closing
- —
- Monthly P&I
- —
- Monthly cashflow
- —
- DSCR
- —
- Eligible?
- —
Personal DTI + credit; lowest rate.
DSCR
20% down · 8.5% · 30yr
- Down + closing
- —
- Monthly P&I
- —
- Monthly cashflow
- —
- DSCR
- —
- Eligible?
- —
No personal income docs; deal must DSCR.
Hard money
10% down · 12.0% · 12mo
- Down + closing
- —
- Monthly P&I
- —
- Monthly cashflow
- —
- DSCR
- —
- Eligible?
- —
Short-term bridge; refi at stabilization.
Listing history 8 events
-
2026-05-10$225,000 Active 566-char remark
-
2006-07-03soldstatus $121,900
-
2006-07-01soldstatus $121,900 236-char remark
Show marketing remark (236 chars)
Almost An Acre! Clean! Full Bath Of Master Br. Large Pretty Eat-in Kitchen. Big Bright Family Rm. Awsome Pool & Fenced Yard. Conveniantly Located. Attached Garage W/ Floored Attic. Big Shed. Plenty Of Storage. Immediate Occupancy.
-
2006-03-18$123,900 236-char remark
Show marketing remark (236 chars)
Almost An Acre! Clean! Full Bath Of Master Br. Large Pretty Eat-in Kitchen. Big Bright Family Rm. Awsome Pool & Fenced Yard. Conveniantly Located. Attached Garage W/ Floored Attic. Big Shed. Plenty Of Storage. Immediate Occupancy.
-
2005-04-18soldstatus $122,000
Show marketing remark (282 chars)
Private Full Bath Off Master Br * Large Pretty Eat In Kitchen * Big Bright Family Room * Awesome Pool * Fenced Yard * Whole House Fan * Conveniently Located * Attached Garage W/ Floored Attic * Big Shed * Plenty Of Storage Space! Almost An Acre! Move In Now! See Virtual Tour Above.
-
2004-11-28$129,900
Show marketing remark (282 chars)
Private Full Bath Off Master Br * Large Pretty Eat In Kitchen * Big Bright Family Room * Awesome Pool * Fenced Yard * Whole House Fan * Conveniently Located * Attached Garage W/ Floored Attic * Big Shed * Plenty Of Storage Space! Almost An Acre! Move In Now! See Virtual Tour Above.
-
1998-08-04soldstatus $98,000
ⓘ Source: listings_history table (triggers on properties + properties_extension) + one-shot
backfill from property_details.listing_events for pre-trigger history.
Tax reassessment forecast OH · Partial reset (capped growth)
- Current annual tax
- $2,244 · $187/mo
- Projected year-2 tax
- $2,877 · $240/mo
- Expected delta
- +$633/yr (+$53/mo · 28.2%)
ⓘ Screening estimate from a state-policy table — verify with the county assessor before closing.
Climate risk First Street
- Flood 5/10 Major FEMA zone X (unshaded) · 65% chance over 30 yrs
- Wildfire 1/10 Low
- Heat 3/10 Moderate 7 d/yr ≥98°F today · 16 d/yr by 30 yrs out
- Wind 1/10 Low
- Air quality 2/10 Low 1 unhealthy d/yr today · 2 by 30 yrs out
Nearby sold comps map
Loading sold comps map…
Walkable amenities ~0.75 mi
Loading nearby amenities…
Taxation est. · year 1
- Rental income
- $18,807
- − Mortgage interest
- −$12,603
- − Property taxes
- −$2,244
- − Insurance
- −$1,125
- − Repairs & maintenance
- −$1,505
- − Management
- −$1,505
- − Depreciation
- −$6,545
- Taxable loss
- −$6,721
- Est. tax savings @ 24.0%
- +$1,613
- After-tax cash flow
- $-1,058/yr
For passive investors: Depreciation is non-cash, so a rental often shows a tax loss while cash-flowing — sheltering income. Rental losses are passive: they offset passive income freely, and up to $25,000/yr can offset ordinary (W-2) income if you actively participate and your MAGI is under $100k (phasing out to $0 by $150k); unused losses carry forward. On sale, claimed depreciation is recaptured at up to 25%, and gains may owe capital-gains tax (a 1031 exchange can defer both). Figures are a year-1 estimate at your 24.0% rate — not tax advice; consult a CPA.
Schools (NCES district)
- District
- Midview Local
- NCES district ID
- 3904817
- Math proficiency
- 55% ▼ -17.00%
- Reading proficiency
- 59% ▼ -13.00%
- Median HH income
- $61,808
- Composite
- 49.71/100
- National rank
- #1966
- State rank
- #314 of 656 in OH
Livability — Eaton Estates
- Score
- 63/100
- State rank
- #810
- US rank
- #14970
Category grades
Schools grade is shown separately in the Schools card above.
Census & demographics
- County
- Lorain · 305,041 people
- Metro
- Cleveland, OH
- Population (ZIP)
- 9,313
- Household income
- $86,991
- Rent vs Own
Population outlook (Lorain County) Hauer SSP2
- Today (2025)
- 314,924 people
- By 2030
- 317,546 · +0.8%
- By 2040
- 317,962 · +1.0%
- By 2050
- 312,872 · -0.7%
- By 2075
- 301,806 · -4.2%
- By 2100
- 278,271 · -11.6%
Race, ethnicity, and origin ACS 2023
- Neighborhood character
- Predominantly White (93%)
- Race & ethnicity
- White 93% Two or more races 5% Hispanic / Latino 2%
- Common ancestry
- Romanian 8% Italian 1% Subsaharan African 1%
- Foreign-born
- 3%
- Languages at home
- 96% English-only · Arabic 1% Russian/Polish/Slavic 1% Spanish 1%
Political lean MEDSL · Lorain
- 2024 margin
- Lean R (+5.7) · D 46.7% · R 52.4%
- 2008→2024 swing
- -23.6pp toward R · 2008: 17.9pp · 2024: -5.7pp
- All cycles
- 2024: R+5.7 2020: R+2.5 2016: R+0.3 2012: D+14.4 2008: D+17.9
Not yet ingested
- Civics
- —
Market trends
- HPI YoY
- ▼ -94.16%
- Current HPI
- 223.2008
- Rent YoY
- —
- Metro
- —
- State GDP YoY
- ▲ 1.98%
- F500 in state
- 48
Industry mix (Fortune 500 HQ in OH)
| Industry | F500 HQs | Revenue |
|---|---|---|
| Insurance | 3 | $145B |
|
||
| Industrial Machinery | 3 | $49B |
|
||
| Financial Services | 3 | $24B |
|
||
| Consumer Goods | 2 | $93B |
|
||
| Aerospace / Defense | 2 | $47B |
|
||
| Utilities | 2 | $33B |
|
||
Price history
+129.6% since first listed9 events — show timeline
- 2026-05-21 Pending — MLSNOW
- 2026-05-10 Listed $225,000 MLSNOW
- 2006-07-03 Sold (Public Records) $121,900 Public Records
- 2006-07-01 Sold (MLS) $121,900 MLSNOW
- 2006-03-18 Listed $123,900 MLSNOW
- 2005-04-18 Sold (Public Records) $122,000 Public Records
- 2005-04-18 Sold (MLS) $122,000 MLSNOW
- 2004-11-28 Listed $129,900 MLSNOW
- 1998-08-04 Sold (Public Records) $98,000 Public Records
Property tax history
-0.9%/yrLatest (2025): $2,244 · +0.2% YoY. Source: county tax records.
Cash-flow waterfall
monthlySold comps — $/sqft
last 12 mo · ≤1 miLoading sold comps…