8614 Azalea Crossing Ct · Sienna, TX
Flood risk 1/10 · Minimal
- FEMA flood zone
- X
- Chance of flooding over 30 yrs
- 0.0%
- Est. flood insurance / yr
- $507 – $1,088
Fire risk 4/10 · Minor
- Est. fire insurance / yr
- $1,222 – $2,270
Heat risk 9/10 · Severe
- Hot days now (above 111°F)
- 7 days/yr
- Hot days in 30 yrs
- 24 days/yr
Wind risk 9/10 · Severe
- Chance of severe wind over 30 yrs
- 99.0%
Air-quality risk 2/10 · Minimal
- Unhealthy air days now
- 2 days/yr
- Unhealthy air days in 30 yrs
- 2 days/yr
Risk factors via First Street. Map © Google.
Why this score? — see what drove the B- grade
The composite is a weighted blend of 9 inputs, each scored 0–100. Each bar is that input's sub-score; the figure is the points it added to the 100-point composite (weight × sub-score).
- Cash flow +29.6/30.0
- 1% rule +10.0/10.0
- DSCR +10.0/10.0
- Schools +4.5/10.0
- Appreciation +4.2/10.0
- ARV discount +3.6/15.0
- Rent growth +2.5/5.0
- Livability +2.5/5.0
- Condition / age +2.5/5.0
$315,000
🖨 Deal sheet 📄 Offer letter ✓ Due diligence
Listing remarks MLS
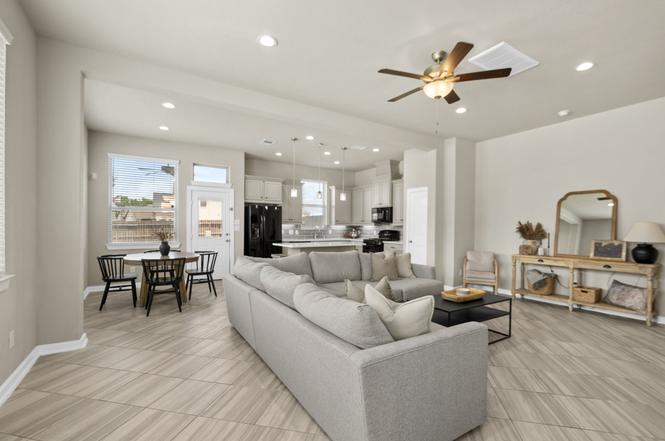
This is a beautiful townhome in the highly desirable Sienna Community. Sitting on a cow bayou with no neighbors behind. Three bedrooms with 2.5 baths. This home includes 42" taupe cabinets, level 3 quartz in kitchen and master bath, pendant lights in the kitchen, double sinks in master, tile downstairs, carpet up, sprinklers front and rear, fully landscaped front yard and grass in back, 2 " faux wood blinds on all operable windows, security system, covered patio overlooking the backyard. Window treatments and all appliances included! Photos are REPRESENTATIVE of the home /floor plan and are NOT of the actual home. Selections, features, and room options may vary. For more info, contact Chesmar Homes.
Key facts
- Former model home
- Premium corner lot
- Quartz countertops
Tags
Property features AI
Finance
- Other: Municipal Utility District disclosure and seller disclosure available
- Financial info: Lease not considered
- HOA & community: Sienna Community Association; Annual association fee; Association amenities include clubhouse, community pool, fitness center, sport courts (tennis, pickleball), playground, park, trails, golf course, horse trails, dog park, meeting/party room, picnic areas, and trash service
Exterior
- Parking: Attached garage
- Security: Owned security system; Smoke detectors
- Utilities: Public water; Public sewer
- Home design: Residential property; 2 stories; Faces northwest; Built in 2019
- Construction: Brick, cement siding, and stone exterior; Composition roof; Slab foundation; Built by Chesmar Homes
- Exterior features: Paved driveway; Private yard; Pond on lot; Association pool; Tennis court(s)
Interior
- Kitchen: Gas cooktop; Electric oven; Oven; Microwave; Dishwasher; Disposal; ENERGY STAR qualified appliances
- Bedrooms: 5 total rooms (includes bedrooms and living spaces)
- Flooring: Carpet; Tile
- Bathrooms: 2 full bathrooms; 1 half bathroom
- Heating & cooling: Central heating (gas); Central electric air conditioning
- Interior features: Quartz counters; Window treatments / coverings; Ceiling fans; Programmable thermostat; Ventilation for improved indoor air quality
- Laundry & utility: Washer and dryer included; Electric dryer hookup; Gas dryer hookup
Neighborhood map
What this means for you Summary
Snapshot
- This is a 3-bed/2.0-bath townhouse listed at $315k.
Deal economics
- At list price, monthly cash flow is $1k ($14k/yr) — positive.
- The deal already cash-flows at list — no discount required.
- Meets the 1% rule at list price ($5k rent vs $315k).
- Cap rate 10.6% vs local median 3.3% in Sienna — top-decile yield for the area; either an underpriced asset or a hidden risk that comps aren't pricing in. Stress-test before assuming the spread holds.
Location & tenants
- Location reads: area grade B — affects rentability + tenant quality, not the cash-flow math above.
- Fort Bend ISD (suburban): math 44% / reading 53% proficiency, ranked #140 of 826 in TX (top 17%) — families likely to look elsewhere, expect single-tenant / working-renter base with shorter leases.
- Zoned schools: Ronald Thornton Middle (math 40% / reading 52%, grade D+, #462 of 1,662 statewide, top 28%, 1,529 students, 41% FRL).
- Market conditions: Rents soft (-0.1%/yr); 1215 active listings in the ZIP; 3 comparable units currently listed for rent nearby; rentals at typical pace (median 22d on market — plan ~3-4 weeks tenant-placement turnaround); high-income renter base; 12,093 units permitted in Fort Bend County in 2024 (815 in 5+ unit buildings).
- This rent runs 45% of the median local income ($129k/yr) — at the standard rent-burdened threshold; future hikes will face affordability resistance.
Forward outlook
- Local home prices are declining (-1.7%/yr); year-one equity from $2k of loan paydown is wiped out by about $5k of value loss. Plan a longer hold.
- Fort Bend County population projected at +75% by 2050 — long-run rental-demand tailwind backs the buy-and-hold thesis.
- At projected returns (-1.7% appreciation + 0.0% rent growth), your $88k cash investment doubles in ~9 years — after that, you're playing with house money.
Negotiation context
- Only 5 days on market — expect competitive offers; lowballing is unlikely to land.
- 2 sale attempts since 4y ago with the ask held roughly flat each time — persistent listings suggest the price (not the market) is what's stuck; bring a comps-based counter.
Risks & watch-outs
- Watch-outs: property tax is 2.9% of price.
- Climate carrying-cost: severe wind risk, 99% chance of damaging wind over 30y; extreme-heat days projected 7→24/yr by 2055 (HVAC capex compounding) — expect insurance premiums to compound above CPI over the hold.
Questions for the listing agent
- Property tax is high relative to price — has the assessment been appealed recently, and will the sale trigger a re-assessment?
- What does the HOA fee cover, when was the last increase, and are there any pending special assessments or reserve-fund shortfalls?
- Is there a deadline driving the sale (1031 exchange, divorce, estate, relocation)? That informs how much negotiation room exists.
- What's the average days-on-market for RENTAL listings here right now (not sales)? A rising rental-DOM trend means longer vacancies and softer asking-rent achievability than the comps imply.
- What's the recent tenant-quality profile in this submarket — average credit score on applications, eviction rate, late-payment / NSF rate, and stable-employment percentage? A property-management company in the area should have these aggregated.
- How much new for-sale + rental construction is in the pipeline within 1–3 miles? Heavy new supply typically softens prices + rents 12–24 months out; constrained supply supports both.
Investment metrics
- 1% rule
- 1.54% ✓
- Cap rate
- 10.60%
- Cash-on-cash
- 15.40%
- DSCR
- 1.69
- GRM
- 5.4
CMA / ARV
- ARV (on-the-fly)
- $290,136
- Comps found
- 12
Show comp detail 12 sales within ~0.75 mi
| Address | Dist | Beds/Ba | Sqft | Sold | Price | $/sf | Match |
|---|---|---|---|---|---|---|---|
| 8758 Laurel Crest Dr | 0.54mi | 3/2.5 | 1,900 (+1%) | 2mo | $275,000 | $145 | 70 |
| 2527 Bordelon Ln | 0.60mi | 3/2.5 | 1,820 (-3%) | 0mo | $267,500 | $147 | 64 |
| 1571 Rustling Creek Dr | 0.57mi | 3/2.5 | 1,941 (+3%) | 2mo | $299,500 | $154 | 64 |
| 2531 Terrace Point Dr | 0.59mi | 3/2.5 | 1,903 (+1%) | 6mo | $275,000 | $145 | 64 |
| 2546 Bordelon Ln | 0.65mi | 3/2.5 | 1,870 (-1%) | 4mo | $255,000 | $136 | 64 |
| 2522 Terrace Point Dr | 0.57mi | 3/2.5 | 1,953 (+4%) | 3mo | $280,000 | $143 | 63 |
| 2546 Manor Valley Ct | 0.63mi | 3/2.5 | 1,958 (+4%) | 5mo | $344,900 | $176 | 58 |
| 1554 Rustling Creek Dr | 0.60mi | 3/2.5 | 1,858 (-1%) | 14mo | $309,000 | $166 | 56 |
| 1519 Cathedral Bend Dr | 0.68mi | 3/2.5 | 1,908 (+1%) | 18mo | $299,999 | $157 | 49 |
| 2506 Bordelon Ln | 0.57mi | 3/3.0 | 2,073 (+10%) | 12mo | $299,900 | $145 | 42 |
| 2523 Terrace Point Dr | 0.58mi | 3/2.5 | 1,737 (-8%) | 19mo | $279,900 | $161 | 42 |
| 1543 Cathedral Bend Dr | 0.70mi | 3/2.0 | 1,638 (-13%) | 10mo | $299,950 | $183 | 37 |
Match score weights: distance 35% · size 25% · config 20% · recency 20%. Top-matched comps best support the ARV.
Projected returns pro-forma
-1.67% appreciation · 0.0% rent growth · sell at horizon
- IRR
- 6.9%
- Equity multiple
- 1.29×
- Total profit
- $25,214
- Equity at exit
- $66,065
- IRR
- 11.1%
- Equity multiple
- 1.88×
- Total profit
- $77,874
- Equity at exit
- $61,192
Cash invested: $88,200 (down + closing). Projections, not guarantees.
Landlord ↔ Tenant lean methodology
- Overall (STATE)
- 87 Strongly Landlord-Friendly
- State Texas
- 87 Strongly Landlord-Friendly · R+5
- County
- — inherits STATE
- City
- — inherits STATE
ZIP-level market 77459
- Home prices YoY
- -0.8%
- Rents YoY
- -0.1%
- Active inventory
- 1215
- Price-to-rent
- 5.4×
Monthly cashflow live
- Estimated rent
- $4,836 medium interval (Pro) →
- Mortgage (P&I)
- −$1,652
- Tax from tax record
- −$774 /mo · $9,283/yr
- Insurance
- −$131
- HOA
- −$132
- Vacancy / Maint / Mgmt
- −$1,016
- Net cashflow
- $1,132
Break-even live
UW: 25.0% down · 7.5% · 30yr · 1.5% tax · 5.0% vac · 8.0% maint · 8.0% mgmt
Financing live
Cash to close
- Down payment
- $78,750
- Closing costs
- $9,450
- Reserves months
- —
- Total cash needed
- —
Loan-product check · same deal, 3 products live
Conventional
25% down · 7.5% · 30yr
- Down + closing
- —
- Monthly P&I
- —
- Monthly cashflow
- —
- DSCR
- —
- Eligible?
- —
Personal DTI + credit; lowest rate.
DSCR
20% down · 8.5% · 30yr
- Down + closing
- —
- Monthly P&I
- —
- Monthly cashflow
- —
- DSCR
- —
- Eligible?
- —
No personal income docs; deal must DSCR.
Hard money
10% down · 12.0% · 12mo
- Down + closing
- —
- Monthly P&I
- —
- Monthly cashflow
- —
- DSCR
- —
- Eligible?
- —
Short-term bridge; refi at stabilization.
Rent comps 3 comps
| Address | Beds | Baths | Sqft | Rent | $/sqft | DOM | Units | Dist |
|---|---|---|---|---|---|---|---|---|
| 8719 Fox Trail Dr Missouri City, TX | 4.0 | 3.5 | 2143 | $6,000 | $2.80 | 22d | 1 | 0.06mi |
| 2142 Ironwood Pass Dr Missouri City, TX | 4.0 | 3.0 | 2140 | $6,000 | $2.80 | 1d | 1 | 0.20mi |
| 1714 Forest Mist Dr Missouri City, TX | 3.0 | 3.0 | 1979 | $3,000 | $1.52 | 44d | 1 | 0.94mi |
HOA detail
- Monthly dues
- $132 · $1,584/yr
- Likely covers
- security
Listing history 5 events
-
2026-06-18days on market $315,000 Active 5 DOM
-
2026-06-17days on market $315,000 Active 4 DOM
-
2026-06-16days on market $315,000 Active 3 DOM
-
2026-06-15remarks 694-char remark
-
2026-06-15$315,000 Active 2 DOM
ⓘ Source: listings_history table (triggers on properties + properties_extension) + one-shot
backfill from property_details.listing_events for pre-trigger history.
Tax reassessment forecast TX · Resets to sale price
- Current annual tax
- $9,283 · $774/mo
- Projected year-2 tax
- $9,283 · $774/mo
- Expected delta
- $0/yr ($0/mo · 0.0%)
ⓘ Screening estimate from a state-policy table — verify with the county assessor before closing.
Climate risk First Street
- Flood 1/10 Low FEMA zone X · 0% chance over 30 yrs
- Wildfire 4/10 Moderate
- Heat 9/10 Extreme 7 d/yr ≥111°F today · 24 d/yr by 30 yrs out
- Wind 9/10 Extreme 99% chance of damaging wind over 30 yrs
- Air quality 2/10 Low 2 unhealthy d/yr today · 2 by 30 yrs out
Nearby sold comps map
Loading sold comps map…
Walkable amenities ~0.75 mi
Loading nearby amenities…
Taxation est. · year 1
- Rental income
- $58,035
- − Mortgage interest
- −$17,645
- − Property taxes
- −$9,283
- − Insurance
- −$1,575
- − Repairs & maintenance
- −$4,643
- − Management
- −$4,643
- − HOA
- −$1,584
- − Depreciation
- −$9,164
- Taxable income
- $9,499
- Est. tax owed @ 24.0%
- −$2,280
- After-tax cash flow
- $11,303/yr
For passive investors: Depreciation is non-cash, so a rental often shows a tax loss while cash-flowing — sheltering income. Rental losses are passive: they offset passive income freely, and up to $25,000/yr can offset ordinary (W-2) income if you actively participate and your MAGI is under $100k (phasing out to $0 by $150k); unused losses carry forward. On sale, claimed depreciation is recaptured at up to 25%, and gains may owe capital-gains tax (a 1031 exchange can defer both). Figures are a year-1 estimate at your 24.0% rate — not tax advice; consult a CPA.
Schools (NCES district)
- District
- Fort Bend ISD
- NCES district ID
- 4819650
- Math proficiency
- 44% ▼ -15.00%
- Reading proficiency
- 53% ▼ -4.00%
- Median HH income
- $82,360
- Composite
- 44.61/100
- National rank
- #2779
- State rank
- #140 of 826 in TX
Livability — Sienna
No livability data for this city. (Only ~50 U.S. cities are tracked.)
Census & demographics
- Census place
- Sienna, TX
- County
- Fort Bend County · 836,777 people
- Metro
- Houston-The Woodlands-Sugar Land, TX
- Population (ZIP)
- 84,221
- Household income
- $129,151
- Rent vs Own
- Severe rent burden
- 1004.0
Population outlook (Fort Bend County) Hauer SSP2
- Today (2025)
- 1,004,526 people
- By 2030
- 1,153,104 · +14.8%
- By 2040
- 1,453,718 · +44.7%
- By 2050
- 1,753,781 · +74.6%
- By 2075
- 2,455,772 · +144.5%
- By 2100
- 2,930,528 · +191.7%
Race, ethnicity, and origin ACS 2023
- Neighborhood character
- Highly diverse neighborhood (Simpson 0.75)
- Race & ethnicity
- White 34% Black 26% Asian 22% Hispanic / Latino 13% Two or more races 10%
- Hispanic origin (detail)
- Mexican 7%
- Common ancestry
- Lithuanian 2% Slovak 1% Italian 1%
- Foreign-born
- 21% · Canada, China, Vietnam
- Languages at home
- 73% English-only · Other Asian/Pacific 8% Spanish 7% Other Indo-European 5%
Political lean MEDSL · Fort Bend
- 2024 margin
- Toss-up / Even · D 49.5% · R 47.9% · Other 2.6%
- 2008→2024 swing
- +4.0pp toward D · 2008: -2.4pp · 2024: 1.6pp
- All cycles
- 2024: D+1.6 2020: D+10.6 2016: D+6.6 2012: R+6.8 2008: R+2.4
Not yet ingested
- Civics
- —
Market trends
- HPI YoY
- ▼ -1.67%
- Current HPI
- 212.3573
- Rent YoY
- ▼ -0.15%
- Metro
- Houston-The Woodlands-Sugar Land, TX
- State GDP YoY
- ▲ 3.95%
- F500 in state
- 110
Industry mix (Fortune 500 HQ in TX)
| Industry | F500 HQs | Revenue |
|---|---|---|
| Energy | 16 | $1,198B |
|
||
| Technology | 5 | $198B |
|
||
| Engineering / Construction | 4 | $72B |
|
||
| Energy Services | 3 | $60B |
|
||
| Utilities | 3 | $41B |
|
||
| Healthcare | 2 | $330B |
|
||
Price history
-11.3% since first listed7 events — show timeline
- 2026-06-13 Listed $315,000 HARMLS
- 2023-10-26 Sold (Public Records) — Public Records
- 2023-02-14 Sold (MLS) — HARMLS
- 2023-02-08 Sold (Public Records) — Public Records
- 2023-01-17 Pending — HARMLS
- 2022-12-19 Price Changed $325,000 HARMLS
- 2022-11-16 Listed $355,000 HARMLS
Property tax history
+47.0%/yrLatest (2025): $9,283 · +4.9% YoY. Source: county tax records.
Cash-flow waterfall
monthlySold comps — $/sqft
last 12 mo · ≤1 miLoading sold comps…