508 Round Rock Way · Fountain Inn, SC
Flood risk 1/10 · Minimal
- FEMA flood zone
- X (unshaded)
- Chance of flooding over 30 yrs
- 0.0%
- Est. flood insurance / yr
- $507 – $1,088
Fire risk 4/10 · Minor
- Est. fire insurance / yr
- $783 – $1,453
Heat risk 5/10 · Moderate
- Hot days now (above 104°F)
- 7 days/yr
- Hot days in 30 yrs
- 16 days/yr
Wind risk 2/10 · Minimal
- Chance of severe wind over 30 yrs
- 3.0%
Air-quality risk 3/10 · Minor
- Unhealthy air days now
- 3 days/yr
- Unhealthy air days in 30 yrs
- 3 days/yr
Risk factors via First Street. Map © Google.
Why this score? — see what drove the D grade
The composite is a weighted blend of 9 inputs, each scored 0–100. Each bar is that input's sub-score; the figure is the points it added to the 100-point composite (weight × sub-score).
- Cash flow +10.4/30.0
- ARV discount +7.5/15.0
- Schools +4.2/10.0
- Livability +4.1/5.0
- Condition / age +4.0/5.0
- 1% rule +3.7/10.0
- Rent growth +3.6/5.0
- DSCR +3.0/10.0
- Appreciation +0.0/10.0
$253,990
🖨 Deal sheet (PDF) 📄 Offer letter ✓ Due diligence
Listing remarks
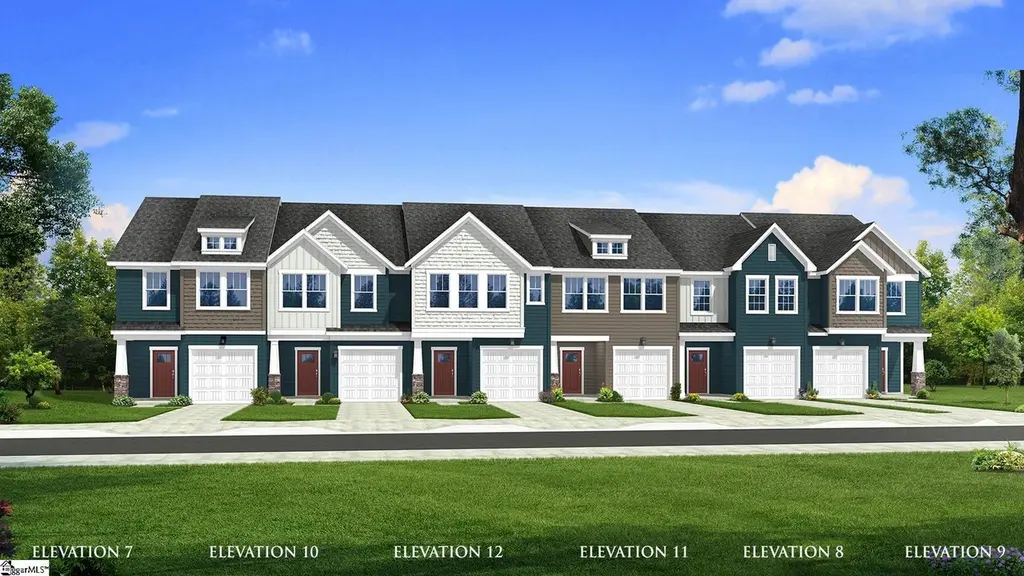
Welcome to Barton Hollow! The only new homes within 5 minutes of I-385 and Downtown Fountain Inn, SC with James Hardie siding and community amenities. Step inside this beautifully designed home featuring an open-concept layout perfect for everyday living and entertaining. The heart of the home is the stunning kitchen with a 9-foot center island, seamlessly flowing into the bright family room and cozy breakfast area—ideal for gatherings or quiet mornings. Other features of the kitchen include light brown cabinetry, Quartz countertops, tiled backsplash and a full stainless steel appliance package including a gas range/oven and refrigerator. Up the Oak staircase you’ll find three g
Key facts
- Quartz countertops
- 9-foot center island
- Tiled backsplash
Tags
Property features AI
Finance
- HOA & community: Homeowners association membership; HOA covers lawn maintenance and street lights; Community amenities include common areas, lighting, playground, lawn maintenance and dog park
Exterior
- Parking: Attached 1-car garage with door opener; Paved driveway with extra pad
- Utilities: Public water; Electric water heater; Public sewer; Public garbage pickup; Attached garage (power available)
- Home design: Two-story home; Lichfield model; Under construction (approx. 2026 completion); DRB Homes builder
- Construction: Hardboard siding exterior; Architectural roof; Slab foundation; Approximate year built 2026
- Exterior features: Front porch; Patio; Tilt-out windows; Level lot
Interior
- Kitchen: Pantry closet; Built-in microwave; Self-cleaning oven; Gas oven/range; Dishwasher; Garbage disposal; Refrigerator
- Bedrooms: Primary bedroom on 2nd level with shower-only bath, double sink and walk-in closet; Second bedroom (14 x 10); Third bedroom (14 x 10)
- Flooring: Carpet; Luxury vinyl tile/plank
- Bathrooms: Two full bathrooms; One half bathroom
- Heating & cooling: Natural gas heating; Electric cooling
- Interior features: Attic with disappearing stairs; Cable available; 9+ ft smooth ceilings; Open floor plan; Smoke detectors; Walk-in closets; Split floor plan; Quartz countertops; Pantry closet; Smart systems pre-wiring
- Laundry & utility: Second-floor closet-style laundry with electric dryer hookup; Washer and dryer included
Neighborhood map
What this means for you Summary
Snapshot
- This is a 3-bed/2.5-bath townhouse listed at $254k. Condition is rated good.
Deal economics
- At list price, monthly cash flow is $-133 ($-2k/yr) — negative.
- To cash-flow at today's rent, offer at most $235k (7.6% below list).
- To meet the 1% rule (rent ≥ 1% of price), the offer needs to be $221k (12.9% below list).
- Recommended offer: $221k (12.9% below list) — sets the bar for 1% rule.
- Cap rate 5.7% vs local median 4.2% in Fountain Inn — top-decile yield for the area; either an underpriced asset or a hidden risk that comps aren't pricing in. Stress-test before assuming the spread holds.
Location & tenants
- Location reads 82/100 on livability (#4 in SC, #1,162 nationally) — a professional / high-income tenant draw. Strengths: crime A+, cost of living A+, housing A+; Watch: commute F.
- Greenville 01 (suburban): math 44% / reading 54% proficiency, ranked #10 of 80 in SC (top 12%) — families likely to look elsewhere, expect single-tenant / working-renter base with shorter leases.
- Zoned schools: Bryson Elementary (math 52% / reading 52%, grade C-, #145 of 597 statewide, top 26%, 911 students, 70% FRL) — zoned schools average 70% FRL vs 42% district-wide (28 pts higher); higher-poverty schools than district average — tighter screening recommended.
- Market conditions: Rents rising fast (+4.5%/yr); 482 active listings in the ZIP; 7 comparable units currently listed for rent nearby; rentals leasing fast (median 4d on market — plan ~1-2 weeks tenant-placement turnaround); 5,595 units permitted in Greenville County in 2024 (566 in 5+ unit buildings).
- This rent runs 38% of the median local income ($70k/yr) — at the standard rent-burdened threshold; future hikes will face affordability resistance.
Forward outlook
- Local home prices are declining (-3.0%/yr); year-one equity from $2k of loan paydown is wiped out by about $8k of value loss. Plan a longer hold.
- Greenville County population projected at +34% by 2050 — long-run rental-demand tailwind backs the buy-and-hold thesis.
Negotiation context
- It's been on market 42 days — a 3% lower offer ($246k) is reasonable based on typical stale-listing flexibility.
Risks & watch-outs
- Climate carrying-cost: extreme-heat days projected 7→16/yr by 2055 (HVAC capex compounding) — expect insurance premiums to compound above CPI over the hold.
Questions for the listing agent
- What do current leases actually rent for vs. the listed asking? Can we see a recent rent roll and the last 12 months of T-12 income?
- It's been on market 42 days. Have you received any prior offers? Is the seller open to a 13% concession, seller financing, or rate buy-down credit?
- What does the HOA fee cover, when was the last increase, and are there any pending special assessments or reserve-fund shortfalls?
- Is there a deadline driving the sale (1031 exchange, divorce, estate, relocation)? That informs how much negotiation room exists.
- The area grade is low — what's the realistic commute time and amenity access for the typical tenant pool here? Any planned neighborhood developments (good or bad) we should know about?
- What's the average days-on-market for RENTAL listings here right now (not sales)? A rising rental-DOM trend means longer vacancies and softer asking-rent achievability than the comps imply.
- What's the recent tenant-quality profile in this submarket — average credit score on applications, eviction rate, late-payment / NSF rate, and stable-employment percentage? A property-management company in the area should have these aggregated.
- How much new for-sale + rental construction is in the pipeline within 1–3 miles? Heavy new supply typically softens prices + rents 12–24 months out; constrained supply supports both.
Investment metrics
- 1% rule
- 0.87% ✗
- Cap rate
- 5.66%
- Cash-on-cash
- -2.25%
- DSCR
- 0.90
- GRM
- 9.6
CMA / ARV
No comps found within radius.
Projected returns pro-forma
-3.0% appreciation · 4.55% rent growth · sell at horizon
- IRR
- -18.1%
- Equity multiple
- 0.35×
- Total profit
- $-46,027
- Equity at exit
- $37,871
- IRR
- -7.4%
- Equity multiple
- 0.50×
- Total profit
- $-35,720
- Equity at exit
- $21,960
Cash invested: $71,117 (down + closing). Projections, not guarantees.
Landlord ↔ Tenant lean methodology
- Overall (STATE)
- 90 Strongly Landlord-Friendly
- State South Carolina
- 90 Strongly Landlord-Friendly · R+6
- County
- — inherits STATE
- City
- — inherits STATE
ZIP-level market 29644
- Home prices YoY
- -28.6%
- Rents YoY
- 4.5%
- Active inventory
- 482
- Price-to-rent
- 9.6×
Monthly cashflow live
- Estimated rent
- $2,212 high interval (Pro) →
- Mortgage (P&I)
- −$1,332
- Tax est. 1.5%
- −$317 /mo · $3,810/yr
- Insurance
- −$106
- HOA
- −$125
- Vacancy / Maint / Mgmt
- −$464
- Net cashflow
- $-133
Break-even live
Sensitivity live
| Price | -10% $42 | -5% $-45 | +0% $-133 | +5% $-221 | +10% $-309 |
|---|---|---|---|---|---|
| Rent | -10% $-308 | -5% $-221 | +0% $-133 | +5% $-46 | +10% $42 |
| Rate | -1.0pp $-5 | -0.5pp $-69 | base $-133 | +0.5pp $-199 | +1.0pp $-266 |
UW: 25.0% down · 7.5% · 30yr · 1.5% tax · 5.0% vac · 8.0% maint · 8.0% mgmt
Financing live
Cash to close
- Down payment
- $63,498
- Closing costs
- $7,620
- Reserves months
- —
- Total cash needed
- —
Loan-product check · same deal, 3 products live
Conventional
25% down · 7.5% · 30yr
- Down + closing
- —
- Monthly P&I
- —
- Monthly cashflow
- —
- DSCR
- —
- Eligible?
- —
Personal DTI + credit; lowest rate.
DSCR
20% down · 8.5% · 30yr
- Down + closing
- —
- Monthly P&I
- —
- Monthly cashflow
- —
- DSCR
- —
- Eligible?
- —
No personal income docs; deal must DSCR.
Hard money
10% down · 12.0% · 12mo
- Down + closing
- —
- Monthly P&I
- —
- Monthly cashflow
- —
- DSCR
- —
- Eligible?
- —
Short-term bridge; refi at stabilization.
Rent comps 7 comps
| Address | Beds | Baths | Sqft | Rent | $/sqft | DOM | Units | Dist |
|---|---|---|---|---|---|---|---|---|
| 101 Fennec Dr Fountain Inn, SC | 3.0 | 3.0 | 1735 | $2,099 | $1.21 | 4d | 1 | 0.63mi |
| 119 Cranford Rd Fountain Inn, SC | 4.0 | 3.0 | 2174 | $2,495 | $1.15 | 20d | 1 | 0.74mi |
| 217 N Nelson Dr Fountain Inn, SC | 3.0–4.0 | 2.5–3.5 | 2115 | $2,100 | $0.99 | 3d | 12 | 0.91mi |
| 4 Rockshire Trl Fountain Inn, SC | 3.0 | 2.5 | 1400 | $1,900 | $1.36 | 24d | 1 | 0.98mi |
| 7 Gramercy Woods Ln Fountain Inn, SC | 3.0–5.0 | 2.5–3.0 | 1967 | $2,224 | $1.13 | 3d | 13 | 1.20mi |
| 40 Fernhill Ln Fountain Inn, SC | 3.0 | 3.0 | 1983 | $1,900 | $0.96 | 4d | 1 | 1.40mi |
| 116 Aspen Valley Trl Fountain Inn, SC | 3.0 | 2.5 | 1422 | $1,681 | $1.18 | 4d | 13 | 1.50mi |
HOA detail
- Monthly dues
- $125 · $1,500/yr
- Likely covers
- gas
Listing history 15 events
-
2026-06-18days on market $253,990 Active 42 DOM
-
2026-06-17days on market $253,990 Active 41 DOM
-
2026-06-16days on market $253,990 Active 40 DOM
-
2026-06-15days on market $253,990 Active 39 DOM
-
2026-06-13days on market $253,990 Active 37 DOM
-
2026-06-13days on market $253,990 Active 36 DOM
-
2026-06-10days on market $253,990 Active 34 DOM
-
2026-06-09days on market $253,990 Active 33 DOM
-
2026-06-08days on market $253,990 Active 32 DOM
-
2026-06-07days on market $253,990 Active 31 DOM
-
2026-06-03days on market $253,990 Active 27 DOM
-
2026-06-03days on market $253,990 Active 26 DOM
-
2026-06-01days on market $253,990 Active 25 DOM
-
2026-05-31days on market $253,990 Active 24 DOM
-
2026-05-07$253,990 Active
ⓘ Source: listings_history table (triggers on properties + properties_extension) + one-shot
backfill from property_details.listing_events for pre-trigger history.
Climate risk First Street
- Flood 1/10 Low FEMA zone X (unshaded) · 0% chance over 30 yrs
- Wildfire 4/10 Moderate
- Heat 5/10 Major 7 d/yr ≥104°F today · 16 d/yr by 30 yrs out
- Wind 2/10 Low 3% chance of damaging wind over 30 yrs
- Air quality 3/10 Moderate 3 unhealthy d/yr today · 3 by 30 yrs out
Nearby sold comps map
Loading sold comps map…
Walkable amenities ~0.75 mi
Loading nearby amenities…
Taxation est. · year 1
- Rental income
- $26,538
- − Mortgage interest
- −$14,227
- − Property taxes
- −$3,810
- − Insurance
- −$1,270
- − Repairs & maintenance
- −$2,123
- − Management
- −$2,123
- − HOA
- −$1,500
- − Depreciation
- −$7,389
- Taxable loss
- −$5,904
- Est. tax savings @ 24.0%
- +$1,417
- After-tax cash flow
- $-181/yr
For passive investors: Depreciation is non-cash, so a rental often shows a tax loss while cash-flowing — sheltering income. Rental losses are passive: they offset passive income freely, and up to $25,000/yr can offset ordinary (W-2) income if you actively participate and your MAGI is under $100k (phasing out to $0 by $150k); unused losses carry forward. On sale, claimed depreciation is recaptured at up to 25%, and gains may owe capital-gains tax (a 1031 exchange can defer both). Figures are a year-1 estimate at your 24.0% rate — not tax advice; consult a CPA.
Condition & rehab AI · 6 photos
This townhouse is move-in ready with a good condition score and a smart home package, making it an attractive option for both resale and rental.
Value-add opportunities
- Both Smart home package — Enhances home automation and security
- Both Smart thermostat — Improves energy efficiency and comfort
- Both Smart lighting — Enhances energy efficiency and ambiance
Renovation cost estimate screening
Value-add ROI direction
- Both Smart home package — Enhances home automation and security ↑
- Both Smart thermostat — Improves energy efficiency and comfort ↑
- Both Smart lighting — Enhances energy efficiency and ambiance ↑
ⓘ Cost ranges are severity-bucket heuristics (US national rule-of-thumb). Get contractor quotes + a written scope before underwriting a rehab budget.
Schools (NCES district)
- District
- Greenville 01
- NCES district ID
- 4502310
- Math proficiency
- 44% ▼ -10.00%
- Reading proficiency
- 54% ▼ -2.00%
- Median HH income
- $49,596
- Composite
- 41.88/100
- National rank
- #3370
- State rank
- #10 of 80 in SC
Livability — Fountain Inn
- Score
- 82/100
- State rank
- #4
- US rank
- #1162
Category grades
Schools grade is shown separately in the Schools card above.
Census & demographics
- Census place
- Fountain Inn, SC
- County
- Greenville County · 573,815 people
- City population
- 22,907
- Metro
- Greenville-Anderson, SC
- Population (ZIP)
- 22,907
- Household income
- $70,301
- Rent vs Own
- Severe rent burden
- 475.0
Population outlook (Greenville County) Hauer SSP2
- Today (2025)
- 574,580 people
- By 2030
- 615,615 · +7.1%
- By 2040
- 695,373 · +21.0%
- By 2050
- 769,367 · +33.9%
- By 2075
- 933,296 · +62.4%
- By 2100
- 1,029,196 · +79.1%
Race, ethnicity, and origin ACS 2023
- Neighborhood character
- Predominantly White (66%)
- Race & ethnicity
- White 66% Black 18% Two or more races 10% Hispanic / Latino 10%
- Hispanic origin (detail)
- Mexican 3% Puerto Rican 2%
- Common ancestry
- Slovak 3% Romanian 2% Lithuanian 2%
- Foreign-born
- 6% · Canada, Jamaica
- Languages at home
- 89% English-only · Spanish 9% Tagalog/Filipino 1%
Political lean MEDSL · Greenville
- 2024 margin
- Strong R (+22.2) · D 38.0% · R 60.2% · Other 1.8%
- 2008→2024 swing
- +1.7pp toward D · 2008: -23.9pp · 2024: -22.2pp
- All cycles
- 2024: R+22.2 2020: R+18.2 2016: R+24.7 2012: R+27.8 2008: R+23.9
Not yet ingested
- Civics
- —
Market trends
- HPI YoY
- ▼ -100.45%
- Current HPI
- 250.5271
- Rent YoY
- ▲ 4.55%
- Metro
- Greenville-Anderson, SC
- State GDP YoY
- ▲ 4.51%
- F500 in state
- 2
Industry mix (Fortune 500 HQ in SC)
| Industry | F500 HQs | Revenue |
|---|---|---|
| Packaging | 1 | $7B |
|
||
Price history
1 event — show timeline
- 2026-05-07 Listed $253,990 Greater Greenville MLS
Cash-flow waterfall
monthlySold comps — $/sqft
last 12 mo · ≤1 miLoading sold comps…