 Triplex
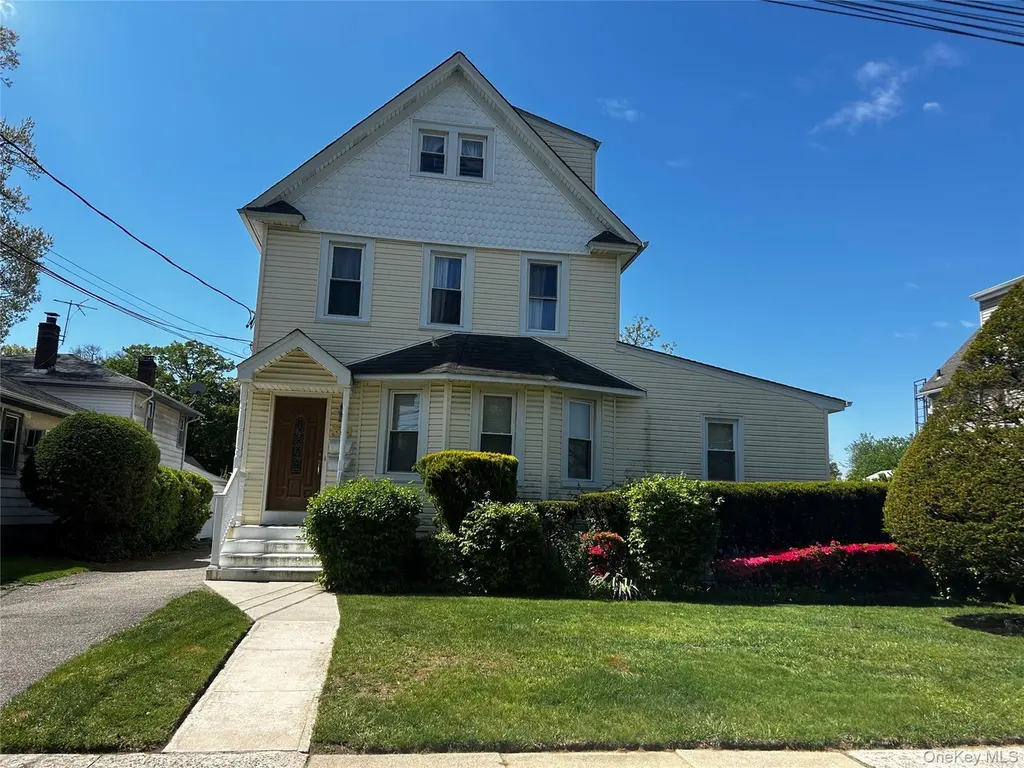
38 Wood St · Lynbrook, NY
Flood risk 4/10 · Minor
- FEMA flood zone
- X (unshaded)
- Chance of flooding over 30 yrs
- 0.22%
- Est. flood insurance / yr
- $473 – $860
Fire risk 1/10 · Minimal
- Est. fire insurance / yr
- $691 – $1,283
Heat risk 6/10 · Moderate
- Hot days now (above 97°F)
- 7 days/yr
- Hot days in 30 yrs
- 16 days/yr
Wind risk 6/10 · Moderate
- Chance of severe wind over 30 yrs
- 70.0%
Air-quality risk 3/10 · Minor
- Unhealthy air days now
- 4 days/yr
- Unhealthy air days in 30 yrs
- 4 days/yr
Risk factors via First Street. Map © Google.
Why this score? — see what drove the B grade
The composite is a weighted blend of 9 inputs, each scored 0–100. Each bar is that input's sub-score; the figure is the points it added to the 100-point composite (weight × sub-score).
- Cash flow +30.0/30.0
- DSCR +10.0/10.0
- 1% rule +8.7/10.0
- ARV discount +7.5/15.0
- Schools +6.7/10.0
- Livability +4.4/5.0
- Rent growth +2.5/5.0
- Condition / age +2.5/5.0
- Appreciation +0.0/10.0
$828,000
🖨 Deal sheet 📄 Offer letter ✓ Due diligence
Multi-family units
County records classify this as Multi-Family (2-4 Unit). Listing-text estimate: 3 units. confirmed
Listing remarks
Investment opportunity with a rare legal three-family home in the heart of Lynbrook! The first floor apartment features two bedrooms, living room, eat in kitchen, full bath. The second floor apartment features two bedrooms, living room eat in kitchen, full bath. The third floor apartment features one bedroom, living room eat in kitchen, full bath. This spacious home has a full unfinished basement, high ceilings, with a dedicated laundry area, offering endless potential. Ideally located close to Long Island Rail Road, restaurants, community pool, and local amenities, this home combines convenience with strong income- producing potential. Perfect for an owner occupant or investor, this prope
Key facts
- 8,850 sq ft lot
- Garage
- Built 1915
Property features AI
Exterior
- Parking: Driveway; Oversized garage; 1 garage space
- Utilities: Public sewer; Cable available; Electricity available; Water available
- Home design: Triplex; Total building area approximately 2648
- Construction: Vinyl siding construction
- Exterior features: Vinyl siding; Not waterfront; No additional parcels
Interior
- Bedrooms: One 4-bedroom unit
- Bathrooms: Three full bathrooms
- Heating & cooling: Oil heating; No central cooling
- Interior features: Other interior features; Unfinished basement
Neighborhood map
What this means for you Summary
Snapshot
- This is a 3 × 5-bed/3.0-bath units multifamily listed at $828k.
Deal economics
- At list price, monthly cash flow is $3k ($39k/yr) — positive. Per door: $1k/mo.
- The deal already cash-flows at list — no discount required.
- Meets the 1% rule at list price ($11k rent vs $828k).
- Recommended offer: $816k (1.5% below list) — sets the bar for market timing.
- Cap rate 11.1% vs local median 3.2% in Lynbrook — top-decile yield for the area; either an underpriced asset or a hidden risk that comps aren't pricing in. Stress-test before assuming the spread holds.
Location & tenants
- Location reads 88/100 on livability (#10 in NY, #221 nationally) — a professional / high-income tenant draw. Strengths: crime A+, amenities A+, commute A+; Watch: cost of living F.
- Lynbrook Union Free School District (suburban): math 75% / reading 73% proficiency, ranked #72 of 590 in NY (top 12%) — strong family-tenant draw, lease renewals of 3-5y typical; only 8% free/reduced lunch — higher-income household profile.
- Zoned schools: West End School (math 82% / reading 82%, grade A+, #138 of 2,108 statewide, top 8%, 401 students, 0% FRL); Lynbrook North Middle School (math 42% / reading 67%, grade B-, #214 of 729 statewide, top 31%, 266 students, 15% FRL); Lynbrook Senior High School (math 97% / reading 82%, grade A+, #265 of 1,100 statewide, top 26%, 850 students, 19% FRL) — zoned schools at 11% FRL track the district average.
- Market conditions: 133 active listings in the ZIP; high-income renter base; 824 units permitted in Nassau County in 2024 (153 in 5+ unit buildings).
- At $11,361/mo this rent would consume 100% of the median local household income ($137k/yr) (locally 618% of renters already pay >50% of income on rent) — very limited rent-growth headroom before tenants either downsize or default.
Forward outlook
- Local home prices are declining (-3.0%/yr); year-one equity from $6k of loan paydown is wiped out by about $25k of value loss. Plan a longer hold.
- Nassau County population projected at +7% by 2050 — modest demand growth; plan on rents tracking national, not racing it.
- At projected returns (-3.0% appreciation + 3.0% rent growth), your $232k cash investment doubles in ~8 years — after that, you're playing with house money.
Negotiation context
- It's been on market 24 days — a 2% lower offer ($816k) is reasonable based on typical stale-listing flexibility.
Risks & watch-outs
- Watch-outs: built in 1915 — expect roof / HVAC / electrical / plumbing capex.
- Climate carrying-cost: major wind risk, 70% chance of damaging wind over 30y; extreme-heat days projected 7→16/yr by 2055 (HVAC capex compounding) — expect insurance premiums to compound above CPI over the hold.
Questions for the listing agent
- Can we see the unit-by-unit rent roll, current vacancy, and any below-market leases? What's the average tenancy length?
- What capital expenditures (roof, boiler, parking lot, exteriors) have been made in the last 5 years, and what's planned in the next 2?
- Built in 1915 — when were the roof, HVAC, electrical panel, plumbing, and water heater last replaced?
- Is there a deadline driving the sale (1031 exchange, divorce, estate, relocation)? That informs how much negotiation room exists.
- Schools are A-rated — typically a magnet for longer-tenancy family renters. What's the average tenant stay here, and is there a school-zone premium baked into asking?
- What's the average days-on-market for RENTAL listings here right now (not sales)? A rising rental-DOM trend means longer vacancies and softer asking-rent achievability than the comps imply.
- What's the recent tenant-quality profile in this submarket — average credit score on applications, eviction rate, late-payment / NSF rate, and stable-employment percentage? A property-management company in the area should have these aggregated.
- How much new apartment / multifamily construction is in the pipeline within 1–3 miles? Heavy new supply (>2% of stock underway) typically softens rents 12–24 months out; light construction supports rent growth.
Investment metrics
- 1% rule
- 1.37% ✓
- Cap rate
- 11.06%
- Cash-on-cash
- 17.02%
- DSCR
- 1.76
- GRM
- 6.1
CMA / ARV
No comps found within radius.
Projected returns pro-forma
-3.0% appreciation · 3.0% rent growth · sell at horizon
- IRR
- 8.3%
- Equity multiple
- 1.33×
- Total profit
- $75,428
- Equity at exit
- $123,457
- IRR
- 17.5%
- Equity multiple
- 2.45×
- Total profit
- $335,990
- Equity at exit
- $71,590
Cash invested: $231,840 (down + closing). Projections, not guarantees.
Landlord ↔ Tenant lean methodology
- Overall (STATE)
- 15 Strongly Tenant-Friendly
- State New York
- 15 Strongly Tenant-Friendly · D+10
- County
- — inherits STATE
- City
- — inherits STATE
ZIP-level market 11563
- Active inventory
- 133
- Price-to-rent
- 18.2×
Monthly cashflow live
- Estimated rent
- $11,361 medium interval (Pro) →
- Mortgage (P&I)
- −$4,342
- Tax from tax record
- −$1,000 /mo · $11,994/yr
- Insurance
- −$345
- HOA
- −$0
- Vacancy / Maint / Mgmt
- −$2,386
- Net cashflow
- $3,289
Break-even live
3-unit breakdown (identical units grouped — click to expand)
| Units | Beds | Baths | Est. rent |
|---|---|---|---|
| 3× units | 5 | 3 | $11,361 |
| #1 | 5 | 3 | $3,787 |
| #2 | 5 | 3 | $3,787 |
| #3 | 5 | 3 | $3,787 |
| Total (3 units) | $11,361 | ||
UW: 25.0% down · 7.5% · 30yr · 1.5% tax · 5.0% vac · 8.0% maint · 8.0% mgmt
Financing live
Cash to close
- Down payment
- $207,000
- Closing costs
- $24,840
- Reserves months
- —
- Total cash needed
- —
Loan-product check · same deal, 3 products live
Conventional
25% down · 7.5% · 30yr
- Down + closing
- —
- Monthly P&I
- —
- Monthly cashflow
- —
- DSCR
- —
- Eligible?
- —
Personal DTI + credit; lowest rate.
DSCR
20% down · 8.5% · 30yr
- Down + closing
- —
- Monthly P&I
- —
- Monthly cashflow
- —
- DSCR
- —
- Eligible?
- —
No personal income docs; deal must DSCR.
Hard money
10% down · 12.0% · 12mo
- Down + closing
- —
- Monthly P&I
- —
- Monthly cashflow
- —
- DSCR
- —
- Eligible?
- —
Short-term bridge; refi at stabilization.
Listing history 14 events
-
2026-06-18days on market $828,000 Active 24 DOM
-
2026-06-17days on market $828,000 Active 23 DOM
-
2026-06-16days on market $828,000 Active 22 DOM
-
2026-06-15days on market $828,000 Active 21 DOM
-
2026-06-13days on market $828,000 Active 19 DOM
-
2026-06-09days on market $828,000 Active 15 DOM
-
2026-06-08days on market $828,000 Active 14 DOM
-
2026-06-07days on market $828,000 Active 13 DOM
-
2026-06-04days on market $828,000 Active 10 DOM
-
2026-06-03days on market $828,000 Active 9 DOM
-
2026-06-02days on market $828,000 Active 8 DOM
-
2026-06-01days on market $828,000 Active 7 DOM
-
2026-05-31days on market $828,000 Active 6 DOM
-
2026-05-26$828,000 Active
ⓘ Source: listings_history table (triggers on properties + properties_extension) + one-shot
backfill from property_details.listing_events for pre-trigger history.
Tax reassessment forecast NY · Partial reset (capped growth)
- Current annual tax
- $11,994 · $1,000/mo
- Projected year-2 tax
- $12,994 · $1,083/mo
- Expected delta
- +$1,000/yr (+$83/mo · 8.3%)
ⓘ Screening estimate from a state-policy table — verify with the county assessor before closing.
Climate risk First Street
- Flood 4/10 Moderate FEMA zone X (unshaded) · 22% chance over 30 yrs
- Wildfire 1/10 Low
- Heat 6/10 Major 7 d/yr ≥97°F today · 16 d/yr by 30 yrs out
- Wind 6/10 Major 70% chance of damaging wind over 30 yrs
- Air quality 3/10 Moderate 4 unhealthy d/yr today · 4 by 30 yrs out
Nearby sold comps map
Loading sold comps map…
Walkable amenities ~0.75 mi
Loading nearby amenities…
Taxation est. · year 1
- Rental income
- $136,332
- − Mortgage interest
- −$46,381
- − Property taxes
- −$11,994
- − Insurance
- −$4,140
- − Repairs & maintenance
- −$10,907
- − Management
- −$10,907
- − Depreciation
- −$24,087
- Taxable income
- $27,917
- Est. tax owed @ 24.0%
- −$6,700
- After-tax cash flow
- $32,763/yr
For passive investors: Depreciation is non-cash, so a rental often shows a tax loss while cash-flowing — sheltering income. Rental losses are passive: they offset passive income freely, and up to $25,000/yr can offset ordinary (W-2) income if you actively participate and your MAGI is under $100k (phasing out to $0 by $150k); unused losses carry forward. On sale, claimed depreciation is recaptured at up to 25%, and gains may owe capital-gains tax (a 1031 exchange can defer both). Figures are a year-1 estimate at your 24.0% rate — not tax advice; consult a CPA.
Schools (NCES district)
- District
- Lynbrook Union Free School District
- NCES district ID
- 3617910
- Math proficiency
- 75% ▬ 0.00%
- Reading proficiency
- 73% ▲ 2.00%
- Median HH income
- $93,436
- Composite
- 66.85/100
- National rank
- #404
- State rank
- #72 of 590 in NY
Livability — Lynbrook
- Score
- 88/100
- State rank
- #10
- US rank
- #221
Category grades
Schools grade is shown separately in the Schools card above.
Census & demographics
- Census place
- Lynbrook, NY
- County
- Nassau County · 653,051 people
- City population
- 22,899
- Metro
- New York-Newark-Jersey City, NY-NJ-PA
- Population (ZIP)
- 22,899
- Household income
- $136,887
- Rent vs Own
- Severe rent burden
- 618.0
Population outlook (Nassau County) Hauer SSP2
- Today (2025)
- 1,409,302 people
- By 2030
- 1,431,482 · +1.6%
- By 2040
- 1,471,607 · +4.4%
- By 2050
- 1,502,845 · +6.6%
- By 2075
- 1,575,403 · +11.8%
- By 2100
- 1,554,356 · +10.3%
Race, ethnicity, and origin ACS 2023
- Neighborhood character
- Diverse neighborhood (Simpson 0.56)
- Race & ethnicity
- White 62% Hispanic / Latino 21% Two or more races 10% Asian 7% Black 7%
- Hispanic origin (detail)
- Mexican 1% Puerto Rican 4% Cuban 2% Dominican 3%
- Common ancestry
- Hispanic 2% Romanian 2% Scotch-Irish 2%
- Foreign-born
- 17% · Canada, China, Jamaica
- Languages at home
- 74% English-only · Spanish 13% Other Indo-European 7% French/Haitian/Cajun 2%
Political lean MEDSL · Nassau
- 2024 margin
- Toss-up / Even · D 47.9% · R 52.1%
- 2008→2024 swing
- -12.6pp toward R · 2008: 8.4pp · 2024: -4.2pp
- All cycles
- 2024: R+4.2 2020: D+9.5 2016: D+5.3 2012: D+6.7 2008: D+8.4
Not yet ingested
- Civics
- —
Market trends
- HPI YoY
- ▼ -652.00%
- Current HPI
- 317.1455
- Rent YoY
- —
- Metro
- New York-Newark-Jersey City, NY-NJ-PA
- State GDP YoY
- ▲ 2.60%
- F500 in state
- 92
Industry mix (Fortune 500 HQ in NY)
| Industry | F500 HQs | Revenue |
|---|---|---|
| Financial Services | 10 | $950B |
|
||
| Consumer Goods | 9 | $162B |
|
||
| Insurance | 4 | $225B |
|
||
| Telecommunications | 2 | $144B |
|
||
| Pharmaceuticals | 2 | $112B |
|
||
| Media / Entertainment | 2 | $69B |
|
||
Price history
1 event — show timeline
- 2026-05-26 Listed $828,000 OneKey® MLS as Distributed by MLS Grid
Property tax history
+3.1%/yrLatest (2024): $11,994 · -3.9% YoY. Source: county tax records.
Cash-flow waterfall
monthlySold comps — $/sqft
last 12 mo · ≤1 miLoading sold comps…