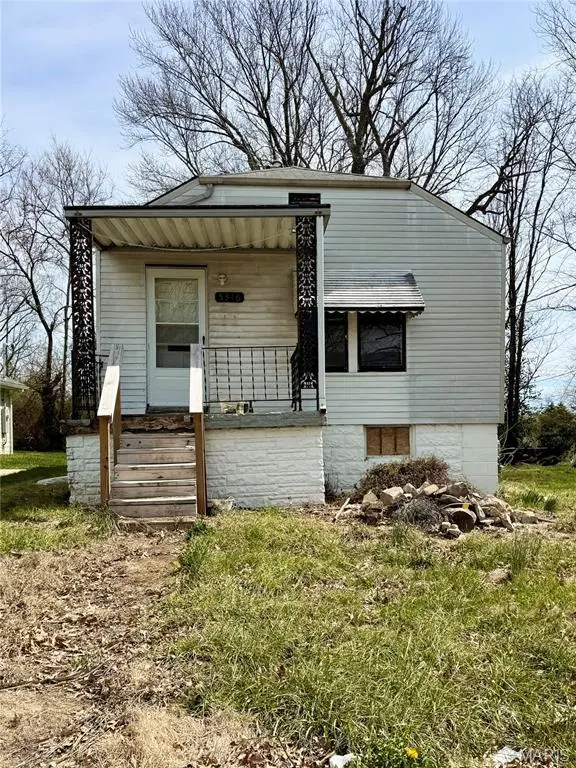
5346 Janet Ave · Jennings, MO
Flood risk 1/10 · Minimal
- FEMA flood zone
- X (unshaded)
- Chance of flooding over 30 yrs
- 0.0%
- Est. flood insurance / yr
- $473 – $860
Fire risk 1/10 · Minimal
- Est. fire insurance / yr
- $1,054 – $1,958
Heat risk 4/10 · Minor
- Hot days now (above 107°F)
- 7 days/yr
- Hot days in 30 yrs
- 19 days/yr
Wind risk 2/10 · Minimal
- Chance of severe wind over 30 yrs
- 1.0%
Air-quality risk 4/10 · Minor
- Unhealthy air days now
- 4 days/yr
- Unhealthy air days in 30 yrs
- 5 days/yr
Risk factors via First Street. Map © Google.
Why this score? — see what drove the A- grade
The composite is a weighted blend of 9 inputs, each scored 0–100. Each bar is that input's sub-score; the figure is the points it added to the 100-point composite (weight × sub-score).
- Cash flow +30.0/30.0
- ARV discount +15.0/15.0
- 1% rule +10.0/10.0
- DSCR +10.0/10.0
- Appreciation +6.9/10.0
- Rent growth +3.7/5.0
- Livability +3.4/5.0
- Condition / age +2.5/5.0
- Schools +1.1/10.0
$27,999
🖨 Deal sheet (PDF) 📄 Offer letter ✓ Due diligence
Listing remarks MLS
Great investment opportunity! With a little TLC, this property has the potential to become a valuable addition to any rental portfolio, offering strong ROI with a relatively low initial investment. This charming 2-bedroom, 1-bath home features a spacious living room, dining room, and kitchen. Beautiful archways and distinctive windows in the living room add unique character and appeal. The unfinished basement offers ample storage or the opportunity for future improvements, while the level yard provides an easy-to-maintain outdoor space with plenty of potential. Don’t miss your chance to capitalize on this promising investment opportunity. Property being sold AS-IS. OWNER BY CONTRACT.
Key facts
- Kitchen
- Unfinished basement
- Dining room
Tags
Neighborhood map
What this means for you Summary
Snapshot
- This is a 2-bed/1.0-bath single-family listed at $28k.
Deal economics
- At list price, monthly cash flow is $619 ($7k/yr) — positive.
- The deal already cash-flows at list — no discount required.
- Meets the 1% rule at list price ($1k rent vs $28k).
- Recommended offer: $27k (3.0% below list) — sets the bar for market timing.
- Cap rate 32.8% vs local median 11.9% in Jennings — top-decile yield for the area; either an underpriced asset or a hidden risk that comps aren't pricing in. Stress-test before assuming the spread holds.
Location & tenants
- Location reads 67/100 on livability (#208 in MO) — a middle-class / working-renter tenant base. Strengths: cost of living A+, commute A-, housing A-; Watch: crime F, amenities F, employment F.
- Jennings (suburban): math 8% / reading 20% proficiency, ranked #315 of 324 in MO (top 97%) — low school quality limits family demand, transient renter base, plan for 1-2y turnover; 86% free/reduced lunch — lower-income household profile, screen leases tightly.
- Zoned schools: Fairview Primary (math 34% / reading 34%, grade F, #676 of 1,115 statewide, top 66%, 267 students, 100% FRL); Rose Johnson Jennings Jr. High (math 10% / reading 23%, grade F, #357 of 391 statewide, top 91%, 361 students, 100% FRL); Jennings High (math 8% / reading 17%, grade F, #497 of 521 statewide, top 96%, 691 students, 100% FRL).
- Market conditions: Rents rising fast (+5.0%/yr); 379 active listings in the ZIP; 11 comparable units currently listed for rent nearby; rentals at typical pace (median 19d on market — plan ~3-4 weeks tenant-placement turnaround); lower-income renter base — watch delinquency; 920 units permitted in St. Louis County in 2024 (250 in 5+ unit buildings).
- This rent runs 30% of the median local income ($41k/yr) — at the standard rent-burdened threshold; future hikes will face affordability resistance.
Forward outlook
- In year one you build about $1k of equity ($193 loan paydown + $1k appreciation (3.8% local appreciation)).
- At projected returns (3.8% appreciation + 5.0% rent growth), your $8k cash investment doubles in ~1 year — after that, you're playing with house money.
Negotiation context
- It's been on market 57 days — a 3% lower offer ($27k) is reasonable based on typical stale-listing flexibility.
Risks & watch-outs
- Watch-outs: built in 1937 — expect roof / HVAC / electrical / plumbing capex.
Questions for the listing agent
- It's been on market 57 days. Have you received any prior offers? Is the seller open to a 3% concession, seller financing, or rate buy-down credit?
- Built in 1937 — when were the roof, HVAC, electrical panel, plumbing, and water heater last replaced?
- Is there a deadline driving the sale (1031 exchange, divorce, estate, relocation)? That informs how much negotiation room exists.
- Schools are D-rated, which usually means shorter tenancies and higher turnover. Who's the typical renter profile here, and what's been the actual vacancy rate?
- Crime grade is F in this area — have there been break-ins, vandalism, or insurance claims at this property in the last 3 years? What carrier currently insures it and at what premium?
- What's the average days-on-market for RENTAL listings here right now (not sales)? A rising rental-DOM trend means longer vacancies and softer asking-rent achievability than the comps imply.
- What's the recent tenant-quality profile in this submarket — average credit score on applications, eviction rate, late-payment / NSF rate, and stable-employment percentage? A property-management company in the area should have these aggregated.
- How much new for-sale + rental construction is in the pipeline within 1–3 miles? Heavy new supply typically softens prices + rents 12–24 months out; constrained supply supports both.
Investment metrics
- 1% rule
- 3.71% ✓
- Cap rate
- 32.83%
- Cash-on-cash
- 94.78%
- DSCR
- 5.22
- GRM
- 2.2
CMA / ARV
- ARV (median comp)
- $39,323
- List price
- $27,999
- Delta
- -28.80%
- Verdict
- UNDERPRICED
- Comps
- 20 within 1.0 mi
Show comp detail 12 sales within ~0.75 mi
| Address | Dist | Beds/Ba | Sqft | Sold | Price | $/sf | Match |
|---|---|---|---|---|---|---|---|
| 5239 Hamilton Ave | 0.24mi | 2/1.0 | 725 (+1%) | 2mo | $8,750 | $12 | 86 |
| 5411 Hamilton Ave | 0.18mi | 2/1.0 | 784 (+9%) | 8mo | $87,000 | $111 | 70 |
| 5526 Jennings Station Rd | 0.31mi | 2/1.0 | 768 (+7%) | 8mo | $70,000 | $91 | 68 |
| 6342 Lena Ave | 0.46mi | 2/1.0 | 678 (-6%) | 2mo | $40,000 | $59 | 67 |
| 4617 Hatz St | 0.68mi | 2/1.0 | 720 (0%) | 2mo | $30,000 | $42 | 67 |
| 4704 Seattle St | 0.52mi | 2/1.0 | 768 (+7%) | 1mo | $84,900 | $111 | 63 |
| 7121 Lamont Dr | 0.65mi | 2/1.0 | 716 (-1%) | 9mo | $50,000 | $70 | 61 |
| 5515 Hodiamont Ave | 0.31mi | 2/1.0 | 818 (+14%) | 8mo | $60,000 | $73 | 57 |
| 5920 Lalite Ave | 0.69mi | 2/1.0 | 760 (+6%) | 4mo | $22,000 | $29 | 55 |
| 6723 Stratford Ave | 0.58mi | 3/1.0 (+1) | 768 (+7%) | 6mo | $45,000 | $59 | 52 |
| 4419 June Ave | 0.62mi | 2/1.5 | 816 (+13%) | 4mo | $57,500 | $70 | 43 |
| 5760 Acme Ave | 0.70mi | 1/1.0 (-1) | 624 (-13%) | 4mo | $15,000 | $24 | 37 |
Match score weights: distance 35% · size 25% · config 20% · recency 20%. Top-matched comps best support the ARV.
Projected returns pro-forma
3.79% appreciation · 4.97% rent growth · sell at horizon
- IRR
- —
- Equity multiple
- 6.88×
- Total profit
- $46,119
- Equity at exit
- $13,854
- IRR
- —
- Equity multiple
- 15.14×
- Total profit
- $110,845
- Equity at exit
- $22,390
Cash invested: $7,840 (down + closing). Projections, not guarantees.
Landlord ↔ Tenant lean methodology
- Overall (STATE)
- 81 Strongly Landlord-Friendly
- State Missouri
- 81 Strongly Landlord-Friendly · R+10
- County
- — inherits STATE
- City
- — inherits STATE
ZIP-level market 63136
- Home prices YoY
- 0.9%
- Rents YoY
- 5.0%
- Active inventory
- 379
- Price-to-rent
- 2.2×
Monthly cashflow live
- Estimated rent
- $1,039 high interval (Pro) →
- Mortgage (P&I)
- −$147
- Tax from tax record
- −$43 /mo · $518/yr
- Insurance
- −$12
- HOA
- −$0
- Lot rent
- −$0
- Vacancy / Maint / Mgmt
- −$218
- Net cashflow
- $619
Break-even live
Sensitivity live
| Price | -10% $635 | -5% $627 | +0% $619 | +5% $611 | +10% $603 |
|---|---|---|---|---|---|
| Rent | -10% $537 | -5% $578 | +0% $619 | +5% $660 | +10% $701 |
| Rate | -1.0pp $633 | -0.5pp $626 | base $619 | +0.5pp $612 | +1.0pp $605 |
UW: 25.0% down · 7.5% · 30yr · 1.5% tax · 5.0% vac · 8.0% maint · 8.0% mgmt
Financing live
Cash to close
- Down payment
- $7,000
- Closing costs
- $840
- Reserves months
- —
- Total cash needed
- —
Loan-product check · same deal, 3 products live
Conventional
25% down · 7.5% · 30yr
- Down + closing
- —
- Monthly P&I
- —
- Monthly cashflow
- —
- DSCR
- —
- Eligible?
- —
Personal DTI + credit; lowest rate.
DSCR
20% down · 8.5% · 30yr
- Down + closing
- —
- Monthly P&I
- —
- Monthly cashflow
- —
- DSCR
- —
- Eligible?
- —
No personal income docs; deal must DSCR.
Hard money
10% down · 12.0% · 12mo
- Down + closing
- —
- Monthly P&I
- —
- Monthly cashflow
- —
- DSCR
- —
- Eligible?
- —
Short-term bridge; refi at stabilization.
Rent comps 11 comps
| Address | Beds | Baths | Sqft | Rent | $/sqft | DOM | Units | Dist |
|---|---|---|---|---|---|---|---|---|
| 7024 Idlewild Ave Saint Louis, MO | 2.0 | 1.0 | 588 | $995 | $1.69 | 46d | 1 | 0.16mi |
| 5635 Hodiamont Ave Saint Louis, MO | 2.0 | 1.0 | 580 | $899 | $1.55 | 22d | 1 | 0.46mi |
| 7142 Lamont Dr Saint Louis, MO | 2.0 | 1.0 | 750 | $1,100 | $1.47 | 20d | 1 | 0.67mi |
| 8344 Eton Pl Saint Louis, MO | 2.0 | 1.0 | 750 | $895 | $1.19 | 6d | 1 | 0.91mi |
| 8347 Eton Pl Saint Louis, MO | 2.0 | 1.0 | 750 | $1,075 | $1.43 | 46d | 1 | 0.93mi |
| 8347 Eton Pl Saint Louis, MO | 2.0 | 1.0 | 750 | $1,075 | $1.43 | 1d | 1 | 0.93mi |
| 5600 Gatesworth Ave Saint Louis, MO | 2.0 | 1.0 | 672 | $1,095 | $1.63 | 7d | 1 | 1.00mi |
| 4719 Plover Ave Saint Louis, MO | 2.0 | 1.0 | 744 | $995 | $1.34 | 7d | 1 | 1.04mi |
| 7516 Chandler Ave Saint Louis, MO | 1.0 | 1.0 | 728 | $1,000 | $1.37 | 46d | 1 | 1.14mi |
| 4935 Alcott Ave Saint Louis, MO | 3.0 | 1.0 | 680 | $705 | $1.04 | 18d | 1 | 1.34mi |
| 3 Pohlman Ln Saint Louis, MO | 2.0 | 1.0 | 704 | $1,000 | $1.42 | 18d | 1 | 1.45mi |
Listing history 13 events
-
2026-06-13statusdays on market $27,999 Pending 57 DOM
-
2026-06-09days on market $27,999 Active 56 DOM
-
2026-06-08days on market $27,999 Active 55 DOM
-
2026-06-07days on market $27,999 Active 54 DOM
-
2026-06-03days on market $27,999 Active 50 DOM
-
2026-06-02days on market $27,999 Active 49 DOM
-
2026-06-01days on market $27,999 Active 48 DOM
-
2026-05-31days on market $27,999 Active 47 DOM
-
2026-05-19price $27,999 698-char remark
Show marketing remark (698 chars)
Great investment opportunity! With a little TLC, this property has the potential to become a valuable addition to any rental portfolio, offering strong ROI with a relatively low initial investment. This charming 2-bedroom, 1-bath home features a spacious living room, dining room, and kitchen. Beautiful archways and distinctive windows in the living room add unique character and appeal. The unfinished basement offers ample storage or the opportunity for future improvements, while the level yard provides an easy-to-maintain outdoor space with plenty of potential. Don’t miss your chance to capitalize on this promising investment opportunity. Property being sold AS-IS. OWNER BY CONTRACT.
-
2026-04-28price $29,999 698-char remark
Show marketing remark (698 chars)
Great investment opportunity! With a little TLC, this property has the potential to become a valuable addition to any rental portfolio, offering strong ROI with a relatively low initial investment. This charming 2-bedroom, 1-bath home features a spacious living room, dining room, and kitchen. Beautiful archways and distinctive windows in the living room add unique character and appeal. The unfinished basement offers ample storage or the opportunity for future improvements, while the level yard provides an easy-to-maintain outdoor space with plenty of potential. Don’t miss your chance to capitalize on this promising investment opportunity. Property being sold AS-IS. OWNER BY CONTRACT.
-
2026-04-14$35,000 Active 698-char remark
Show marketing remark (698 chars)
Great investment opportunity! With a little TLC, this property has the potential to become a valuable addition to any rental portfolio, offering strong ROI with a relatively low initial investment. This charming 2-bedroom, 1-bath home features a spacious living room, dining room, and kitchen. Beautiful archways and distinctive windows in the living room add unique character and appeal. The unfinished basement offers ample storage or the opportunity for future improvements, while the level yard provides an easy-to-maintain outdoor space with plenty of potential. Don’t miss your chance to capitalize on this promising investment opportunity. Property being sold AS-IS. OWNER BY CONTRACT.
-
2022-02-23soldstatus $140,000
-
2003-12-30soldstatus $22,000
ⓘ Source: listings_history table (triggers on properties + properties_extension) + one-shot
backfill from property_details.listing_events for pre-trigger history.
Tax reassessment forecast MO · Resets to sale price
- Current annual tax
- $518 · $43/mo
- Projected year-2 tax
- $518 · $43/mo
- Expected delta
- $0/yr ($0/mo · 0.0%)
ⓘ Screening estimate from a state-policy table — verify with the county assessor before closing.
Climate risk First Street
- Flood 1/10 Low FEMA zone X (unshaded) · 0% chance over 30 yrs
- Wildfire 1/10 Low
- Heat 4/10 Moderate 7 d/yr ≥107°F today · 19 d/yr by 30 yrs out
- Wind 2/10 Low 100% chance of damaging wind over 30 yrs
- Air quality 4/10 Moderate 4 unhealthy d/yr today · 5 by 30 yrs out
Nearby sold comps map
Loading sold comps map…
Walkable amenities ~0.75 mi
Loading nearby amenities…
Taxation est. · year 1
- Rental income
- $12,469
- − Mortgage interest
- −$1,568
- − Property taxes
- −$518
- − Insurance
- −$140
- − Repairs & maintenance
- −$997
- − Management
- −$997
- − Depreciation
- −$815
- Taxable income
- $7,433
- Est. tax owed @ 24.0%
- −$1,784
- After-tax cash flow
- $5,647/yr
For passive investors: Depreciation is non-cash, so a rental often shows a tax loss while cash-flowing — sheltering income. Rental losses are passive: they offset passive income freely, and up to $25,000/yr can offset ordinary (W-2) income if you actively participate and your MAGI is under $100k (phasing out to $0 by $150k); unused losses carry forward. On sale, claimed depreciation is recaptured at up to 25%, and gains may owe capital-gains tax (a 1031 exchange can defer both). Figures are a year-1 estimate at your 24.0% rate — not tax advice; consult a CPA.
Schools (NCES district)
- District
- Jennings
- NCES district ID
- 2916290
- Math proficiency
- 8% ▼ -16.00%
- Reading proficiency
- 20% ▼ -4.00%
- Median HH income
- $30,595
- Composite
- 11.04/100
- National rank
- #9739
- State rank
- #315 of 324 in MO
Livability — Jennings
- Score
- 67/100
- State rank
- #208
- US rank
- #10499
Category grades
Schools grade is shown separately in the Schools card above.
Census & demographics
- Census place
- Jennings, MO
- County
- Saint Louis County · 888,823 people
- Metro
- St. Louis, MO-IL
- Population (ZIP)
- 40,929
- Household income
- $41,154
- Rent vs Own
- Severe rent burden
- 3085.0
Population outlook (St. Louis County) Hauer SSP2
- Today (2025)
- 1,025,227 people
- By 2030
- 1,028,023 · +0.3%
- By 2040
- 1,020,940 · -0.4%
- By 2050
- 1,007,280 · -1.8%
- By 2075
- 987,277 · -3.7%
- By 2100
- 921,984 · -10.1%
Race, ethnicity, and origin ACS 2023
- Neighborhood character
- Predominantly Black (90%)
- Race & ethnicity
- Black 90% White 5% Two or more races 3%
- Foreign-born
- 1% · Canada
Political lean MEDSL · St. Louis
- 2024 margin
- Strong D (+23.4) · D 60.8% · R 37.4% · Other 1.7%
- 2008→2024 swing
- +3.5pp toward D · 2008: 19.9pp · 2024: 23.4pp
- All cycles
- 2024: D+23.4 2020: D+24.0 2016: D+16.2 2012: D+13.7 2008: D+19.9
Not yet ingested
- Civics
- —
Market trends
- HPI YoY
- ▲ 3.79%
- Current HPI
- 420.28
- Rent YoY
- ▲ 4.97%
- Metro
- St. Louis, MO-IL
- State GDP YoY
- ▲ 1.84%
- F500 in state
- 20
Industry mix (Fortune 500 HQ in MO)
| Industry | F500 HQs | Revenue |
|---|---|---|
| Healthcare | 1 | $163B |
|
||
| Insurance | 1 | $21B |
|
||
| Industrial Technology | 1 | $17B |
|
||
| Retail | 1 | $16B |
|
||
| Industrial Distribution | 1 | $10B |
|
||
| Utilities | 1 | $9B |
|
||
Price history
+27.3% since first listed5 events — show timeline
- 2026-05-19 Price Changed $27,999 MARIS as Distributed by MLS Grid
- 2026-04-28 Price Changed $29,999 MARIS as Distributed by MLS Grid
- 2026-04-14 Listed $35,000 MARIS as Distributed by MLS Grid
- 2022-02-23 Sold (Public Records) $140,000 Public Records
- 2003-12-30 Sold (Public Records) $22,000 Public Records
Property tax history
-1.3%/yrLatest (2022): $518 · +1.5% YoY. Source: county tax records.
Cash-flow waterfall
monthlySold comps — $/sqft
last 12 mo · ≤1 miLoading sold comps…