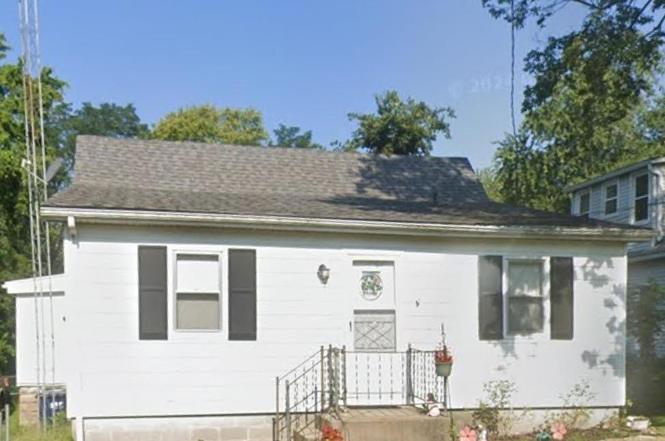
817 N 6th St · Mount Vernon, IL
Flood risk 1/10 · Minimal
- FEMA flood zone
- X (unshaded)
- Chance of flooding over 30 yrs
- 0.0%
- Est. flood insurance / yr
- $507 – $1,088
Fire risk 1/10 · Minimal
- Est. fire insurance / yr
- $804 – $1,492
Heat risk 4/10 · Minor
- Hot days now (above 105°F)
- 7 days/yr
- Hot days in 30 yrs
- 20 days/yr
Wind risk 2/10 · Minimal
- Chance of severe wind over 30 yrs
- 2.0%
Air-quality risk 2/10 · Minimal
- Unhealthy air days now
- 0 days/yr
- Unhealthy air days in 30 yrs
- 1 days/yr
Risk factors via First Street. Map © Google.
Why this score? — see what drove the B- grade
The composite is a weighted blend of 9 inputs, each scored 0–100. Each bar is that input's sub-score; the figure is the points it added to the 100-point composite (weight × sub-score).
- Cash flow +30.0/30.0
- DSCR +10.0/10.0
- 1% rule +9.2/10.0
- ARV discount +7.5/15.0
- Livability +3.5/5.0
- Rent growth +2.5/5.0
- Condition / age +2.5/5.0
- Schools +1.2/10.0
- Appreciation +0.0/10.0
$89,900
🖨 Deal sheet 📄 Offer letter ✓ Due diligence
Listing remarks
Spacious and well-maintained 3 bedroom, 1.5 bath home located at 817 N 6th St in Mt. Vernon. This clean and inviting property features a brand-new roof, large rear deck, a fully fenced yard, and a basement offering great storage space. The home includes all appliances, making it truly move-in ready. With generous room sizes and a functional layout, this home offers comfort and convenience both inside and out. A great opportunity for homeowners or investors alike—don’t miss it! Please call today to set up a private showing. Owner requires potential buyers to be pre approved by lender or provide proof of funds.
Key facts
- Hot water heater
- New roof
- Up to date furnace
Tags
Neighborhood map
What this means for you Summary
Snapshot
- This is a 3-bed/1.5-bath other listed at $90k.
Deal economics
- At list price, monthly cash flow is $361 ($4k/yr) — positive.
- The deal already cash-flows at list — no discount required.
- Meets the 1% rule at list price ($1k rent vs $90k).
- Recommended offer: $89k (1.5% below list) — sets the bar for market timing.
- Cap rate 11.1% vs local median 5.3% in Mount Vernon — top-decile yield for the area; either an underpriced asset or a hidden risk that comps aren't pricing in. Stress-test before assuming the spread holds.
Location & tenants
- Location reads 69/100 on livability (#413 in IL) — a middle-class / working-renter tenant base. Strengths: cost of living A+, housing A+, health & safety A+; Watch: schools F, amenities F, commute F.
- Mt Vernon Twp Hsd 201 (town): math 13% / reading 16% proficiency, ranked #532 of 620 in IL (top 86%) — low school quality limits family demand, transient renter base, plan for 1-2y turnover.
- Market conditions: 186 active listings in the ZIP; 6 units permitted in Jefferson County in 2024 (0 in 5+ unit buildings).
Forward outlook
- Local home prices are declining (-3.0%/yr); year-one equity from $622 of loan paydown is wiped out by about $3k of value loss. Plan a longer hold.
- Jefferson County population projected at -14% by 2050 — secular population decline; favor cash flow + early exit over multi-decade hold.
- At projected returns (-3.0% appreciation + 3.0% rent growth), your $25k cash investment doubles in ~7 years — after that, you're playing with house money.
Negotiation context
- It's been on market 27 days — a 2% lower offer ($89k) is reasonable based on typical stale-listing flexibility.
Risks & watch-outs
- Watch-outs: built in 1920 — expect roof / HVAC / electrical / plumbing capex.
Questions for the listing agent
- Built in 1920 — when were the roof, HVAC, electrical panel, plumbing, and water heater last replaced?
- Is there a deadline driving the sale (1031 exchange, divorce, estate, relocation)? That informs how much negotiation room exists.
- Schools are F-rated, which usually means shorter tenancies and higher turnover. Who's the typical renter profile here, and what's been the actual vacancy rate?
- What's the average days-on-market for RENTAL listings here right now (not sales)? A rising rental-DOM trend means longer vacancies and softer asking-rent achievability than the comps imply.
- What's the recent tenant-quality profile in this submarket — average credit score on applications, eviction rate, late-payment / NSF rate, and stable-employment percentage? A property-management company in the area should have these aggregated.
- How much new for-sale + rental construction is in the pipeline within 1–3 miles? Heavy new supply typically softens prices + rents 12–24 months out; constrained supply supports both.
Investment metrics
- 1% rule
- 1.42% ✓
- Cap rate
- 11.11%
- Cash-on-cash
- 17.21%
- DSCR
- 1.77
- GRM
- 5.9
CMA / ARV
No comps found within radius.
Projected returns pro-forma
-3.0% appreciation · 3.0% rent growth · sell at horizon
- IRR
- 8.6%
- Equity multiple
- 1.34×
- Total profit
- $8,466
- Equity at exit
- $13,404
- IRR
- 17.8%
- Equity multiple
- 2.47×
- Total profit
- $37,129
- Equity at exit
- $7,773
Cash invested: $25,172 (down + closing). Projections, not guarantees.
Landlord ↔ Tenant lean methodology
- Overall (STATE)
- 43 Moderately Tenant-Leaning
- State Illinois
- 43 Moderately Tenant-Leaning · D+7
- County
- — inherits STATE
- City
- — inherits STATE
ZIP-level market 62864
- Active inventory
- 186
- Price-to-rent
- 5.9×
Monthly cashflow live
- Estimated rent
- $1,276 medium interval (Pro) →
- Mortgage (P&I)
- −$471
- Tax from tax record
- −$138 /mo · $1,661/yr
- Insurance
- −$37
- HOA
- −$0
- Vacancy / Maint / Mgmt
- −$268
- Net cashflow
- $361
Break-even live
UW: 25.0% down · 7.5% · 30yr · 1.5% tax · 5.0% vac · 8.0% maint · 8.0% mgmt
Financing live
Cash to close
- Down payment
- $22,475
- Closing costs
- $2,697
- Reserves months
- —
- Total cash needed
- —
Loan-product check · same deal, 3 products live
Conventional
25% down · 7.5% · 30yr
- Down + closing
- —
- Monthly P&I
- —
- Monthly cashflow
- —
- DSCR
- —
- Eligible?
- —
Personal DTI + credit; lowest rate.
DSCR
20% down · 8.5% · 30yr
- Down + closing
- —
- Monthly P&I
- —
- Monthly cashflow
- —
- DSCR
- —
- Eligible?
- —
No personal income docs; deal must DSCR.
Hard money
10% down · 12.0% · 12mo
- Down + closing
- —
- Monthly P&I
- —
- Monthly cashflow
- —
- DSCR
- —
- Eligible?
- —
Short-term bridge; refi at stabilization.
Listing history 13 events
-
2026-05-24status Pending
-
2026-05-24status Pending
-
2026-05-22status Pending
-
2026-03-04soldstatus $85,000
-
2026-02-27soldstatus $85,000 Closed
-
2026-02-27soldstatus $85,000 Closed
-
2026-02-27soldstatus $85,000 Closed
-
2026-02-27soldstatus $85,000 Closed
-
2026-01-15status Pending
-
2026-01-08status Active
-
2026-01-06historical
-
2026-01-05historical
-
2025-12-15Active
ⓘ Source: listings_history table (triggers on properties + properties_extension) + one-shot
backfill from property_details.listing_events for pre-trigger history.
Tax reassessment forecast IL · Partial reset (capped growth)
- Current annual tax
- $1,661 · $138/mo
- Projected year-2 tax
- $1,851 · $154/mo
- Expected delta
- +$190/yr (+$16/mo · 11.4%)
ⓘ Screening estimate from a state-policy table — verify with the county assessor before closing.
Climate risk First Street
- Flood 1/10 Low FEMA zone X (unshaded) · 0% chance over 30 yrs
- Wildfire 1/10 Low
- Heat 4/10 Moderate 7 d/yr ≥105°F today · 20 d/yr by 30 yrs out
- Wind 2/10 Low 2% chance of damaging wind over 30 yrs
- Air quality 2/10 Low 0 unhealthy d/yr today · 1 by 30 yrs out
Nearby sold comps map
Loading sold comps map…
Walkable amenities ~0.75 mi
Loading nearby amenities…
Taxation est. · year 1
- Rental income
- $15,317
- − Mortgage interest
- −$5,036
- − Property taxes
- −$1,661
- − Insurance
- −$450
- − Repairs & maintenance
- −$1,225
- − Management
- −$1,225
- − Depreciation
- −$2,615
- Taxable income
- $3,105
- Est. tax owed @ 24.0%
- −$745
- After-tax cash flow
- $3,588/yr
For passive investors: Depreciation is non-cash, so a rental often shows a tax loss while cash-flowing — sheltering income. Rental losses are passive: they offset passive income freely, and up to $25,000/yr can offset ordinary (W-2) income if you actively participate and your MAGI is under $100k (phasing out to $0 by $150k); unused losses carry forward. On sale, claimed depreciation is recaptured at up to 25%, and gains may owe capital-gains tax (a 1031 exchange can defer both). Figures are a year-1 estimate at your 24.0% rate — not tax advice; consult a CPA.
Schools (NCES district)
- District
- Mt Vernon Twp Hsd 201
- NCES district ID
- 1727360
- Math proficiency
- 13% ▼ -8.00%
- Reading proficiency
- 16% ▼ -8.00%
- Median HH income
- $38,188
- Composite
- 12.22/100
- National rank
- #9648
- State rank
- #532 of 620 in IL
Livability — Mount Vernon
- Score
- 69/100
- State rank
- #413
- US rank
- #8520
Category grades
Schools grade is shown separately in the Schools card above.
Census & demographics
- Census place
- Mount Vernon, IL
- Population (ZIP)
- 23,061
Population outlook (Jefferson County) Hauer SSP2
- Today (2025)
- 36,818 people
- By 2030
- 35,764 · -2.9%
- By 2040
- 33,649 · -8.6%
- By 2050
- 31,557 · -14.3%
- By 2075
- 26,055 · -29.2%
- By 2100
- 19,237 · -47.8%
Race, ethnicity, and origin ACS 2023
- Neighborhood character
- Predominantly White (83%)
- Race & ethnicity
- White 83% Black 8% Two or more races 6% Hispanic / Latino 3% Asian 1%
- Common ancestry
- Romanian 2% Slovak 2% Serbian 2%
- Foreign-born
- 2% · Canada
- Languages at home
- 97% English-only · Spanish 1% Tagalog/Filipino 1%
Political lean MEDSL · Jefferson
- 2024 margin
- Solid R (+47.8) · D 25.5% · R 73.3% · Other 1.3%
- 2008→2024 swing
- -37.0pp toward R · 2008: -10.7pp · 2024: -47.8pp
- All cycles
- 2024: R+47.8 2020: R+45.1 2016: R+43.2 2012: R+22.9 2008: R+10.7
Not yet ingested
- Civics
- —
Market trends
- HPI YoY
- ▼ -83.64%
- Current HPI
- 134.2669
- Rent YoY
- —
- Metro
- —
- State GDP YoY
- ▲ 1.59%
- F500 in state
- 60
Industry mix (Fortune 500 HQ in IL)
| Industry | F500 HQs | Revenue |
|---|---|---|
| Insurance | 4 | $201B |
|
||
| Consumer Goods | 4 | $87B |
|
||
| Industrial Machinery | 3 | $64B |
|
||
| Healthcare | 2 | $55B |
|
||
| Retail / Pharmacy | 1 | $148B |
|
||
| Agriculture / Food | 1 | $86B |
|
||
Price history
+0.0% since first listed13 events — show timeline
- 2026-05-24 Pending — MRED as Distributed by MLS Grid
- 2026-05-24 Pending — MRED as Distributed by MLS Grid
- 2026-05-22 Pending — MRED as Distributed by MLS Grid
- 2026-03-04 Sold (Public Records) $85,000 Public Records
- 2026-02-27 Sold (MLS) $85,000 MRED as Distributed by MLS Grid
- 2026-02-27 Sold (MLS) $85,000 MRED as Distributed by MLS Grid
- 2026-02-27 Sold (MLS) $85,000 MRED as Distributed by MLS Grid
- 2026-02-27 Sold (MLS) $85,000 MRED as Distributed by MLS Grid
- 2026-01-15 Pending — MRED as Distributed by MLS Grid
- 2026-01-08 Relisted — MRED as Distributed by MLS Grid
- 2026-01-06 Listing Removed — RMLSA as Distributed by MLS Grid
- 2026-01-05 Listing Removed — MRED as Distributed by MLS Grid
- 2025-12-15 Listed — RMLSA as Distributed by MLS Grid
Property tax history
+2.5%/yrLatest (2024): $1,661 · +7.5% YoY. Source: county tax records.
Cash-flow waterfall
monthlySold comps — $/sqft
last 12 mo · ≤1 miLoading sold comps…