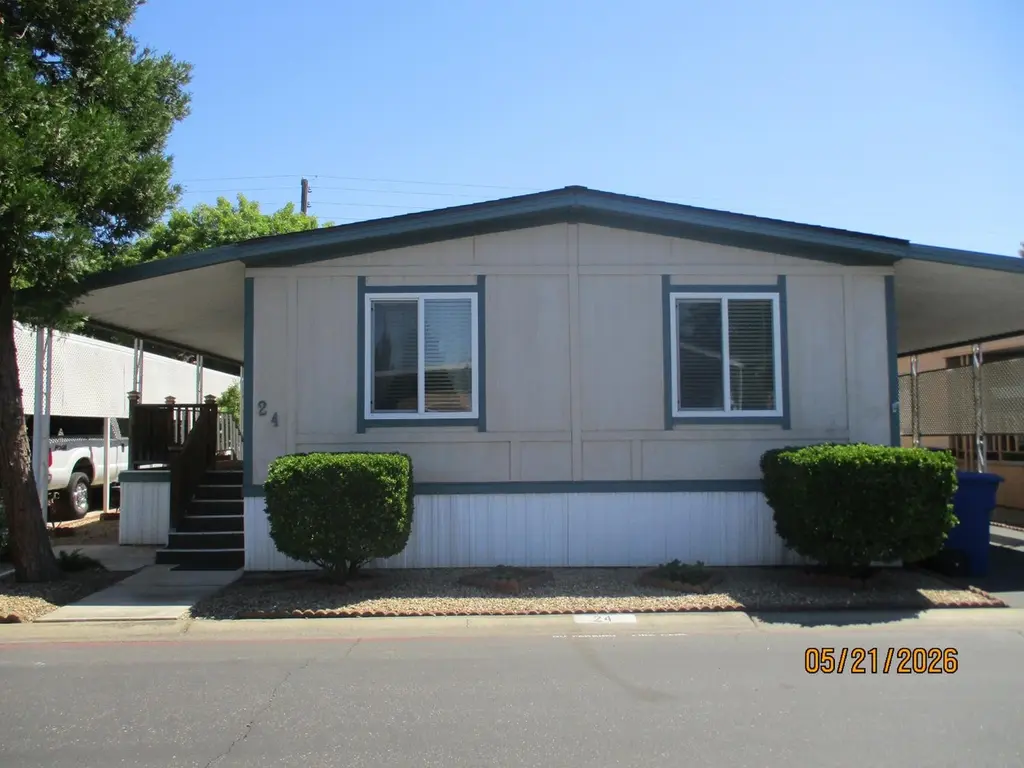
24 Schooner Ln · Modesto, CA
Flood risk 1/10 · Minimal
- FEMA flood zone
- X (unshaded)
- Chance of flooding over 30 yrs
- 0.0%
- Est. flood insurance / yr
- $507 – $1,088
Fire risk 5/10 · Moderate
- Est. fire insurance / yr
- $659 – $1,223
Heat risk 7/10 · Major
- Hot days now (above 102°F)
- 7 days/yr
- Hot days in 30 yrs
- 15 days/yr
Wind risk 1/10 · Minimal
- Chance of severe wind over 30 yrs
- —
Air-quality risk 10/10 · Severe
- Unhealthy air days now
- 28 days/yr
- Unhealthy air days in 30 yrs
- 32 days/yr
Risk factors via First Street. Map © Google.
Why this score? — see what drove the B+ grade
The composite is a weighted blend of 9 inputs, each scored 0–100. Each bar is that input's sub-score; the figure is the points it added to the 100-point composite (weight × sub-score).
- Cash flow +30.0/30.0
- ARV discount +15.0/15.0
- 1% rule +10.0/10.0
- DSCR +10.0/10.0
- Schools +4.4/10.0
- Livability +3.2/5.0
- Condition / age +2.8/5.0
- Rent growth +2.5/5.0
- Appreciation +0.0/10.0
$96,000
🖨 Deal sheet 📄 Offer letter ✓ Due diligence
Listing remarks
Welcome to this clean and inviting home in a quiet senior community! Featuring an open-concept layout, a nice size yard perfect for relaxing or gardening. Newer roof and HVAC system already in place. The home may need some cosmetic updates, but it has been lovingly maintained and is full of opportunity and charm.
Key facts
- Nice size yard
- Newer roof
- Hvac system
Tags
Property features AI
Finance
- Financial info: Land lease: No (listed land lease amount present in source but excluded per instructions)
- HOA & community: No homeowners association; Senior community
Exterior
- Parking: Assigned covered parking; Off-street parking; Guest parking available
- Utilities: Public water; Public sewer; 220 volts available in laundry
- Home design: Manufactured home in park (double wide); Original condition; Built in 1981
- Construction: Composition roof; Skirting: aluminum, vinyl, and wood; Manufacturer: Redman Home Inc; Model/Make: Kirkwood
- Exterior features: Fenced backyard; Backyard; Porch
Interior
- Kitchen: Island with breakfast area; Laminate countertops; Free standing electric range
- Bedrooms: 2 bedrooms (including master bedroom)
- Flooring: Carpet; Linoleum
- Bathrooms: 2 full bathrooms; Tub with shower over
- Heating & cooling: Central heating; Central air conditioning; Ceiling fans
- Interior features: Porch with steps and awning; Dual-pane full windows; Cathedral/vaulted living room; Dining and living room combined
- Laundry & utility: Indoor laundry room (220V in laundry)
Neighborhood map
What this means for you Summary
Snapshot
- This is a 2-bed/2.0-bath manufactured listed at $96k. Condition is rated average.
Deal economics
- At list price, monthly cash flow is $973 ($12k/yr) — positive.
- The deal already cash-flows at list — no discount required.
- Meets the 1% rule at list price ($2k rent vs $96k).
- Recommended offer: $95k (1.5% below list) — sets the bar for market timing.
- Cap rate 18.5% vs local median 3.2% in Modesto — top-decile yield for the area; either an underpriced asset or a hidden risk that comps aren't pricing in. Stress-test before assuming the spread holds.
Location & tenants
- Location reads 63/100 on livability (#451 in CA) — a middle-class / working-renter tenant base. Strengths: housing A+; Watch: amenities C-, schools D+, health & safety D+.
- Sylvan Union Elementary (urban): math 44% / reading 52% proficiency, ranked #457 of 1,400 in CA (top 33%) — families likely to look elsewhere, expect single-tenant / working-renter base with shorter leases.
- Market conditions: Rents soft (-0.1%/yr); 145 active listings in the ZIP; 14 comparable units currently listed for rent nearby; rentals leasing fast (median 14d on market — plan ~1-2 weeks tenant-placement turnaround); solid renter incomes; 923 units permitted in Stanislaus County in 2024 (63 in 5+ unit buildings).
Forward outlook
- Local home prices are declining (-3.0%/yr); year-one equity from $664 of loan paydown is wiped out by about $3k of value loss. Plan a longer hold.
- Stanislaus County population projected at +14% by 2050 — modest demand growth; plan on rents tracking national, not racing it.
- At projected returns (-3.0% appreciation + 0.0% rent growth), your $27k cash investment doubles in ~3 years — after that, you're playing with house money.
Negotiation context
- It's been on market 27 days — a 2% lower offer ($95k) is reasonable based on typical stale-listing flexibility.
Risks & watch-outs
- Climate carrying-cost: moderate wildfire risk; extreme-heat days projected 7→15/yr by 2055 (HVAC capex compounding) — expect insurance premiums to compound above CPI over the hold.
Questions for the listing agent
- Is there a deadline driving the sale (1031 exchange, divorce, estate, relocation)? That informs how much negotiation room exists.
- Schools are D-rated, which usually means shorter tenancies and higher turnover. Who's the typical renter profile here, and what's been the actual vacancy rate?
- Crime grade is F in this area — have there been break-ins, vandalism, or insurance claims at this property in the last 3 years? What carrier currently insures it and at what premium?
- What's the average days-on-market for RENTAL listings here right now (not sales)? A rising rental-DOM trend means longer vacancies and softer asking-rent achievability than the comps imply.
- What's the recent tenant-quality profile in this submarket — average credit score on applications, eviction rate, late-payment / NSF rate, and stable-employment percentage? A property-management company in the area should have these aggregated.
- How much new for-sale + rental construction is in the pipeline within 1–3 miles? Heavy new supply typically softens prices + rents 12–24 months out; constrained supply supports both.
Investment metrics
- 1% rule
- 2.16% ✓
- Cap rate
- 18.46%
- Cash-on-cash
- 43.45%
- DSCR
- 2.93
- GRM
- 3.9
CMA / ARV
- ARV (on-the-fly)
- $124,992
- Comps found
- 12
Show comp detail 12 sales within ~0.75 mi
| Address | Dist | Beds/Ba | Sqft | Sold | Price | $/sf | Match |
|---|---|---|---|---|---|---|---|
| 19 Schooner Ln | 0.02mi | 2/2.0 | 1,344 (0%) | 2mo | $114,500 | $85 | 98 |
| 195 Schooner Ln | 0.07mi | 2/2.0 | 1,322 (-2%) | 4mo | $132,000 | $100 | 90 |
| 132 Sloop | 0.10mi | 2/2.0 | 1,344 (0%) | 10mo | $138,000 | $103 | 87 |
| 67 Clipper | 0.08mi | 3/2.0 (+1) | 1,344 (0%) | 10mo | $125,000 | $93 | 82 |
| 3 Schooner Ln | 0.09mi | 2/2.0 | 1,440 (+7%) | 7mo | $118,840 | $83 | 78 |
| 93 Schooner Ln | 0.21mi | 3/2.0 (+1) | 1,296 (-4%) | 3mo | $150,000 | $116 | 77 |
| 30 Schooner #30 | 0.09mi | 2/2.0 | 1,248 (-7%) | 12mo | $117,500 | $94 | 74 |
| 48 Clipper Ln | 0.09mi | 2/2.0 | 1,160 (-14%) | 2mo | $129,000 | $111 | 72 |
| 165 Clipper Ln | 0.09mi | 2/2.0 | 1,200 (-11%) | 12mo | $105,000 | $88 | 68 |
| 3955 Coffee #53 | 0.47mi | 2/2.0 | 1,440 (+7%) | 1mo | $81,900 | $57 | 65 |
| 3955 Coffee Rd #71 | 0.47mi | 2/2.0 | 1,296 (-4%) | 11mo | $95,000 | $73 | 63 |
| 4125 Mchenry Ave #71 | 0.54mi | 2/2.0 | 1,200 (-11%) | 9mo | $84,000 | $70 | 49 |
Match score weights: distance 35% · size 25% · config 20% · recency 20%. Top-matched comps best support the ARV.
Projected returns pro-forma
-3.0% appreciation · 0.0% rent growth · sell at horizon
- IRR
- 36.9%
- Equity multiple
- 2.50×
- Total profit
- $40,392
- Equity at exit
- $14,314
- IRR
- 42.0%
- Equity multiple
- 4.41×
- Total profit
- $91,656
- Equity at exit
- $8,300
Cash invested: $26,880 (down + closing). Projections, not guarantees.
Landlord ↔ Tenant lean methodology
- Overall (STATE)
- 18 Strongly Tenant-Friendly
- State California
- 18 Strongly Tenant-Friendly · D+13
- County
- — inherits STATE
- City
- — inherits STATE
ZIP-level market 95356
- Rents YoY
- -0.1%
- Active inventory
- 145
- Price-to-rent
- 3.9×
Monthly cashflow live
- Estimated rent
- $2,072 high interval (Pro) →
- Mortgage (P&I)
- −$503
- Tax est. 1.5%
- −$120 /mo · $1,440/yr
- Insurance
- −$40
- HOA
- −$0
- Vacancy / Maint / Mgmt
- −$435
- Net cashflow
- $973
Break-even live
UW: 25.0% down · 7.5% · 30yr · 1.5% tax · 5.0% vac · 8.0% maint · 8.0% mgmt
Financing live
Cash to close
- Down payment
- $24,000
- Closing costs
- $2,880
- Reserves months
- —
- Total cash needed
- —
Loan-product check · same deal, 3 products live
Conventional
25% down · 7.5% · 30yr
- Down + closing
- —
- Monthly P&I
- —
- Monthly cashflow
- —
- DSCR
- —
- Eligible?
- —
Personal DTI + credit; lowest rate.
DSCR
20% down · 8.5% · 30yr
- Down + closing
- —
- Monthly P&I
- —
- Monthly cashflow
- —
- DSCR
- —
- Eligible?
- —
No personal income docs; deal must DSCR.
Hard money
10% down · 12.0% · 12mo
- Down + closing
- —
- Monthly P&I
- —
- Monthly cashflow
- —
- DSCR
- —
- Eligible?
- —
Short-term bridge; refi at stabilization.
Rent comps 14 comps
| Address | Beds | Baths | Sqft | Rent | $/sqft | DOM | Units | Dist |
|---|---|---|---|---|---|---|---|---|
| 3509 Dragoo Park Dr Unit 3511 Modesto, CA | 3.0 | 2.0 | 1335 | $1,899 | $1.42 | 23d | 1 | 0.46mi |
| 939 Claremont Ct Modesto, CA | 3.0 | 2.5 | 1406 | $2,100 | $1.49 | 13d | 1 | 0.55mi |
| 3904 Monteview Dr Unit 1 Modesto, CA | 3.0 | 2.0 | 1100 | $1,995 | $1.81 | 21d | 1 | 0.70mi |
| 1305 Sylvan Meadows Dr Unit C Modesto, CA | 2.0 | 1.5 | 1037 | $2,150 | $2.07 | 13d | 1 | 0.76mi |
| 3400 Coffee Rd Modesto, CA | 2.0 | 2.0 | 951 | $1,945 | $2.05 | 21d | 1 | 0.93mi |
| 3104 Sherwood Ave Modesto, CA | 2.0 | 1.0 | 820 | $2,071 | $2.53 | 13d | 10 | 1.05mi |
| 204 Emerson Ave Unit A Modesto, CA | 3.0 | 1.0 | 1252 | $2,150 | $1.72 | 23d | 1 | 1.08mi |
| 3701 Colonial Dr #154 Modesto, CA | 2.0 | 1.5 | 978 | $1,950 | $1.99 | 13d | 1 | 1.22mi |
| 1339 E Rumble Rd Modesto, CA | 2.0 | 1.0 | 1150 | $1,800 | $1.57 | 13d | 1 | 1.26mi |
| 3445 Colonial Dr Modesto, CA | 1.0–2.0 | 1.0 | 918 | $2,295 | $2.50 | 13d | 10 | 1.29mi |
| 200 Sheila Ct Modesto, CA | 1.0–2.0 | 1.0–1.5 | 841 | $1,725 | $2.05 | 13d | 1 | 1.34mi |
| 2912 Niabell Pl Modesto, CA | 3.0 | 2.0 | 1470 | $2,700 | $1.84 | 13d | 1 | 1.35mi |
| 1313 Floyd Ave Modesto, CA | 1.0–2.0 | 1.0 | 800 | $1,725 | $2.16 | 13d | 2 | 1.44mi |
| 3401 Tully Rd Modesto, CA | 2.0 | 2.0 | 1024 | $2,095 | $2.05 | 13d | 2 | 1.49mi |
Listing history 16 events
-
2026-06-18days on market $96,000 Active 27 DOM
-
2026-06-17days on market $96,000 Active 26 DOM
-
2026-06-16days on market $96,000 Active 25 DOM
-
2026-06-15days on market $96,000 Active 24 DOM
-
2026-06-14days on market $96,000 Active 22 DOM
-
2026-06-13days on market $96,000 Active 21 DOM
-
2026-06-10days on market $96,000 Active 19 DOM
-
2026-06-09days on market $96,000 Active 18 DOM
-
2026-06-08days on market $96,000 Active 17 DOM
-
2026-06-07days on market $96,000 Active 16 DOM
-
2026-06-05days on market $96,000 Active 13 DOM
-
2026-06-03days on market $96,000 Active 12 DOM
-
2026-06-02days on market $96,000 Active 11 DOM
-
2026-06-01days on market $96,000 Active 10 DOM
-
2026-05-31days on market $96,000 Active 9 DOM
-
2026-05-30days on market $96,000 Active 8 DOM
ⓘ Source: listings_history table (triggers on properties + properties_extension) + one-shot
backfill from property_details.listing_events for pre-trigger history.
Climate risk First Street
- Flood 1/10 Low FEMA zone X (unshaded) · 0% chance over 30 yrs
- Wildfire 5/10 Major
- Heat 7/10 Severe 7 d/yr ≥102°F today · 15 d/yr by 30 yrs out
- Wind 1/10 Low
- Air quality 10/10 Extreme 28 unhealthy d/yr today · 32 by 30 yrs out
Nearby sold comps map
Loading sold comps map…
Walkable amenities ~0.75 mi
Loading nearby amenities…
Taxation est. · year 1
- Rental income
- $24,861
- − Mortgage interest
- −$5,377
- − Property taxes
- −$1,440
- − Insurance
- −$480
- − Repairs & maintenance
- −$1,989
- − Management
- −$1,989
- − Depreciation
- −$2,793
- Taxable income
- $10,793
- Est. tax owed @ 24.0%
- −$2,590
- After-tax cash flow
- $9,089/yr
For passive investors: Depreciation is non-cash, so a rental often shows a tax loss while cash-flowing — sheltering income. Rental losses are passive: they offset passive income freely, and up to $25,000/yr can offset ordinary (W-2) income if you actively participate and your MAGI is under $100k (phasing out to $0 by $150k); unused losses carry forward. On sale, claimed depreciation is recaptured at up to 25%, and gains may owe capital-gains tax (a 1031 exchange can defer both). Figures are a year-1 estimate at your 24.0% rate — not tax advice; consult a CPA.
Condition & rehab AI · 12 photos
This home is in average condition with some cosmetic updates needed. It has a good roof and HVAC system, but the kitchen and bathroom need significant updates. The home has a nice size yard and is in a quiet senior community.
Repairs flagged
- Moderate kitchen cabinets — dated and in need of updating
- Moderate kitchen countertops — dated and in need of updating
- Moderate kitchen appliances — dated and in need of updating
- Moderate bathroom fixtures — dated and in need of updating
- Minor exterior siding — moderate wear
Value-add opportunities
- Both paint interior walls — fresh paint can make a significant difference in the home's appearance
- Both replace carpeted floors — new flooring can greatly improve the home's appeal
- Both update kitchen cabinets and countertops — new cabinets and countertops can significantly enhance the home's value
- Both update kitchen appliances — new appliances can make the kitchen more functional and appealing
- Both update bathroom fixtures — new fixtures can make the bathroom more functional and appealing
Renovation cost estimate screening
| Repair item | Severity | Est. cost |
|---|---|---|
| kitchen cabinets · dated and in need of updating | Moderate | $3,000–15,000 |
| kitchen countertops · dated and in need of updating | Moderate | $3,000–15,000 |
| kitchen appliances · dated and in need of updating | Moderate | $3,000–15,000 |
| bathroom fixtures · dated and in need of updating | Moderate | $3,000–15,000 |
| exterior siding · moderate wear | Minor | $500–3,000 |
| Total estimated repair cost · 5 items | $12,500–63,000 |
Value-add ROI direction
- Both paint interior walls — fresh paint can make a significant difference in the home's appearance ↑
- Both replace carpeted floors — new flooring can greatly improve the home's appeal ↑
- Both update kitchen cabinets and countertops — new cabinets and countertops can significantly enhance the home's value ↑
- Both update kitchen appliances — new appliances can make the kitchen more functional and appealing ↑
- Both update bathroom fixtures — new fixtures can make the bathroom more functional and appealing ↑
ⓘ Cost ranges are severity-bucket heuristics (US national rule-of-thumb). Get contractor quotes + a written scope before underwriting a rehab budget.
Schools (NCES district)
- District
- Sylvan Union Elementary
- NCES district ID
- 0638670
- Math proficiency
- 44% ▲ 2.00%
- Reading proficiency
- 52% ▬ 0.00%
- Median HH income
- $61,181
- Composite
- 44.28/100
- National rank
- #6167
- State rank
- #457 of 1400 in CA
Livability — Modesto
- Score
- 63/100
- State rank
- #451
- US rank
- #15229
Category grades
Schools grade is shown separately in the Schools card above.
Census & demographics
- Census place
- Modesto, CA
- County
- Stanislaus County · 445,786 people
- City population
- 225,261
- Metro
- Modesto, CA
- Population (ZIP)
- 33,233
- Household income
- $96,886
- Rent vs Own
- Severe rent burden
- 847.0
Population outlook (Stanislaus County) Hauer SSP2
- Today (2025)
- 579,493 people
- By 2030
- 598,000 · +3.2%
- By 2040
- 630,930 · +8.9%
- By 2050
- 658,300 · +13.6%
- By 2075
- 712,363 · +22.9%
- By 2100
- 719,805 · +24.2%
Race, ethnicity, and origin ACS 2023
- Neighborhood character
- Diverse neighborhood (Simpson 0.64)
- Race & ethnicity
- White 50% Hispanic / Latino 32% Two or more races 16% Asian 9% Pacific Islander 2% Black 2% Native American 1%
- Hispanic origin (detail)
- Mexican 28%
- Common ancestry
- Russian 4% Italian 2% Iranian 2%
- Foreign-born
- 17% · Canada, China, Vietnam
- Languages at home
- 69% English-only · Spanish 15% Other Indo-European 6% Russian/Polish/Slavic 2%
Political lean MEDSL · Stanislaus
- 2024 margin
- R (+11.0) · D 43.2% · R 54.2% · Other 2.6%
- 2008→2024 swing
- -12.7pp toward R · 2008: 1.7pp · 2024: -11.0pp
- All cycles
- 2024: R+11.0 2020: D+0.8 2016: D+0.6 2012: D+0.7 2008: D+1.7
Not yet ingested
- Civics
- —
Market trends
- HPI YoY
- ▼ -374.73%
- Current HPI
- 270.6957
- Rent YoY
- ▼ -0.12%
- Metro
- Modesto, CA
- State GDP YoY
- ▲ 3.21%
- F500 in state
- 116
Industry mix (Fortune 500 HQ in CA)
| Industry | F500 HQs | Revenue |
|---|---|---|
| Technology | 27 | $1,492B |
|
||
| Financial Services | 3 | $174B |
|
||
| Retail | 3 | $44B |
|
||
| Insurance | 3 | $26B |
|
||
| Media / Entertainment | 2 | $115B |
|
||
| Pharmaceuticals / Biotech | 2 | $62B |
|
||
Cash-flow waterfall
monthlySold comps — $/sqft
last 12 mo · ≤1 miLoading sold comps…