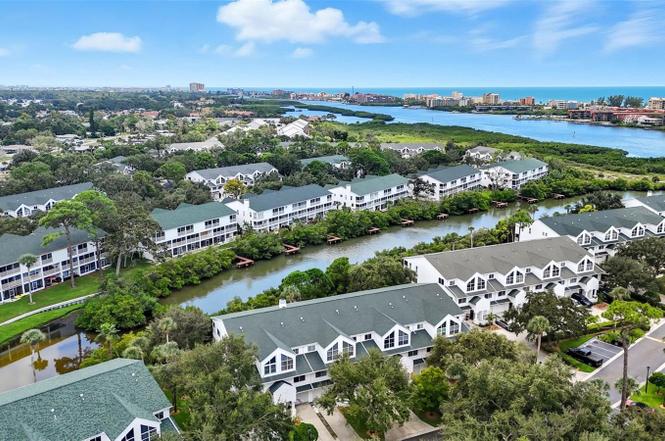
14879 Seminole Trl · Seminole, FL
Flood risk 7/10 · Major
- FEMA flood zone
- X (shaded)
- Chance of flooding over 30 yrs
- 0.76%
- Est. flood insurance / yr
- $507 – $1,088
Fire risk 1/10 · Minimal
- Est. fire insurance / yr
- $947 – $1,759
Heat risk 10/10 · Severe
- Hot days now (above 107°F)
- 7 days/yr
- Hot days in 30 yrs
- 28 days/yr
Wind risk 10/10 · Severe
- Chance of severe wind over 30 yrs
- 99.0%
Air-quality risk 3/10 · Minor
- Unhealthy air days now
- 2 days/yr
- Unhealthy air days in 30 yrs
- 3 days/yr
Risk factors via First Street. Map © Google.
Why this score? — see what drove the D grade
The composite is a weighted blend of 9 inputs, each scored 0–100. Each bar is that input's sub-score; the figure is the points it added to the 100-point composite (weight × sub-score).
- Cash flow +12.4/30.0
- ARV discount +7.5/15.0
- Livability +4.4/5.0
- Schools +4.3/10.0
- 1% rule +3.9/10.0
- DSCR +3.7/10.0
- Rent growth +2.5/5.0
- Condition / age +2.5/5.0
- Appreciation +0.0/10.0
$459,000
🖨 Deal sheet 📄 Offer letter ✓ Due diligence
Listing remarks
HOME WARRANTY INCLUDED - BRING ALL OFFERS! WELCOME TO TARA CAY SOUND NORTH VILLAGE! 2,174 sq. ft. of waterfront living with a pool, docks, AND a garage for a great price! This vibrant waterfront community offers the ultimate Florida lifestyle with frequent dolphin, manatee, and roseate spoonbill sightings, plus 10 shared community docks and three south-facing porches to enjoy sunshine year-round. Inside, the main living level features an updated kitchen with modern appliances, including a brand-new dishwasher and range (Aug 2025). Added storage at the breakfast bar and glass display cabinets provide both function and style. The open floor plan flows easily into the living and dining are
Key facts
- Open floor plan
- Waterfront living
- Updated kitchen
Tags
Property features AI
Finance
- Other: Private maintained asphalt road; Flood insurance required; Landscaped and paved lot; Homestead indicated
- Financial info: Total monthly fees $410; total annual fees $4,920; Lease restrictions apply
- HOA & community: HOA required with monthly fee of $410 (includes cable TV, pool, escrow reserves, grounds maintenance, management, recreational facilities, sewer, trash, water); Association approval required; Buyer approval required for community; Clubhouse, community mailbox, deed restrictions, pool, street lights; Pets allowed
Exterior
- Parking: Attached garage (1 car)
- Utilities: Public water; Public sewer; Cable connected; Electricity connected; Phone available; Sewer connected; Water connected; Fire hydrant nearby; Irrigation equipment
- Home design: Residential townhouse; Completed condition; Faces north; Three or more stories; Entry level: multiple levels
- Construction: Block, concrete, stucco, vinyl siding and frame construction; Shingle roof; Slab foundation; Building identified as BUILDING 17; Built on a lot in a conservation area
- Exterior features: Balcony; Exterior lighting; Sliding doors; Gunite pool; On waterfront with canal views; Canal (brackish) water access; Fishing pier; Seawall (other)
Interior
- Kitchen: Dishwasher; Microwave; Range; Refrigerator; Water softener
- Bedrooms: 3 bedrooms
- Flooring: Ceramic tile; Hardwood
- Bathrooms: 4 full bathrooms
- Heating & cooling: Central heating; Central air
- Interior features: Cathedral ceilings; Vaulted ceilings; High ceilings; Ceiling fans; Kitchen/family room combo; Living room/dining room combo; Solid surface counters; Solid wood cabinets; Thermostat; Walk-in closets; Window treatments; Blinds
- Laundry & utility: Washer hookup; Electric dryer hookup; Laundry located inside on upper level; Inside utility; Attic access; Bonus room; Media room
Neighborhood map
What this means for you Summary
Snapshot
- This is a 3-bed/4.0-bath condo listed at $459k.
Deal economics
- At list price, monthly cash flow is $-144 ($-2k/yr) — negative.
- To cash-flow at today's rent, offer at most $433k (5.6% below list).
- To meet the 1% rule (rent ≥ 1% of price), the offer needs to be $408k (11.2% below list).
- Recommended offer: $404k (12.0% below list) — sets the bar for market timing.
- Cap rate 6.1% vs local median 3.8% in Seminole — top-decile yield for the area; either an underpriced asset or a hidden risk that comps aren't pricing in. Stress-test before assuming the spread holds.
Location & tenants
- Location reads 88/100 on livability (#5 in FL, #174 nationally) — a professional / high-income tenant draw. Strengths: commute A+, housing A+, health & safety A+.
- Pinellas (suburban): math 51% / reading 51% proficiency, ranked #31 of 73 in FL (top 42%) — acceptable for families but not a draw, mixed tenant base, ~2y average lease.
- Market conditions: 146 active listings in the ZIP; 14 comparable units currently listed for rent nearby; rentals at typical pace (median 20d on market — plan ~3-4 weeks tenant-placement turnaround); 2,676 units permitted in Pinellas County in 2024 (1,422 in 5+ unit buildings).
Forward outlook
- Local home prices are declining (-3.0%/yr); year-one equity from $3k of loan paydown is wiped out by about $14k of value loss. Plan a longer hold.
- Pinellas County population projected at +14% by 2050 — modest demand growth; plan on rents tracking national, not racing it.
Negotiation context
- It's been on market 271 days — a 12% lower offer ($404k) is reasonable based on typical stale-listing flexibility.
- 2 sale attempts; this cycle's ask has dropped $71k (13%) from the opening price — seller is motivated, your offer sets the floor, not the list.
Risks & watch-outs
- Watch-outs: flood insurance adds $66/mo.
- Climate carrying-cost: major flood risk; severe wind risk, 99% chance of damaging wind over 30y; extreme-heat days projected 7→28/yr by 2055 (HVAC capex compounding) — expect insurance premiums to compound above CPI over the hold.
Questions for the listing agent
- What do current leases actually rent for vs. the listed asking? Can we see a recent rent roll and the last 12 months of T-12 income?
- It's been on market 271 days. Have you received any prior offers? Is the seller open to a 12% concession, seller financing, or rate buy-down credit?
- What's the actual annual flood-insurance premium (NFIP or private), and is the property in a SFHA with mandatory coverage?
- What does the HOA fee cover, when was the last increase, and are there any pending special assessments or reserve-fund shortfalls?
- Any open or pending special assessments — roof, HVAC, plumbing, elevator, façade? What's the per-unit balance and payoff schedule, and is the seller paying it off at close or rolling it to the buyer?
- Why hasn't it sold? Are there any deal-killer items the seller is aware of (foundation, flood, title, zoning, code violations)?
- Is there a deadline driving the sale (1031 exchange, divorce, estate, relocation)? That informs how much negotiation room exists.
- Schools are B-rated — typically a magnet for longer-tenancy family renters. What's the average tenant stay here, and is there a school-zone premium baked into asking?
- The area grade is low — what's the realistic commute time and amenity access for the typical tenant pool here? Any planned neighborhood developments (good or bad) we should know about?
- What's the average days-on-market for RENTAL listings here right now (not sales)? A rising rental-DOM trend means longer vacancies and softer asking-rent achievability than the comps imply.
- What's the recent tenant-quality profile in this submarket — average credit score on applications, eviction rate, late-payment / NSF rate, and stable-employment percentage? A property-management company in the area should have these aggregated.
- How much new apartment / multifamily construction is in the pipeline within 1–3 miles? Heavy new supply (>2% of stock underway) typically softens rents 12–24 months out; light construction supports rent growth.
Investment metrics
- 1% rule
- 0.89% ✗
- Cap rate
- 6.09%
- Cash-on-cash
- -0.73%
- DSCR
- 0.97
- GRM
- 9.4
CMA / ARV
No comps found within radius.
Projected returns pro-forma
-3.0% appreciation · 3.0% rent growth · sell at horizon
- IRR
- -18.5%
- Equity multiple
- 0.35×
- Total profit
- $-83,398
- Equity at exit
- $68,438
- IRR
- -10.8%
- Equity multiple
- 0.35×
- Total profit
- $-83,737
- Equity at exit
- $39,686
Cash invested: $128,520 (down + closing). Projections, not guarantees.
Landlord ↔ Tenant lean methodology
- Overall (STATE)
- 87 Strongly Landlord-Friendly
- State Florida
- 87 Strongly Landlord-Friendly · R+3
- County
- — inherits STATE
- City
- — inherits STATE
ZIP-level market 33776
- Active inventory
- 146
- Price-to-rent
- 9.4×
Monthly cashflow live
- Estimated rent
- $4,077 high interval (Pro) →
- Mortgage (P&I)
- −$2,407
- Tax from tax record
- −$290 /mo · $3,486/yr
- Insurance
- −$191
- Flood insurance flood zone
- −$66 /mo · $798/yr
- HOA
- −$410
- Vacancy / Maint / Mgmt
- −$856
- Net cashflow
- $-144
Break-even live
UW: 25.0% down · 7.5% · 30yr · 1.5% tax · 5.0% vac · 8.0% maint · 8.0% mgmt
Financing live
Cash to close
- Down payment
- $114,750
- Closing costs
- $13,770
- Reserves months
- —
- Total cash needed
- —
Loan-product check · same deal, 3 products live
Conventional
25% down · 7.5% · 30yr
- Down + closing
- —
- Monthly P&I
- —
- Monthly cashflow
- —
- DSCR
- —
- Eligible?
- —
Personal DTI + credit; lowest rate.
DSCR
20% down · 8.5% · 30yr
- Down + closing
- —
- Monthly P&I
- —
- Monthly cashflow
- —
- DSCR
- —
- Eligible?
- —
No personal income docs; deal must DSCR.
Hard money
10% down · 12.0% · 12mo
- Down + closing
- —
- Monthly P&I
- —
- Monthly cashflow
- —
- DSCR
- —
- Eligible?
- —
Short-term bridge; refi at stabilization.
Rent comps 14 comps
| Address | Beds | Baths | Sqft | Rent | $/sqft | DOM | Units | Dist |
|---|---|---|---|---|---|---|---|---|
| 9794 Indian Key Trl Unit 90 Seminole, FL | 4.0 | 4.0 | 2174 | $3,650 | $1.68 | 24d | 1 | 0.17mi |
| 9614 Tara Cay Ct Seminole, FL | 4.0 | 4.0 | 2100 | $2,850 | $1.36 | 20d | 1 | 0.22mi |
| 19829 Gulf Blvd Indian Shores, FL | 2.0 | 2.0 | 1400 | $3,350 | $2.39 | 7d | 1 | 0.36mi |
| 9652 Commodore Dr Seminole, FL | 3.0 | 2.0 | 1680 | $2,800 | $1.67 | 10d | 1 | 0.37mi |
| 19646 Gulf Blvd #3 Indian Shores, FL | 4.0 | 2.0 | 1600 | $2,975 | $1.86 | 24d | 1 | 0.57mi |
| 14623 Sunset Dr Largo, FL | 3.0 | 2.0 | 1621 | $2,545 | $1.57 | 4d | 1 | 0.59mi |
| 14414 91st Ave Seminole, FL | 3.0 | 2.5 | 2083 | $8,000 | $3.84 | 24d | 1 | 0.65mi |
| 9262 140th Ln Seminole, FL | 2.0 | 2.0 | 1402 | $4,500 | $3.21 | 4d | 1 | 0.69mi |
| 13964 106th Ave Largo, FL | 3.0 | 2.0 | 2281 | $3,500 | $1.53 | 24d | 1 | 0.73mi |
| 19505 Gulf Blvd #304 Indian Shores, FL | 4.0 | 2.5 | 2388 | $15,000 | $6.28 | 4d | 1 | 0.87mi |
| 11290 142nd St Largo, FL | 4.0 | 2.0 | 2268 | $4,550 | $2.01 | 4d | 1 | 0.91mi |
| 13607 101st Ter Seminole, FL | 2.0 | 2.0 | 1503 | $3,850 | $2.56 | 4d | 1 | 0.92mi |
| 14323 83rd Pl N Unit 1471180P Seminole, FL | 4.0 | 3.0 | 2895 | $13,452 | $4.65 | 21d | 1 | 1.07mi |
| 19138 Whispering Pines Dr Indian Shores, FL | 4.0 | 3.0 | 2424 | $8,000 | $3.30 | 24d | 1 | 1.25mi |
HOA detail condo
- Monthly dues
- $410 · $4,920/yr
- Likely covers
- waterpool
- Assessments
- None detected in remarks — confirm with the listing agent.
Listing history 20 events
-
2026-06-18days on market $459,000 Active 271 DOM
-
2026-06-17days on market $459,000 Active 270 DOM
-
2026-06-16days on market $459,000 Active 269 DOM
-
2026-06-15pricedays on market $459,000 Active 268 DOM
-
2026-06-13remarks 699-char remark
-
2026-06-13days on market $489,900 Active 266 DOM
-
2026-06-09days on market $489,900 Active 262 DOM
-
2026-06-08days on market $489,900 Active 261 DOM
-
2026-06-07days on market $489,900 Active 260 DOM
-
2026-06-04days on market $489,900 Active 257 DOM
-
2026-06-03days on market $489,900 Active 256 DOM
-
2026-06-01days on market $489,900 Active 254 DOM
-
2026-05-31days on market $489,900 Active 253 DOM
-
2026-03-14price $489,900
-
2026-03-06price $509,900
-
2026-01-17price $515,000
-
2026-01-06status Active
-
2026-01-05status Pending
-
2025-10-24price $519,000
-
2025-09-19$530,000 Active
ⓘ Source: listings_history table (triggers on properties + properties_extension) + one-shot
backfill from property_details.listing_events for pre-trigger history.
Tax reassessment forecast FL · Resets to sale price
- Current annual tax
- $3,486 · $290/mo
- Projected year-2 tax
- $3,810 · $317/mo
- Expected delta
- +$324/yr (+$27/mo · 9.3%)
ⓘ Screening estimate from a state-policy table — verify with the county assessor before closing.
Climate risk First Street
- Flood 7/10 Severe FEMA zone X (shaded) · 76% chance over 30 yrs
- Wildfire 1/10 Low
- Heat 10/10 Extreme 7 d/yr ≥107°F today · 28 d/yr by 30 yrs out
- Wind 10/10 Extreme 99% chance of damaging wind over 30 yrs
- Air quality 3/10 Moderate 2 unhealthy d/yr today · 3 by 30 yrs out
Nearby sold comps map
Loading sold comps map…
Walkable amenities ~0.75 mi
Loading nearby amenities…
Taxation est. · year 1
- Rental income
- $48,923
- − Mortgage interest
- −$25,711
- − Property taxes
- −$3,486
- − Insurance
- −$3,092
- − Repairs & maintenance
- −$3,914
- − Management
- −$3,914
- − HOA
- −$4,920
- − Depreciation
- −$13,353
- Taxable loss
- −$9,467
- Est. tax savings @ 24.0%
- +$2,272
- After-tax cash flow
- $538/yr
For passive investors: Depreciation is non-cash, so a rental often shows a tax loss while cash-flowing — sheltering income. Rental losses are passive: they offset passive income freely, and up to $25,000/yr can offset ordinary (W-2) income if you actively participate and your MAGI is under $100k (phasing out to $0 by $150k); unused losses carry forward. On sale, claimed depreciation is recaptured at up to 25%, and gains may owe capital-gains tax (a 1031 exchange can defer both). Figures are a year-1 estimate at your 24.0% rate — not tax advice; consult a CPA.
Schools (NCES district)
- District
- Pinellas
- NCES district ID
- 1201560
- Math proficiency
- 51% ▼ -5.00%
- Reading proficiency
- 51% ▼ -3.00%
- Median HH income
- $46,270
- Composite
- 43.27/100
- National rank
- #3046
- State rank
- #31 of 73 in FL
Livability — Seminole
- Score
- 88/100
- State rank
- #5
- US rank
- #174
Category grades
Schools grade is shown separately in the Schools card above.
Census & demographics
- City population
- 42,315
- Population (ZIP)
- 12,711
Population outlook (Pinellas County) Hauer SSP2
- Today (2025)
- 1,027,532 people
- By 2030
- 1,063,586 · +3.5%
- By 2040
- 1,125,020 · +9.5%
- By 2050
- 1,168,637 · +13.7%
- By 2075
- 1,265,188 · +23.1%
- By 2100
- 1,260,357 · +22.7%
Race, ethnicity, and origin ACS 2023
- Neighborhood character
- Predominantly White (84%)
- Race & ethnicity
- White 84% Hispanic / Latino 7% Two or more races 7% Asian 2% Black 2%
- Hispanic origin (detail)
- Mexican 3%
- Common ancestry
- Romanian 7% Lithuanian 3% Slovak 1%
- Foreign-born
- 9% · Canada, Jamaica
- Languages at home
- 89% English-only · Other Indo-European 4% Russian/Polish/Slavic 3% Spanish 2%
Political lean MEDSL · Pinellas
- 2024 margin
- Lean R (+5.2) · D 46.9% · R 52.1%
- 2008→2024 swing
- -13.5pp toward R · 2008: 8.3pp · 2024: -5.2pp
- All cycles
- 2024: R+5.2 2020: D+0.2 2016: R+1.1 2012: D+5.6 2008: D+8.3
Not yet ingested
- Civics
- —
Market trends
- HPI YoY
- ▼ -455.42%
- Current HPI
- 337.3149
- Rent YoY
- —
- Metro
- —
- State GDP YoY
- ▲ 3.28%
- F500 in state
- 36
Industry mix (Fortune 500 HQ in FL)
| Industry | F500 HQs | Revenue |
|---|---|---|
| Industrial Technology | 2 | $29B |
|
||
| Insurance | 2 | $17B |
|
||
| Retail | 1 | $60B |
|
||
| Technology Distribution | 1 | $58B |
|
||
| Homebuilding | 1 | $35B |
|
||
| Technology Manufacturing | 1 | $35B |
|
||
Price history
-7.6% since first listed7 events — show timeline
- 2026-03-14 Price Changed $489,900 Stellar MLS as Distributed by MLS Grid
- 2026-03-06 Price Changed $509,900 Stellar MLS as Distributed by MLS Grid
- 2026-01-17 Price Changed $515,000 Stellar MLS as Distributed by MLS Grid
- 2026-01-06 Relisted — Stellar MLS as Distributed by MLS Grid
- 2026-01-05 Pending — Stellar MLS as Distributed by MLS Grid
- 2025-10-24 Price Changed $519,000 Stellar MLS as Distributed by MLS Grid
- 2025-09-19 Listed $530,000 Stellar MLS as Distributed by MLS Grid
Property tax history
+0.7%/yrLatest (2025): $3,486 · +5.5% YoY. Source: county tax records.
Cash-flow waterfall
monthlySold comps — $/sqft
last 12 mo · ≤1 miLoading sold comps…