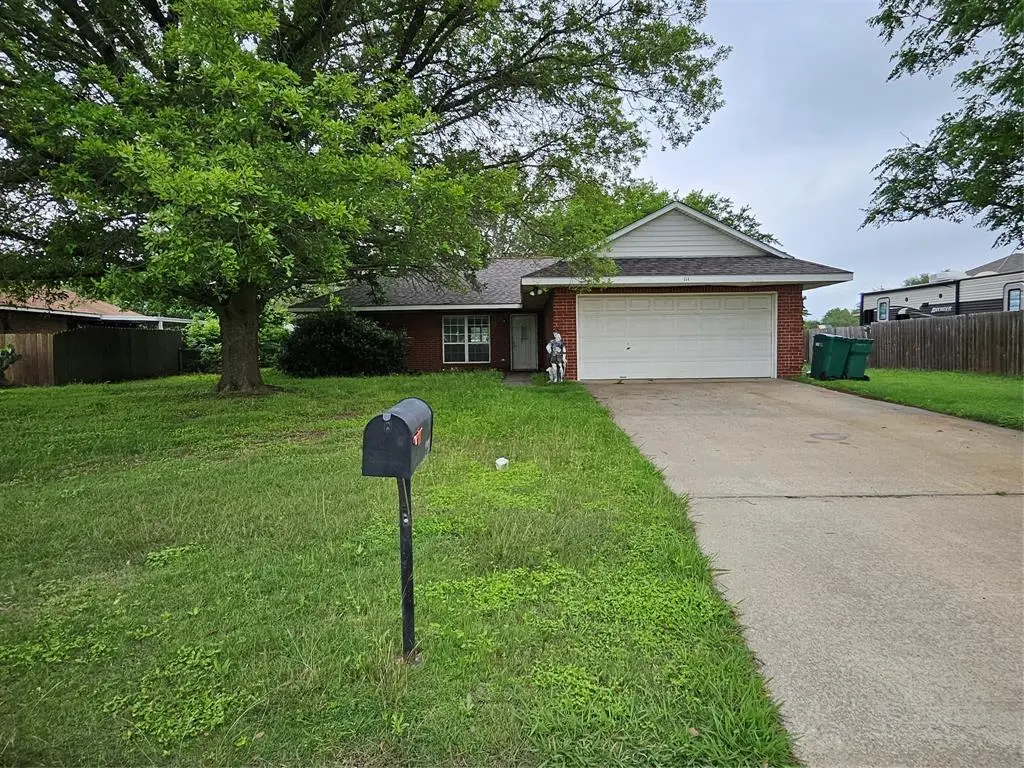
114 Silver Fox · Lacy-Lakeview, TX
Flood risk 1/10 · Minimal
- FEMA flood zone
- X (unshaded)
- Chance of flooding over 30 yrs
- 0.0%
- Est. flood insurance / yr
- $507 – $1,088
Fire risk 5/10 · Moderate
- Est. fire insurance / yr
- $1,222 – $2,270
Heat risk 7/10 · Major
- Hot days now (above 110°F)
- 7 days/yr
- Hot days in 30 yrs
- 25 days/yr
Wind risk 6/10 · Moderate
- Chance of severe wind over 30 yrs
- 61.0%
Air-quality risk 2/10 · Minimal
- Unhealthy air days now
- 0 days/yr
- Unhealthy air days in 30 yrs
- 1 days/yr
Risk factors via First Street. Map © Google.
Why this score? — see what drove the D+ grade
The composite is a weighted blend of 9 inputs, each scored 0–100. Each bar is that input's sub-score; the figure is the points it added to the 100-point composite (weight × sub-score).
- Cash flow +16.2/30.0
- ARV discount +13.5/15.0
- DSCR +5.0/10.0
- 1% rule +4.4/10.0
- Rent growth +3.1/5.0
- Livability +2.5/5.0
- Condition / age +2.5/5.0
- Schools +1.7/10.0
- Appreciation +0.0/10.0
$196,000
🖨 Deal sheet 📄 Offer letter ✓ Due diligence
Listing remarks
Tucked away on the east side of Lacy Lakeview, this 3-bedroom, 1.5-bath home sits on a generously sized lot surrounded by mature trees, offering both space and privacy. Inside, you’ll find a layout full of potential—ready for your personal touch and style to truly make it your own. Whether you’re a first-time buyer, investor, or someone looking for a place to customize, this property is a great opportunity to create something special in a peaceful setting. New sewer line on the west side of the house from the full bathroom to the street in 2025 New sewer line under the half bath in 2026 New roof in 2023
Key facts
- Generously sized lot
- Peaceful setting
- Mature trees
Tags
Property features AI
Finance
- Other: Lot is approximately 0.28 acres; Directions: I35 East. Exit Crest-Craven. Go east. Turn left on Mesquite Tree Rd. Turn right on Silver Fox. 114 is the second house from the end, on the left.
- Financial info: Listing terms include Cash, Conventional, FHA-203K, Other
- HOA & community: No homeowners association
Exterior
- Parking: Attached garage; 2 covered garage spaces; Driveway; Concrete surfaces; Garage door opener; Garage faces front
- Utilities: City water with individual water meter; City sewer; Electricity available; Municipal utility district: no
- Home design: Single family residence; Residential property; One story; Property in Comanche Creek subdivision
- Construction: Brick construction; Shingle roof; Slab foundation; Built in 1994
- Exterior features: Large backyard with grass; Many trees; Chain link fencing; Curbs
Interior
- Kitchen: Breakfast bar; Pantry; Electric cooktop; Electric oven; Electric range
- Bedrooms: 3 bedrooms (all on main level); Primary bedroom with walk-in closet
- Flooring: Carpet; Linoleum
- Bathrooms: 1 full bathroom; 1 half bathroom (2 total bathrooms)
- Heating & cooling: Central heating; Central air; Ceiling fan(s)
- Interior features: Pantry; Walk-in closet(s); 6 total rooms; One-level floorplan; 1 living area; 1 dining area
- Laundry & utility: Washer hookup; Electric dryer hookup; Laundry area in garage; Electric water heater
Neighborhood map
What this means for you Summary
Snapshot
- This is a 3-bed/1.5-bath single-family listed at $196k.
Deal economics
- At list price, monthly cash flow is $104 ($1k/yr) — positive.
- The deal already cash-flows at list — no discount required.
- To meet the 1% rule (rent ≥ 1% of price), the offer needs to be $185k (5.6% below list).
- Recommended offer: $185k (5.6% below list) — sets the bar for 1% rule.
- Cap rate 6.9% vs local median 5.1% in Lacy-Lakeview — top-decile yield for the area; either an underpriced asset or a hidden risk that comps aren't pricing in. Stress-test before assuming the spread holds.
Location & tenants
- Location reads: area grade D — affects rentability + tenant quality, not the cash-flow math above.
- Connally ISD (suburban): math 16% / reading 25% proficiency, ranked #781 of 826 in TX (top 95%) — low school quality limits family demand, transient renter base, plan for 1-2y turnover; 68% free/reduced lunch — lower-income household profile, screen leases tightly.
- Zoned schools: Connally El (math 13% / reading 22%, grade F, #3,805 of 4,322 statewide, top 89%, 374 students, 87% FRL) — zoned schools average 87% FRL vs 68% district-wide (19 pts higher); higher-poverty schools than district average — tighter screening recommended.
- Market conditions: Rents rising (+2.2%/yr); 297 active listings in the ZIP; 3 comparable units currently listed for rent nearby; rentals leasing fast (median 14d on market — plan ~1-2 weeks tenant-placement turnaround); 1,014 units permitted in McLennan County in 2024 (200 in 5+ unit buildings).
- This rent runs 38% of the median local income ($58k/yr) — at the standard rent-burdened threshold; future hikes will face affordability resistance.
Forward outlook
- Local home prices are declining (-3.0%/yr); year-one equity from $1k of loan paydown is wiped out by about $6k of value loss. Plan a longer hold.
- McLennan County population projected at +17% by 2050 — long-run rental-demand tailwind backs the buy-and-hold thesis.
Negotiation context
- It's been on market 54 days — a 3% lower offer ($190k) is reasonable based on typical stale-listing flexibility.
Risks & watch-outs
- Climate carrying-cost: major wind risk, 61% chance of damaging wind over 30y; moderate wildfire risk; extreme-heat days projected 7→25/yr by 2055 (HVAC capex compounding) — expect insurance premiums to compound above CPI over the hold.
Questions for the listing agent
- It's been on market 54 days. Have you received any prior offers? Is the seller open to a 6% concession, seller financing, or rate buy-down credit?
- Is there a deadline driving the sale (1031 exchange, divorce, estate, relocation)? That informs how much negotiation room exists.
- The area grade is low — what's the realistic commute time and amenity access for the typical tenant pool here? Any planned neighborhood developments (good or bad) we should know about?
- What's the average days-on-market for RENTAL listings here right now (not sales)? A rising rental-DOM trend means longer vacancies and softer asking-rent achievability than the comps imply.
- What's the recent tenant-quality profile in this submarket — average credit score on applications, eviction rate, late-payment / NSF rate, and stable-employment percentage? A property-management company in the area should have these aggregated.
- How much new for-sale + rental construction is in the pipeline within 1–3 miles? Heavy new supply typically softens prices + rents 12–24 months out; constrained supply supports both.
Investment metrics
- 1% rule
- 0.94% ✗
- Cap rate
- 6.93%
- Cash-on-cash
- 2.27%
- DSCR
- 1.10
- GRM
- 8.8
CMA / ARV
- ARV (median comp)
- $226,059
- List price
- $196,000
- Delta
- -13.30%
- Verdict
- UNDERPRICED
- Comps
- 20 within 1.0 mi
Show comp detail 11 sales within ~0.75 mi
| Address | Dist | Beds/Ba | Sqft | Sold | Price | $/sf | Match |
|---|---|---|---|---|---|---|---|
| 113 Bobcat Dr | 0.13mi | 3/2.0 | 1,206 (+6%) | 2mo | $225,000 | $187 | 80 |
| 204 Hawk Rdg | 0.24mi | 3/2.0 | 1,216 (+7%) | 1mo | $225,000 | $185 | 74 |
| 118 Bobcat Dr | 0.10mi | 3/2.0 | 1,158 (+2%) | 20mo | $225,000 | $194 | 73 |
| 211 Broken Arrow Dr | 0.36mi | 3/2.0 | 1,145 (+1%) | 9mo | $235,000 | $205 | 72 |
| 116 Soaring Eagle | 0.07mi | 3/1.5 | 1,087 (-4%) | 24mo | $200,000 | $184 | 70 |
| 202 Wildcat Dr | 0.35mi | 3/2.0 | 1,215 (+7%) | 1mo | $195,000 | $160 | 69 |
| 140 Shirley Dr | 0.54mi | 3/1.0 | 1,121 (-1%) | 10mo | $200,000 | $178 | 62 |
| 132 Tomahawk Dr | 0.21mi | 3/2.0 | 1,257 (+11%) | 10mo | $237,000 | $189 | 62 |
| 403 Broken Arrow Ct | 0.32mi | 3/2.0 | 1,178 (+4%) | 19mo | $229,900 | $195 | 61 |
| 203 Faye St | 0.40mi | 3/2.0 | 1,266 (+11%) | 9mo | $189,900 | $150 | 53 |
| 220 Shirley Dr | 0.55mi | 3/1.5 | 1,271 (+12%) | 15mo | $145,000 | $114 | 42 |
Match score weights: distance 35% · size 25% · config 20% · recency 20%. Top-matched comps best support the ARV.
Projected returns pro-forma
-3.0% appreciation · 2.2% rent growth · sell at horizon
- IRR
- -13.6%
- Equity multiple
- 0.52×
- Total profit
- $-26,608
- Equity at exit
- $29,224
- IRR
- -6.0%
- Equity multiple
- 0.63×
- Total profit
- $-20,515
- Equity at exit
- $16,946
Cash invested: $54,880 (down + closing). Projections, not guarantees.
Landlord ↔ Tenant lean methodology
- Overall (STATE)
- 87 Strongly Landlord-Friendly
- State Texas
- 87 Strongly Landlord-Friendly · R+5
- County
- — inherits STATE
- City
- — inherits STATE
ZIP-level market 76705
- Home prices YoY
- -29.6%
- Rents YoY
- 2.2%
- Active inventory
- 297
- Price-to-rent
- 8.8×
Monthly cashflow live
- Estimated rent
- $1,849 medium interval (Pro) →
- Mortgage (P&I)
- −$1,028
- Tax from tax record
- −$248 /mo · $2,975/yr
- Insurance
- −$82
- HOA
- −$0
- Vacancy / Maint / Mgmt
- −$388
- Net cashflow
- $104
Break-even live
UW: 25.0% down · 7.5% · 30yr · 1.5% tax · 5.0% vac · 8.0% maint · 8.0% mgmt
Financing live
Cash to close
- Down payment
- $49,000
- Closing costs
- $5,880
- Reserves months
- —
- Total cash needed
- —
Loan-product check · same deal, 3 products live
Conventional
25% down · 7.5% · 30yr
- Down + closing
- —
- Monthly P&I
- —
- Monthly cashflow
- —
- DSCR
- —
- Eligible?
- —
Personal DTI + credit; lowest rate.
DSCR
20% down · 8.5% · 30yr
- Down + closing
- —
- Monthly P&I
- —
- Monthly cashflow
- —
- DSCR
- —
- Eligible?
- —
No personal income docs; deal must DSCR.
Hard money
10% down · 12.0% · 12mo
- Down + closing
- —
- Monthly P&I
- —
- Monthly cashflow
- —
- DSCR
- —
- Eligible?
- —
Short-term bridge; refi at stabilization.
Rent comps 3 comps
| Address | Beds | Baths | Sqft | Rent | $/sqft | DOM | Units | Dist |
|---|---|---|---|---|---|---|---|---|
| 305 Shirley Dr Lacy Lakeview, TX | 3.0 | 2.0 | 1100 | $1,525 | $1.39 | 13d | 1 | 0.57mi |
| 1180 Mesquite Tree Rd Waco, TX | 2.0 | 2.0 | 1000 | $2,950 | $2.95 | 13d | 1 | 0.85mi |
| 320 S Rita St Waco, TX | 3.0 | 1.0 | 1040 | $1,600 | $1.54 | 13d | 1 | 1.28mi |
Listing history 18 events
-
2026-06-18days on market $196,000 Active 54 DOM
-
2026-06-17days on market $196,000 Active 53 DOM
-
2026-06-16days on market $196,000 Active 52 DOM
-
2026-06-15days on market $196,000 Active 51 DOM
-
2026-06-14days on market $196,000 Active 49 DOM
-
2026-06-13days on market $196,000 Active 48 DOM
-
2026-06-10days on market $196,000 Active 46 DOM
-
2026-06-09days on market $196,000 Active 45 DOM
-
2026-06-08days on market $196,000 Active 44 DOM
-
2026-06-07days on market $196,000 Active 43 DOM
-
2026-06-05days on market $196,000 Active 40 DOM
-
2026-06-02days on market $196,000 Active 38 DOM
-
2026-06-01days on market $196,000 Active 37 DOM
-
2026-05-31days on market $196,000 Active 36 DOM
-
2026-05-30days on market $196,000 Active 35 DOM
-
2026-04-24$210,000 Active 634-char remark
-
2015-08-20soldstatus
-
1994-11-04soldstatus
ⓘ Source: listings_history table (triggers on properties + properties_extension) + one-shot
backfill from property_details.listing_events for pre-trigger history.
Tax reassessment forecast TX · Resets to sale price
- Current annual tax
- $2,975 · $248/mo
- Projected year-2 tax
- $3,587 · $299/mo
- Expected delta
- +$612/yr (+$51/mo · 20.6%)
ⓘ Screening estimate from a state-policy table — verify with the county assessor before closing.
Climate risk First Street
- Flood 1/10 Low FEMA zone X (unshaded) · 0% chance over 30 yrs
- Wildfire 5/10 Major
- Heat 7/10 Severe 7 d/yr ≥110°F today · 25 d/yr by 30 yrs out
- Wind 6/10 Major 61% chance of damaging wind over 30 yrs
- Air quality 2/10 Low 0 unhealthy d/yr today · 1 by 30 yrs out
Nearby sold comps map
Loading sold comps map…
Walkable amenities ~0.75 mi
Loading nearby amenities…
Taxation est. · year 1
- Rental income
- $22,193
- − Mortgage interest
- −$10,979
- − Property taxes
- −$2,975
- − Insurance
- −$980
- − Repairs & maintenance
- −$1,775
- − Management
- −$1,775
- − Depreciation
- −$5,702
- Taxable loss
- −$1,994
- Est. tax savings @ 24.0%
- +$478
- After-tax cash flow
- $1,722/yr
For passive investors: Depreciation is non-cash, so a rental often shows a tax loss while cash-flowing — sheltering income. Rental losses are passive: they offset passive income freely, and up to $25,000/yr can offset ordinary (W-2) income if you actively participate and your MAGI is under $100k (phasing out to $0 by $150k); unused losses carry forward. On sale, claimed depreciation is recaptured at up to 25%, and gains may owe capital-gains tax (a 1031 exchange can defer both). Figures are a year-1 estimate at your 24.0% rate — not tax advice; consult a CPA.
Schools (NCES district)
- District
- Connally ISD
- NCES district ID
- 4814970
- Math proficiency
- 16% ▼ -10.00%
- Reading proficiency
- 25% ▼ -5.00%
- Median HH income
- $35,388
- Composite
- 16.9/100
- National rank
- #9141
- State rank
- #781 of 826 in TX
Livability — Lacy-Lakeview
No livability data for this city. (Only ~50 U.S. cities are tracked.)
Census & demographics
- Census place
- Lacy-Lakeview, TX
- County
- McLennan County · 213,088 people
- City population
- 31,616
- Metro
- Waco, TX
- Population (ZIP)
- 31,616
- Household income
- $58,236
- Rent vs Own
- Severe rent burden
- 668.0
Population outlook (McLennan County) Hauer SSP2
- Today (2025)
- 264,191 people
- By 2030
- 273,578 · +3.6%
- By 2040
- 291,506 · +10.3%
- By 2050
- 308,044 · +16.6%
- By 2075
- 349,648 · +32.3%
- By 2100
- 364,779 · +38.1%
Race, ethnicity, and origin ACS 2023
- Neighborhood character
- Diverse neighborhood (Simpson 0.68)
- Race & ethnicity
- White 43% Hispanic / Latino 32% Two or more races 20% Black 18% Native American 1% Asian 1%
- Hispanic origin (detail)
- Mexican 31%
- Common ancestry
- Slovak 2% Lithuanian 1% Serbian 1%
- Foreign-born
- 13% · Canada, Vietnam
- Languages at home
- 73% English-only · Spanish 24% Other Indo-European 1% German/W. Germanic 1%
Political lean MEDSL · McLennan
- 2024 margin
- Solid R (+30.9) · D 34.0% · R 64.9% · Other 1.0%
- 2008→2024 swing
- -7.0pp toward R · 2008: -23.9pp · 2024: -30.9pp
- All cycles
- 2024: R+30.9 2020: R+23.4 2016: R+27.1 2012: R+29.8 2008: R+23.9
Not yet ingested
- Civics
- —
Market trends
- HPI YoY
- ▼ -91.45%
- Current HPI
- 217.9429
- Rent YoY
- ▲ 2.20%
- Metro
- Waco, TX
- State GDP YoY
- ▲ 3.95%
- F500 in state
- 110
Industry mix (Fortune 500 HQ in TX)
| Industry | F500 HQs | Revenue |
|---|---|---|
| Energy | 16 | $1,198B |
|
||
| Technology | 5 | $198B |
|
||
| Engineering / Construction | 4 | $72B |
|
||
| Energy Services | 3 | $60B |
|
||
| Utilities | 3 | $41B |
|
||
| Healthcare | 2 | $330B |
|
||
Price history
-6.7% since first listed4 events — show timeline
- 2026-05-20 Price Changed $196,000 NTREIS
- 2026-04-24 Listed $210,000 NTREIS
- 2015-08-20 Sold (Public Records) — Public Records
- 1994-11-04 Sold (Public Records) — Public Records
Property tax history
+3.0%/yrLatest (2025): $2,975 · +0.8% YoY. Source: county tax records.
Cash-flow waterfall
monthlySold comps — $/sqft
last 12 mo · ≤1 miLoading sold comps…