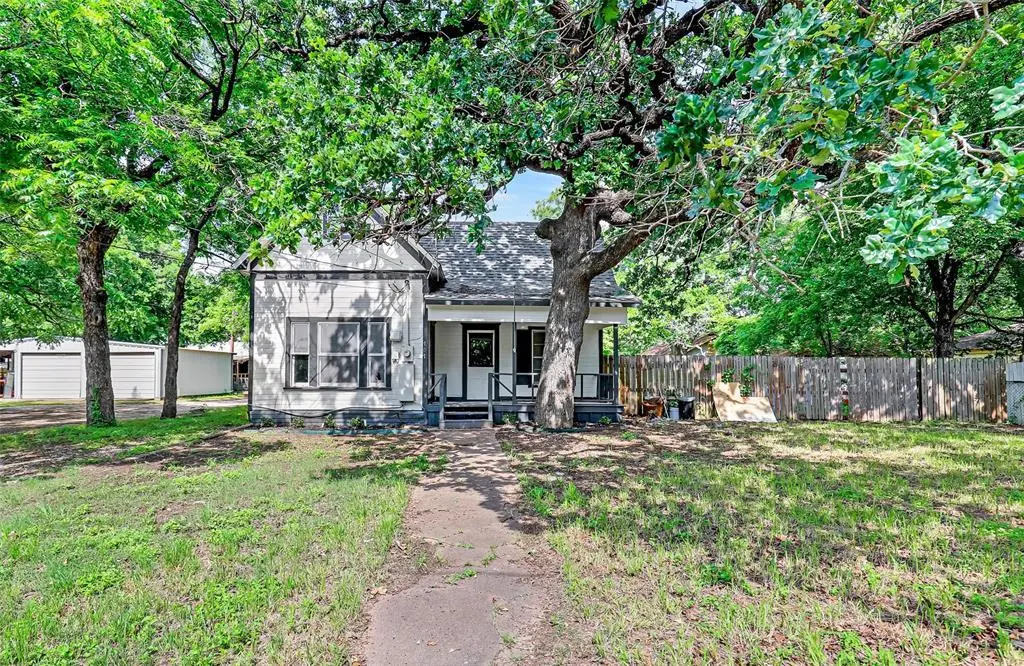
707 S Robinson St · Cleburne, TX
Flood risk 1/10 · Minimal
- FEMA flood zone
- X (unshaded)
- Chance of flooding over 30 yrs
- 0.0%
- Est. flood insurance / yr
- $507 – $1,088
Fire risk 5/10 · Moderate
- Est. fire insurance / yr
- $1,222 – $2,270
Heat risk 7/10 · Major
- Hot days now (above 109°F)
- 7 days/yr
- Hot days in 30 yrs
- 23 days/yr
Wind risk 6/10 · Moderate
- Chance of severe wind over 30 yrs
- 27.0%
Air-quality risk 2/10 · Minimal
- Unhealthy air days now
- 1 days/yr
- Unhealthy air days in 30 yrs
- 2 days/yr
Risk factors via First Street. Map © Google.
Why this score? — see what drove the C- grade
The composite is a weighted blend of 9 inputs, each scored 0–100. Each bar is that input's sub-score; the figure is the points it added to the 100-point composite (weight × sub-score).
- Cash flow +17.9/30.0
- ARV discount +14.8/15.0
- DSCR +5.6/10.0
- 1% rule +4.4/10.0
- Livability +3.4/5.0
- Schools +2.9/10.0
- Rent growth +2.5/5.0
- Condition / age +2.5/5.0
- Appreciation +0.0/10.0
$169,000
🖨 Deal sheet (PDF) 📄 Offer letter ✓ Due diligence
Listing remarks MLS
MOTIVATED SELLER. Bring your offer. Beautiful 2 Bed 1.5 bath home with stainless steel appliance. Fully renovated with new floor and paint. Brand new bathrooms and kitchen with accent backsplash. The house boast a high ceiling all over with open and spacious floorplan. Nice front porch overlooking a grand tree that provides awesome shade. It has a brand new 30yr roof. A huge backyard with metal framing for car port. It is a must see and make it as your home.
Key facts
- Fully renovated
- New kitchen
- New bathrooms
Tags
Neighborhood map
What this means for you Summary
Snapshot
- This is a 3-bed/1.0-bath single-family listed at $169k.
Deal economics
- At list price, monthly cash flow is $142 ($2k/yr) — positive.
- The deal already cash-flows at list — no discount required.
- To meet the 1% rule (rent ≥ 1% of price), the offer needs to be $159k (6.1% below list).
- Recommended offer: $149k (12.0% below list) — sets the bar for market timing.
- Cap rate 7.3% vs local median 3.6% in Cleburne — top-decile yield for the area; either an underpriced asset or a hidden risk that comps aren't pricing in. Stress-test before assuming the spread holds.
Location & tenants
- Location reads 68/100 on livability (#460 in TX) — a middle-class / working-renter tenant base. Strengths: cost of living A+, housing A+, health & safety A+; Watch: employment C-, amenities F, commute F.
- Cleburne ISD (town): math 34% / reading 33% proficiency, ranked #537 of 826 in TX (top 65%) — families likely to look elsewhere, expect single-tenant / working-renter base with shorter leases.
- Zoned schools: Adams El (math 37% / reading 32%, grade F, #1,995 of 4,322 statewide, top 50%, 431 students, 76% FRL); Lowell Smith Jr Middle (math 27% / reading 32%, grade F, #1,077 of 1,662 statewide, top 66%, 929 students, 68% FRL); Cleburne H S (math 46% / reading 38%, grade F, #730 of 1,632 statewide, top 47%, 1,976 students, 67% FRL).
- Market conditions: 338 active listings in the ZIP; 39 comparable units currently listed for rent nearby; rentals at typical pace (median 26d on market — plan ~3-4 weeks tenant-placement turnaround); 2,152 units permitted in Johnson County in 2024 (76 in 5+ unit buildings).
Forward outlook
- Local home prices are declining (-3.0%/yr); year-one equity from $1k of loan paydown is wiped out by about $5k of value loss. Plan a longer hold.
- Johnson County population projected at +24% by 2050 — long-run rental-demand tailwind backs the buy-and-hold thesis.
Negotiation context
- It's been on market 167 days — a 12% lower offer ($149k) is reasonable based on typical stale-listing flexibility.
- 5 sale attempts since 6y ago; this cycle's ask has dropped $15k (8%) from the opening price — seller is motivated, your offer sets the floor, not the list.
Risks & watch-outs
- Watch-outs: built in 1934 — expect roof / HVAC / electrical / plumbing capex.
- Climate carrying-cost: major wind risk, 27% chance of damaging wind over 30y; moderate wildfire risk; extreme-heat days projected 7→23/yr by 2055 (HVAC capex compounding) — expect insurance premiums to compound above CPI over the hold.
Questions for the listing agent
- It's been on market 167 days. Have you received any prior offers? Is the seller open to a 12% concession, seller financing, or rate buy-down credit?
- Built in 1934 — when were the roof, HVAC, electrical panel, plumbing, and water heater last replaced?
- Why hasn't it sold? Are there any deal-killer items the seller is aware of (foundation, flood, title, zoning, code violations)?
- Is there a deadline driving the sale (1031 exchange, divorce, estate, relocation)? That informs how much negotiation room exists.
- Schools are F-rated, which usually means shorter tenancies and higher turnover. Who's the typical renter profile here, and what's been the actual vacancy rate?
- What's the average days-on-market for RENTAL listings here right now (not sales)? A rising rental-DOM trend means longer vacancies and softer asking-rent achievability than the comps imply.
- What's the recent tenant-quality profile in this submarket — average credit score on applications, eviction rate, late-payment / NSF rate, and stable-employment percentage? A property-management company in the area should have these aggregated.
- How much new for-sale + rental construction is in the pipeline within 1–3 miles? Heavy new supply typically softens prices + rents 12–24 months out; constrained supply supports both.
Investment metrics
- 1% rule
- 0.94% ✗
- Cap rate
- 7.30%
- Cash-on-cash
- 3.61%
- DSCR
- 1.16
- GRM
- 8.9
CMA / ARV
- ARV (median comp)
- $201,479
- List price
- $169,000
- Delta
- -16.12%
- Verdict
- UNDERPRICED
- Comps
- 20 within 1.0 mi
Show comp detail 12 sales within ~0.75 mi
| Address | Dist | Beds/Ba | Sqft | Sold | Price | $/sf | Match |
|---|---|---|---|---|---|---|---|
| 408 W Wardville | 0.60mi | 3/1.0 | 1,137 (+2%) | 12mo | $200,000 | $176 | 59 |
| 807 E 2nd St | 0.51mi | 3/2.0 | 1,134 (+1%) | 13mo | $199,999 | $176 | 59 |
| 305 N Buffalo Ave | 0.60mi | 3/1.0 | 1,081 (-3%) | 9mo | $120,000 | $111 | 59 |
| 512 E Willingham St | 0.61mi | 2/2.0 (-1) | 1,153 (+3%) | 9mo | $209,000 | $181 | 50 |
| 505 W Earl St | 0.61mi | 2/1.0 (-1) | 1,224 (+9%) | 2mo | $175,000 | $143 | 49 |
| 517 Featherston St | 0.73mi | 3/2.0 | 1,047 (-6%) | 7mo | $199,000 | $190 | 45 |
| 603 W 2nd St | 0.73mi | 2/1.0 (-1) | 1,016 (-9%) | 7mo | $169,900 | $167 | 40 |
| 602 W 2nd St | 0.72mi | 2/1.0 (-1) | 1,067 (-5%) | 16mo | $210,000 | $197 | 40 |
| 212 W Brown St | 0.65mi | 3/1.0 | 1,268 (+13%) | 9mo | $149,000 | $118 | 40 |
| 412 W 4th St | 0.65mi | 2/1.0 (-1) | 1,214 (+8%) | 16mo | $209,000 | $172 | 37 |
| 611 E Willingham St | 0.66mi | 3/1.0 | 996 (-11%) | 18mo | $159,900 | $161 | 36 |
| 1104 Prairie Ave | 0.74mi | 2/1.0 (-1) | 952 (-15%) | 9mo | $178,000 | $187 | 28 |
Match score weights: distance 35% · size 25% · config 20% · recency 20%. Top-matched comps best support the ARV.
Projected returns pro-forma
-3.0% appreciation · 3.0% rent growth · sell at horizon
- IRR
- -10.6%
- Equity multiple
- 0.61×
- Total profit
- $-18,336
- Equity at exit
- $25,198
- IRR
- -1.3%
- Equity multiple
- 0.91×
- Total profit
- $-4,343
- Equity at exit
- $14,612
Cash invested: $47,320 (down + closing). Projections, not guarantees.
Landlord ↔ Tenant lean methodology
- Overall (STATE)
- 87 Strongly Landlord-Friendly
- State Texas
- 87 Strongly Landlord-Friendly · R+5
- County
- — inherits STATE
- City
- — inherits STATE
ZIP-level market 76031
- Home prices YoY
- -17.6%
- Active inventory
- 338
- Price-to-rent
- 8.9×
Monthly cashflow live
- Estimated rent
- $1,587 high interval (Pro) →
- Mortgage (P&I)
- −$886
- Tax from tax record
- −$155 /mo · $1,860/yr
- Insurance
- −$70
- HOA
- −$0
- Vacancy / Maint / Mgmt
- −$333
- Net cashflow
- $142
Break-even live
Sensitivity live
| Price | -10% $238 | -5% $190 | +0% $142 | +5% $94 | +10% $47 |
|---|---|---|---|---|---|
| Rent | -10% $17 | -5% $80 | +0% $142 | +5% $205 | +10% $268 |
| Rate | -1.0pp $227 | -0.5pp $185 | base $142 | +0.5pp $98 | +1.0pp $54 |
UW: 25.0% down · 7.5% · 30yr · 1.5% tax · 5.0% vac · 8.0% maint · 8.0% mgmt
Financing live
Cash to close
- Down payment
- $42,250
- Closing costs
- $5,070
- Reserves months
- —
- Total cash needed
- —
Loan-product check · same deal, 3 products live
Conventional
25% down · 7.5% · 30yr
- Down + closing
- —
- Monthly P&I
- —
- Monthly cashflow
- —
- DSCR
- —
- Eligible?
- —
Personal DTI + credit; lowest rate.
DSCR
20% down · 8.5% · 30yr
- Down + closing
- —
- Monthly P&I
- —
- Monthly cashflow
- —
- DSCR
- —
- Eligible?
- —
No personal income docs; deal must DSCR.
Hard money
10% down · 12.0% · 12mo
- Down + closing
- —
- Monthly P&I
- —
- Monthly cashflow
- —
- DSCR
- —
- Eligible?
- —
Short-term bridge; refi at stabilization.
Rent comps 39 comps
| Address | Beds | Baths | Sqft | Rent | $/sqft | DOM | Units | Dist |
|---|---|---|---|---|---|---|---|---|
| 204 W Westhill Dr Cleburne, TX | 3.0 | 2.0 | 1040 | $1,950 | $1.88 | 45d | 1 | 0.25mi |
| 706 S Brazos Ave Unit B Cleburne, TX | 4.0 | 2.0 | 1400 | $1,800 | $1.29 | 26d | 1 | 0.41mi |
| 318 College St Unit B Cleburne, TX | 2.0 | 1.0 | 1256 | $1,150 | $0.92 | 26d | 1 | 0.64mi |
| 405 College St Cleburne, TX | 3.0 | 2.0 | 1396 | $1,650 | $1.18 | 7d | 1 | 0.67mi |
| 431 N Wilhite St Unit 431 Cleburne, TX | 2.0 | 1.0 | 750 | $1,195 | $1.59 | 21d | 1 | 0.75mi |
| 110 E Wilson St Unit B Cleburne, TX | 3.0 | 2.5 | 1400 | $1,900 | $1.36 | 26d | 1 | 0.76mi |
| 112 W Wilson St Cleburne, TX | 2.0 | 1.0 | 1002 | $1,400 | $1.40 | 45d | 1 | 0.78mi |
| 601 Royal St Cleburne, TX | 2.0 | 1.0 | 720 | $1,375 | $1.91 | 4d | 1 | 0.85mi |
| 601 Royal St Cleburne, TX | 2.0 | 1.0 | 720 | $1,325 | $1.84 | 45d | 1 | 0.85mi |
| 601 Royal St Cleburne, TX | 2.0 | 1.0 | 720 | $1,300 | $1.81 | 8d | 1 | 0.85mi |
| 612 N Robinson St Cleburne, TX | 3.0 | 2.5 | 1311 | $2,200 | $1.68 | 45d | 1 | 0.86mi |
| 807 W Smith St Cleburne, TX | 3.0 | 2.0 | 1223 | $1,845 | $1.51 | 14d | 1 | 0.91mi |
| 104 May Ave Cleburne, TX | 3.0 | 2.0 | 1164 | $1,550 | $1.33 | 45d | 1 | 0.93mi |
| 103 May Ave Cleburne, TX | 3.0 | 2.0 | 1262 | $1,795 | $1.42 | 7d | 1 | 0.95mi |
| 910 Fuller Ave Unit C Cleburne, TX | 3.0 | 2.0 | 1300 | $1,650 | $1.27 | 16d | 1 | 0.98mi |
| 910 Fuller Ave Unit A Cleburne, TX | 3.0 | 2.0 | 1300 | $1,650 | $1.27 | 45d | 1 | 1.01mi |
| 909 W Wardville St Cleburne, TX | 2.0 | 1.0 | 847 | $1,350 | $1.59 | 45d | 1 | 1.01mi |
| 907 Hodge St Cleburne, TX | 2.0 | 1.0 | 912 | $1,450 | $1.59 | 4d | 1 | 1.02mi |
| 823 College St Cleburne, TX | 2.0 | 1.0 | 944 | $1,550 | $1.64 | 7d | 1 | 1.06mi |
| 823 College St Cleburne, TX | 2.0 | 1.0 | 944 | $1,550 | $1.64 | 18d | 1 | 1.06mi |
| 1308 N Brazos Ave Cleburne, TX | 3.0 | 2.0 | 1028 | $1,595 | $1.55 | 26d | 1 | 1.12mi |
| 1218 E James St Cleburne, TX | 3.0 | 2.0 | 1335 | $1,695 | $1.27 | 45d | 1 | 1.15mi |
| 901 N Border St Unit A Cleburne, TX | 2.0 | 1.0 | 900 | $950 | $1.06 | 45d | 1 | 1.18mi |
| 438 Sabine Ave Cleburne, TX | 3.0 | 2.0 | 1230 | $1,650 | $1.34 | 14d | 1 | 1.20mi |
| 203 Willana Ct Cleburne, TX | 3.0 | 2.0 | 1100 | $1,700 | $1.55 | 22d | 1 | 1.21mi |
| 301 Pearl St Cleburne, TX | 3.0 | 2.0 | 1405 | $1,900 | $1.35 | 26d | 1 | 1.26mi |
| 1202 Spell Ave Cleburne, TX | 3.0 | 2.0 | 1482 | $1,850 | $1.25 | 14d | 1 | 1.29mi |
| 1005 N Buffalo Ave Cleburne, TX | 3.0 | 1.0 | 1146 | $1,500 | $1.31 | 26d | 1 | 1.30mi |
| 1005 N Buffalo Ave Cleburne, TX | 3.0 | 1.0 | 1146 | $1,500 | $1.31 | 4d | 1 | 1.30mi |
| 1005 N Buffalo Ave Cleburne, TX | 3.0 | 1.0 | 1146 | $1,500 | $1.31 | 45d | 1 | 1.30mi |
| 805 N Douglas Ave Cleburne, TX | 3.0 | 2.0 | 1460 | $1,999 | $1.37 | 45d | 1 | 1.30mi |
| 1005 Granbury St Unit A Cleburne, TX | 3.0 | 2.0 | 1362 | $2,050 | $1.51 | 26d | 1 | 1.33mi |
| 1302 Berry Dr Unit A Cleburne, TX | 2.0 | 1.0 | 861 | $1,400 | $1.63 | 45d | 1 | 1.39mi |
| 1304 Berry Dr Cleburne, TX | 2.0 | 1.0 | 900 | $1,200 | $1.33 | 22d | 1 | 1.40mi |
| 114 Scurlock Ave Cleburne, TX | 4.0 | 2.0 | 1457 | $1,770 | $1.21 | 45d | 1 | 1.44mi |
| 521 Woodard Ave Unit One Cleburne, TX | 2.0 | 1.0 | 1350 | $1,000 | $0.74 | 45d | 1 | 1.46mi |
| 1106 Williams Ave Unit D Cleburne, TX | 2.0 | 1.0 | 900 | $900 | $1.00 | 26d | 1 | 1.46mi |
| 1108 Williams Ave Unit H Cleburne, TX | 2.0 | 1.0 | 900 | $900 | $1.00 | 26d | 1 | 1.48mi |
| 1110 Williams Ave Unit C Cleburne, TX | 2.0 | 1.0 | 900 | $900 | $1.00 | 45d | 1 | 1.50mi |
Listing history 37 events
-
2026-06-21days on market $169,000 Active 167 DOM
-
2026-06-18days on market $169,000 Active 164 DOM
-
2026-06-17days on market $169,000 Active 163 DOM
-
2026-06-16days on market $169,000 Active 162 DOM
-
2026-06-15days on market $169,000 Active 161 DOM
-
2026-06-13days on market $169,000 Active 159 DOM
-
2026-06-09days on market $169,000 Active 155 DOM
-
2026-06-08days on market $169,000 Active 154 DOM
-
2026-06-07days on market $169,000 Active 153 DOM
-
2026-06-04days on market $169,000 Active 150 DOM
-
2026-06-03days on market $169,000 Active 149 DOM
-
2026-06-02days on market $169,000 Active 148 DOM
-
2026-06-01days on market $169,000 Active 147 DOM
-
2026-05-31days on market $169,000 Active 146 DOM
-
2026-02-25price $169,000 462-char remark
Show marketing remark (462 chars)
MOTIVATED SELLER. Bring your offer. Beautiful 2 Bed 1.5 bath home with stainless steel appliance. Fully renovated with new floor and paint. Brand new bathrooms and kitchen with accent backsplash. The house boast a high ceiling all over with open and spacious floorplan. Nice front porch overlooking a grand tree that provides awesome shade. It has a brand new 30yr roof. A huge backyard with metal framing for car port. It is a must see and make it as your home.
-
2026-02-11price $175,000 462-char remark
Show marketing remark (462 chars)
MOTIVATED SELLER. Bring your offer. Beautiful 2 Bed 1.5 bath home with stainless steel appliance. Fully renovated with new floor and paint. Brand new bathrooms and kitchen with accent backsplash. The house boast a high ceiling all over with open and spacious floorplan. Nice front porch overlooking a grand tree that provides awesome shade. It has a brand new 30yr roof. A huge backyard with metal framing for car port. It is a must see and make it as your home.
-
2026-01-29price $180,000 462-char remark
Show marketing remark (462 chars)
MOTIVATED SELLER. Bring your offer. Beautiful 2 Bed 1.5 bath home with stainless steel appliance. Fully renovated with new floor and paint. Brand new bathrooms and kitchen with accent backsplash. The house boast a high ceiling all over with open and spacious floorplan. Nice front porch overlooking a grand tree that provides awesome shade. It has a brand new 30yr roof. A huge backyard with metal framing for car port. It is a must see and make it as your home.
-
2026-01-22price $183,000 462-char remark
Show marketing remark (462 chars)
MOTIVATED SELLER. Bring your offer. Beautiful 2 Bed 1.5 bath home with stainless steel appliance. Fully renovated with new floor and paint. Brand new bathrooms and kitchen with accent backsplash. The house boast a high ceiling all over with open and spacious floorplan. Nice front porch overlooking a grand tree that provides awesome shade. It has a brand new 30yr roof. A huge backyard with metal framing for car port. It is a must see and make it as your home.
-
2026-01-05$184,000 Active 462-char remark
Show marketing remark (462 chars)
MOTIVATED SELLER. Bring your offer. Beautiful 2 Bed 1.5 bath home with stainless steel appliance. Fully renovated with new floor and paint. Brand new bathrooms and kitchen with accent backsplash. The house boast a high ceiling all over with open and spacious floorplan. Nice front porch overlooking a grand tree that provides awesome shade. It has a brand new 30yr roof. A huge backyard with metal framing for car port. It is a must see and make it as your home.
-
2024-09-30historical
-
2024-06-12price $184,000
-
2024-06-07status Active
-
2024-05-18price $189,000
-
2024-05-09$195,000 Active
-
2021-12-01soldstatus
-
2021-03-18soldstatus Sold
-
2021-03-18soldstatus
-
2021-03-10status Pending
-
2021-03-09price $99,000
-
2021-02-25price $105,000
-
2021-02-01status Active
-
2021-01-28historical Active Option Contract
-
2021-01-25price $110,000
-
2020-12-03$120,000 Active
-
2020-02-04soldstatus
-
2007-12-07soldstatus
-
1999-09-08soldstatus
ⓘ Source: listings_history table (triggers on properties + properties_extension) + one-shot
backfill from property_details.listing_events for pre-trigger history.
Tax reassessment forecast TX · Resets to sale price
- Current annual tax
- $1,860 · $155/mo
- Projected year-2 tax
- $3,093 · $258/mo
- Expected delta
- +$1,233/yr (+$103/mo · 66.3%)
ⓘ Screening estimate from a state-policy table — verify with the county assessor before closing.
Climate risk First Street
- Flood 1/10 Low FEMA zone X (unshaded) · 0% chance over 30 yrs
- Wildfire 5/10 Major
- Heat 7/10 Severe 7 d/yr ≥109°F today · 23 d/yr by 30 yrs out
- Wind 6/10 Major 27% chance of damaging wind over 30 yrs
- Air quality 2/10 Low 1 unhealthy d/yr today · 2 by 30 yrs out
Nearby sold comps map
Loading sold comps map…
Walkable amenities ~0.75 mi
Loading nearby amenities…
Taxation est. · year 1
- Rental income
- $19,047
- − Mortgage interest
- −$9,467
- − Property taxes
- −$1,860
- − Insurance
- −$845
- − Repairs & maintenance
- −$1,524
- − Management
- −$1,524
- − Depreciation
- −$4,916
- Taxable loss
- −$1,089
- Est. tax savings @ 24.0%
- +$261
- After-tax cash flow
- $1,968/yr
For passive investors: Depreciation is non-cash, so a rental often shows a tax loss while cash-flowing — sheltering income. Rental losses are passive: they offset passive income freely, and up to $25,000/yr can offset ordinary (W-2) income if you actively participate and your MAGI is under $100k (phasing out to $0 by $150k); unused losses carry forward. On sale, claimed depreciation is recaptured at up to 25%, and gains may owe capital-gains tax (a 1031 exchange can defer both). Figures are a year-1 estimate at your 24.0% rate — not tax advice; consult a CPA.
Schools (NCES district)
- District
- Cleburne ISD
- NCES district ID
- 4814310
- Math proficiency
- 34% ▼ -2.00%
- Reading proficiency
- 33% ▼ -2.00%
- Median HH income
- $48,788
- Composite
- 29.0/100
- National rank
- #6618
- State rank
- #537 of 826 in TX
Livability — Cleburne
- Score
- 68/100
- State rank
- #460
- US rank
- #9292
Category grades
Schools grade is shown separately in the Schools card above.
Census & demographics
- Census place
- Cleburne, TX
- City population
- 29,538
- Population (ZIP)
- 18,697
Population outlook (Johnson County) Hauer SSP2
- Today (2025)
- 179,678 people
- By 2030
- 189,208 · +5.3%
- By 2040
- 207,261 · +15.4%
- By 2050
- 223,064 · +24.1%
- By 2075
- 259,979 · +44.7%
- By 2100
- 275,395 · +53.3%
Race, ethnicity, and origin ACS 2023
- Neighborhood character
- Predominantly White (66%)
- Race & ethnicity
- White 66% Hispanic / Latino 28% Two or more races 12% Black 3%
- Hispanic origin (detail)
- Mexican 23% Puerto Rican 3%
- Common ancestry
- Italian 1% Lithuanian 1% Slovak 1%
- Foreign-born
- 5% · Canada, Vietnam
- Languages at home
- 77% English-only · Spanish 22% Vietnamese 0%
Political lean MEDSL · Johnson
- 2024 margin
- Solid R (+51.4) · D 23.9% · R 75.3%
- 2008→2024 swing
- -3.9pp toward R · 2008: -47.5pp · 2024: -51.4pp
- All cycles
- 2024: R+51.4 2020: R+53.0 2016: R+58.3 2012: R+55.6 2008: R+47.5
Not yet ingested
- Civics
- —
Market trends
- HPI YoY
- ▼ -59.43%
- Current HPI
- 277.598
- Rent YoY
- —
- Metro
- —
- State GDP YoY
- ▲ 3.95%
- F500 in state
- 110
Industry mix (Fortune 500 HQ in TX)
| Industry | F500 HQs | Revenue |
|---|---|---|
| Energy | 16 | $1,198B |
|
||
| Technology | 5 | $198B |
|
||
| Engineering / Construction | 4 | $72B |
|
||
| Energy Services | 3 | $60B |
|
||
| Utilities | 3 | $41B |
|
||
| Healthcare | 2 | $330B |
|
||
Price history
+40.8% since first listed23 events — show timeline
- 2026-02-25 Price Changed $169,000 NTREIS
- 2026-02-11 Price Changed $175,000 NTREIS
- 2026-01-29 Price Changed $180,000 NTREIS
- 2026-01-22 Price Changed $183,000 NTREIS
- 2026-01-05 Listed $184,000 NTREIS
- 2024-09-30 Listing Removed — NTREIS
- 2024-06-12 Price Changed $184,000 NTREIS
- 2024-06-07 Relisted — NTREIS
- 2024-05-18 Price Changed $189,000 NTREIS
- 2024-05-09 Listed $195,000 NTREIS
- 2021-12-01 Sold (Public Records) — Public Records
- 2021-03-18 Sold (Public Records) — Public Records
- 2021-03-18 Sold (MLS) — NTREIS
- 2021-03-10 Pending — NTREIS
- 2021-03-09 Price Changed $99,000 NTREIS
- 2021-02-25 Price Changed $105,000 NTREIS
- 2021-02-01 Relisted — NTREIS
- 2021-01-28 Contingent — NTREIS
- 2021-01-25 Price Changed $110,000 NTREIS
- 2020-12-03 Listed $120,000 NTREIS
- 2020-02-04 Sold (Public Records) — Public Records
- 2007-12-07 Sold (Public Records) — Public Records
- 1999-09-08 Sold (Public Records) — Public Records
Property tax history
+8.5%/yrLatest (2025): $1,860 · +1.5% YoY. Source: county tax records.
Cash-flow waterfall
monthlySold comps — $/sqft
last 12 mo · ≤1 miLoading sold comps…