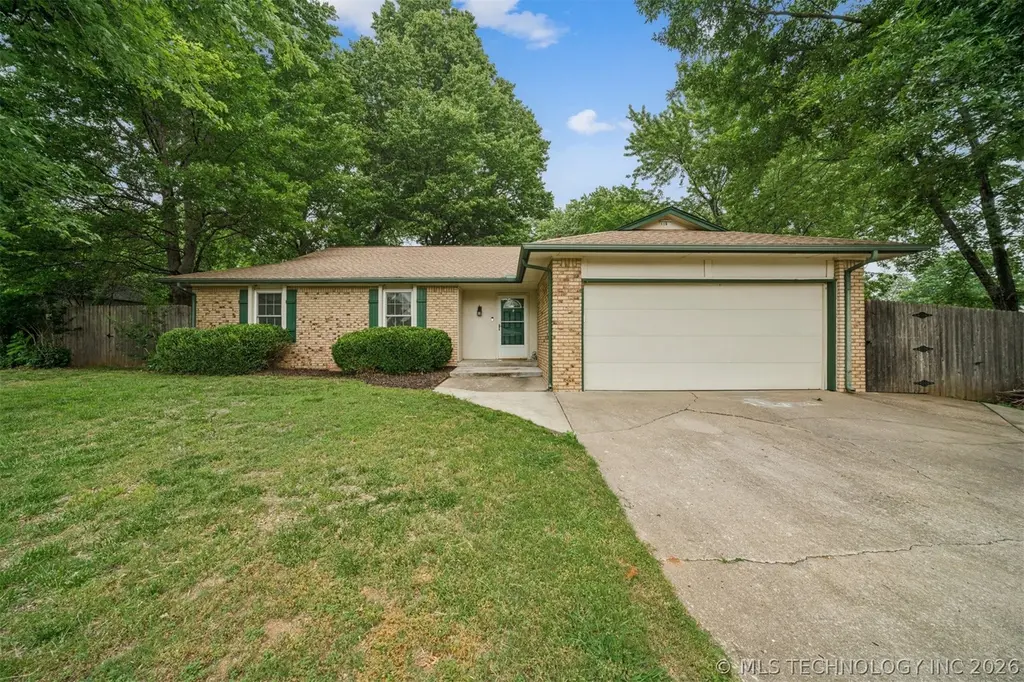
116 W Jefferson St · Broken Arrow, OK
Flood risk 1/10 · Minimal
- FEMA flood zone
- X (unshaded)
- Chance of flooding over 30 yrs
- 0.0%
- Est. flood insurance / yr
- $473 – $860
Fire risk 3/10 · Minor
- Est. fire insurance / yr
- $2,463 – $4,575
Heat risk 6/10 · Moderate
- Hot days now (above 111°F)
- 7 days/yr
- Hot days in 30 yrs
- 18 days/yr
Wind risk 2/10 · Minimal
- Chance of severe wind over 30 yrs
- 3.0%
Air-quality risk 2/10 · Minimal
- Unhealthy air days now
- 1 days/yr
- Unhealthy air days in 30 yrs
- 1 days/yr
Risk factors via First Street. Map © Google.
Why this score? — see what drove the D grade
The composite is a weighted blend of 9 inputs, each scored 0–100. Each bar is that input's sub-score; the figure is the points it added to the 100-point composite (weight × sub-score).
- Cash flow +13.3/30.0
- ARV discount +9.2/15.0
- DSCR +4.0/10.0
- Livability +3.9/5.0
- Rent growth +3.5/5.0
- 1% rule +3.4/10.0
- Condition / age +2.5/5.0
- Schools +2.4/10.0
- Appreciation +0.0/10.0
$235,000
🖨 Deal sheet 📄 Offer letter ✓ Due diligence
Listing remarks MLS
Adorable find in BA! This one home won't last long. Updated kitchen with granite and SS appliances, tile floors, updated bathrooms, newer HWH, Furnace, AC Unit, full privacy fence, covered patio, large rooms. BA schools. MUST SEE!!
Key facts
- Brick home
- Updated bathrooms
- Updated kitchen
Tags
Property features AI
Finance
- HOA & community: Gutter(s) listed as a community feature
Exterior
- Parking: Attached garage (2 car)
- Security: Smoke detector(s); No safety shelter
- Utilities: Electricity available; Natural gas available; Public water; Public sewer
- Home design: Single-story home; Brick and wood frame construction; Slab foundation; Asphalt/fiberglass roof; Built per public records
- Construction: Brick and wood frame construction; Asphalt/fiberglass roof; Slab foundation; Built per public records
- Exterior features: Concrete driveway; Landscaping; Rain gutters; Covered patio and porch; Porch; Full privacy fencing; Corner lot; Mature trees; Faces southeast
Interior
- Kitchen: Granite counters; Oven; Range; Dishwasher; Disposal; Refrigerator; Plumbed for ice maker; Breakfast nook
- Bedrooms: Master bedroom with private bath and walk-in closet (First floor); Additional bedrooms without attached baths (First floor)
- Flooring: Carpet; Tile
- Bathrooms: Two full bathrooms; Master bath with bathtub and separate shower; Hall bath with bathtub (full bath)
- Heating & cooling: Central heating (Gas); Central air conditioning; Gas water heater
- Interior features: Attic; Granite counters; High ceilings; Cable TV; Ceiling fan(s); Gas range connection; Programmable thermostat; Vinyl windows
- Laundry & utility: Washer hookup; Washer; Dryer; Utility room (inside, First floor)
Neighborhood map
What this means for you Summary
Snapshot
- This is a 3-bed/2.0-bath single-family listed at $235k.
Deal economics
- At list price, monthly cash flow is $0 ($2/yr) — positive.
- The deal already cash-flows at list — no discount required.
- To meet the 1% rule (rent ≥ 1% of price), the offer needs to be $197k (16.2% below list).
- Recommended offer: $197k (16.2% below list) — sets the bar for 1% rule.
- Cap rate 6.3% vs local median 4.0% in Broken Arrow — top-decile yield for the area; either an underpriced asset or a hidden risk that comps aren't pricing in. Stress-test before assuming the spread holds.
Location & tenants
- Location reads 78/100 on livability (#7 in OK, #2,691 nationally) — a middle-class / working-renter tenant base. Strengths: commute A+, cost of living A+, housing A+; Watch: schools D+, amenities F.
- Broken Arrow (suburban): math 23% / reading 28% proficiency, ranked #79 of 270 in OK (top 29%) — low school quality limits family demand, transient renter base, plan for 1-2y turnover.
- Market conditions: Rents rising fast (+4.1%/yr); 381 active listings in the ZIP; 6 comparable units currently listed for rent nearby; rentals at typical pace (median 16d on market — plan ~3-4 weeks tenant-placement turnaround); solid renter incomes; 2,818 units permitted in Tulsa County in 2024 (518 in 5+ unit buildings).
Forward outlook
- Local home prices are declining (-3.0%/yr); year-one equity from $2k of loan paydown is wiped out by about $7k of value loss. Plan a longer hold.
- Tulsa County population projected at +30% by 2050 — long-run rental-demand tailwind backs the buy-and-hold thesis.
Negotiation context
- Only 6 days on market — expect competitive offers; lowballing is unlikely to land.
- 6 sale attempts since 35y ago with the ask held roughly flat each time — persistent listings suggest the price (not the market) is what's stuck; bring a comps-based counter.
- Current owner paid $165k; 42% above their basis — modest negotiation headroom, anchor on the comps not their cost.
Risks & watch-outs
- Climate carrying-cost: extreme-heat days projected 7→18/yr by 2055 (HVAC capex compounding) — expect insurance premiums to compound above CPI over the hold.
Questions for the listing agent
- Built in 1976 — when were the roof, HVAC, electrical panel, plumbing, and water heater last replaced?
- Is there a deadline driving the sale (1031 exchange, divorce, estate, relocation)? That informs how much negotiation room exists.
- Schools are D-rated, which usually means shorter tenancies and higher turnover. Who's the typical renter profile here, and what's been the actual vacancy rate?
- The area grade is low — what's the realistic commute time and amenity access for the typical tenant pool here? Any planned neighborhood developments (good or bad) we should know about?
- What's the average days-on-market for RENTAL listings here right now (not sales)? A rising rental-DOM trend means longer vacancies and softer asking-rent achievability than the comps imply.
- What's the recent tenant-quality profile in this submarket — average credit score on applications, eviction rate, late-payment / NSF rate, and stable-employment percentage? A property-management company in the area should have these aggregated.
- How much new for-sale + rental construction is in the pipeline within 1–3 miles? Heavy new supply typically softens prices + rents 12–24 months out; constrained supply supports both.
Investment metrics
- 1% rule
- 0.84% ✗
- Cap rate
- 6.29%
- Cash-on-cash
- 0.00%
- DSCR
- 1.00
- GRM
- 9.9
CMA / ARV
- ARV (on-the-fly)
- $244,186
- Comps found
- 12
Show comp detail 12 sales within ~0.75 mi
| Address | Dist | Beds/Ba | Sqft | Sold | Price | $/sf | Match |
|---|---|---|---|---|---|---|---|
| 5601 S Ash Ave | 0.14mi | 3/2.0 | 1,485 (+1%) | 5mo | $235,000 | $158 | 88 |
| 217 W Miami St | 0.30mi | 3/2.0 | 1,469 (-0%) | 3mo | $245,000 | $167 | 83 |
| 1105 W Durham St | 0.65mi | 3/2.0 | 1,478 (+0%) | 1mo | $225,000 | $152 | 69 |
| 109 W Austin St | 0.46mi | 3/2.0 | 1,366 (-7%) | 3mo | $208,000 | $152 | 65 |
| 4609 S Date Ave | 0.39mi | 3/2.0 | 1,260 (-14%) | 3mo | $198,000 | $157 | 56 |
| 4605 S Cedar Ave | 0.37mi | 3/2.0 | 1,260 (-14%) | 3mo | $210,000 | $167 | 56 |
| 417 W Birmingham Ave | 0.49mi | 3/2.0 | 1,286 (-13%) | 2mo | $220,000 | $171 | 55 |
| 316 E Vicksburg St | 0.72mi | 4/2.0 (+1) | 1,414 (-4%) | 2mo | $230,000 | $163 | 53 |
| 400 E Vicksburg St | 0.73mi | 4/2.0 (+1) | 1,414 (-4%) | 4mo | $235,000 | $166 | 51 |
| 4416 S Elm Ave | 0.56mi | 3/1.5 | 1,324 (-10%) | 6mo | $220,000 | $166 | 51 |
| 1113 W Durham St | 0.66mi | 3/2.0 | 1,320 (-10%) | 2mo | $225,000 | $170 | 50 |
| 4332 S Elm Ave | 0.66mi | 3/1.0 | 1,368 (-7%) | 5mo | $187,000 | $137 | 49 |
Match score weights: distance 35% · size 25% · config 20% · recency 20%. Top-matched comps best support the ARV.
Projected returns pro-forma
-3.0% appreciation · 4.09% rent growth · sell at horizon
- IRR
- -15.1%
- Equity multiple
- 0.45×
- Total profit
- $-35,896
- Equity at exit
- $35,039
- IRR
- -4.9%
- Equity multiple
- 0.66×
- Total profit
- $-22,132
- Equity at exit
- $20,319
Cash invested: $65,800 (down + closing). Projections, not guarantees.
Landlord ↔ Tenant lean methodology
- Overall (STATE)
- 83 Strongly Landlord-Friendly
- State Oklahoma
- 83 Strongly Landlord-Friendly · R+20
- County
- — inherits STATE
- City
- — inherits STATE
ZIP-level market 74011
- Rents YoY
- 4.1%
- Active inventory
- 381
- Price-to-rent
- 9.9×
Monthly cashflow live
- Estimated rent
- $1,969 high interval (Pro) →
- Mortgage (P&I)
- −$1,232
- Tax from tax record
- −$225 /mo · $2,703/yr
- Insurance
- −$98
- HOA
- −$0
- Vacancy / Maint / Mgmt
- −$414
- Net cashflow
- $0
Break-even live
UW: 25.0% down · 7.5% · 30yr · 1.5% tax · 5.0% vac · 8.0% maint · 8.0% mgmt
Financing live
Cash to close
- Down payment
- $58,750
- Closing costs
- $7,050
- Reserves months
- —
- Total cash needed
- —
Loan-product check · same deal, 3 products live
Conventional
25% down · 7.5% · 30yr
- Down + closing
- —
- Monthly P&I
- —
- Monthly cashflow
- —
- DSCR
- —
- Eligible?
- —
Personal DTI + credit; lowest rate.
DSCR
20% down · 8.5% · 30yr
- Down + closing
- —
- Monthly P&I
- —
- Monthly cashflow
- —
- DSCR
- —
- Eligible?
- —
No personal income docs; deal must DSCR.
Hard money
10% down · 12.0% · 12mo
- Down + closing
- —
- Monthly P&I
- —
- Monthly cashflow
- —
- DSCR
- —
- Eligible?
- —
Short-term bridge; refi at stabilization.
Rent comps 6 comps
| Address | Beds | Baths | Sqft | Rent | $/sqft | DOM | Units | Dist |
|---|---|---|---|---|---|---|---|---|
| 4801 S Elm Pl Broken Arrow, OK | 1.0–2.0 | 1.0–2.0 | 1028 | $1,729 | $1.68 | 2d | 8 | 0.28mi |
| 4325 S Ash Ave Broken Arrow, OK | 4.0 | 2.0 | 1400 | $1,578 | $1.13 | 21d | 1 | 0.58mi |
| 6308 S 1st Pl Broken Arrow, OK | 3.0 | 2.0 | 1600 | $3,400 | $2.12 | 16d | 1 | 0.70mi |
| 1110 W Birmingham Pl Broken Arrow, OK | 3.0 | 2.0 | 1282 | $1,750 | $1.37 | 3d | 1 | 0.75mi |
| 304 W Quantico St Broken Arrow, OK | 2.0 | 2.0 | 1110 | $1,050 | $0.95 | 16d | 1 | 1.01mi |
| 505 W Quantico St Broken Arrow, OK | 3.0 | 2.0 | 1033 | $1,250 | $1.21 | 10d | 1 | 1.02mi |
Listing history 18 events
-
2026-05-18$235,000 Active
-
2021-04-01soldstatus $165,000 Closed 231-char remark
Show marketing remark (231 chars)
Adorable find in BA! This one home won't last long. Updated kitchen with granite and SS appliances, tile floors, updated bathrooms, newer HWH, Furnace, AC Unit, full privacy fence, covered patio, large rooms. BA schools. MUST SEE!!
-
2021-02-04status Pending 231-char remark
Show marketing remark (231 chars)
Adorable find in BA! This one home won't last long. Updated kitchen with granite and SS appliances, tile floors, updated bathrooms, newer HWH, Furnace, AC Unit, full privacy fence, covered patio, large rooms. BA schools. MUST SEE!!
-
2021-02-04price $166,900 231-char remark
Show marketing remark (231 chars)
Adorable find in BA! This one home won't last long. Updated kitchen with granite and SS appliances, tile floors, updated bathrooms, newer HWH, Furnace, AC Unit, full privacy fence, covered patio, large rooms. BA schools. MUST SEE!!
-
2021-02-03$160,000 Active 231-char remark
Show marketing remark (231 chars)
Adorable find in BA! This one home won't last long. Updated kitchen with granite and SS appliances, tile floors, updated bathrooms, newer HWH, Furnace, AC Unit, full privacy fence, covered patio, large rooms. BA schools. MUST SEE!!
-
2012-12-17soldstatus $86,000 225-char remark
Show marketing remark (225 chars)
Ranch style home on wooded corner lot with privacy fence, appears to have some updates including windows, furnace, air, tile floors in kitchen, corner fireplace, open plan, boat pad & convenient freeway access - HURRY!!
-
2012-11-20historical 225-char remark
Show marketing remark (225 chars)
Ranch style home on wooded corner lot with privacy fence, appears to have some updates including windows, furnace, air, tile floors in kitchen, corner fireplace, open plan, boat pad & convenient freeway access - HURRY!!
-
2012-10-26$94,000 225-char remark
Show marketing remark (225 chars)
Ranch style home on wooded corner lot with privacy fence, appears to have some updates including windows, furnace, air, tile floors in kitchen, corner fireplace, open plan, boat pad & convenient freeway access - HURRY!!
-
2004-03-29soldstatus $99,500
-
2004-03-24soldstatus $99,500
-
2004-03-08historical
-
2004-01-16$99,500
-
1997-12-30soldstatus $72,500
-
1997-12-23soldstatus $72,500
-
1997-11-14historical
-
1997-11-03$74,000
-
1991-12-30soldstatus $62,000
-
1991-10-08$64,900
ⓘ Source: listings_history table (triggers on properties + properties_extension) + one-shot
backfill from property_details.listing_events for pre-trigger history.
Tax reassessment forecast OK · Resets to sale price
- Current annual tax
- $2,703 · $225/mo
- Projected year-2 tax
- $2,703 · $225/mo
- Expected delta
- $0/yr ($0/mo · 0.0%)
ⓘ Screening estimate from a state-policy table — verify with the county assessor before closing.
Climate risk First Street
- Flood 1/10 Low FEMA zone X (unshaded) · 0% chance over 30 yrs
- Wildfire 3/10 Moderate
- Heat 6/10 Major 7 d/yr ≥111°F today · 18 d/yr by 30 yrs out
- Wind 2/10 Low 3% chance of damaging wind over 30 yrs
- Air quality 2/10 Low 1 unhealthy d/yr today · 1 by 30 yrs out
Nearby sold comps map
Loading sold comps map…
Walkable amenities ~0.75 mi
Loading nearby amenities…
Taxation est. · year 1
- Rental income
- $23,631
- − Mortgage interest
- −$13,164
- − Property taxes
- −$2,703
- − Insurance
- −$1,175
- − Repairs & maintenance
- −$1,891
- − Management
- −$1,891
- − Depreciation
- −$6,836
- Taxable loss
- −$4,028
- Est. tax savings @ 24.0%
- +$967
- After-tax cash flow
- $969/yr
For passive investors: Depreciation is non-cash, so a rental often shows a tax loss while cash-flowing — sheltering income. Rental losses are passive: they offset passive income freely, and up to $25,000/yr can offset ordinary (W-2) income if you actively participate and your MAGI is under $100k (phasing out to $0 by $150k); unused losses carry forward. On sale, claimed depreciation is recaptured at up to 25%, and gains may owe capital-gains tax (a 1031 exchange can defer both). Figures are a year-1 estimate at your 24.0% rate — not tax advice; consult a CPA.
Schools (NCES district)
- District
- Broken Arrow
- NCES district ID
- 4005490
- Math proficiency
- 23% ▼ -9.00%
- Reading proficiency
- 28% ▼ -9.00%
- Median HH income
- $64,646
- Composite
- 23.86/100
- National rank
- #7801
- State rank
- #79 of 270 in OK
Livability — Broken Arrow
- Score
- 78/100
- State rank
- #7
- US rank
- #2691
Category grades
Schools grade is shown separately in the Schools card above.
Census & demographics
- Census place
- Broken Arrow, OK
- County
- Tulsa County · 640,811 people
- City population
- 144,172
- Metro
- Tulsa, OK
- Population (ZIP)
- 33,900
- Household income
- $99,157
- Rent vs Own
- Severe rent burden
- 389.0
Population outlook (Tulsa County) Hauer SSP2
- Today (2025)
- 723,846 people
- By 2030
- 766,033 · +5.8%
- By 2040
- 851,386 · +17.6%
- By 2050
- 938,389 · +29.6%
- By 2075
- 1,166,011 · +61.1%
- By 2100
- 1,350,277 · +86.5%
Race, ethnicity, and origin ACS 2023
- Neighborhood character
- Predominantly White (68%)
- Race & ethnicity
- White 68% Two or more races 15% Hispanic / Latino 10% Native American 4% Black 4% Asian 3%
- Hispanic origin (detail)
- Mexican 7%
- Common ancestry
- Lithuanian 3% Serbian 2% Slovak 2%
- Foreign-born
- 5% · Canada
- Languages at home
- 93% English-only · Spanish 5% Other Asian/Pacific 1%
Political lean MEDSL · Tulsa
- 2024 margin
- R (+15.2) · D 41.3% · R 56.5% · Other 2.2%
- 2008→2024 swing
- +9.2pp toward D · 2008: -24.5pp · 2024: -15.2pp
- All cycles
- 2024: R+15.2 2020: R+15.6 2016: R+22.9 2012: R+27.4 2008: R+24.5
Not yet ingested
- Civics
- —
Market trends
- HPI YoY
- ▼ -180.15%
- Current HPI
- 210.8302
- Rent YoY
- ▲ 4.09%
- Metro
- Tulsa, OK
- State GDP YoY
- ▲ 1.55%
- F500 in state
- 6
Industry mix (Fortune 500 HQ in OK)
| Industry | F500 HQs | Revenue |
|---|---|---|
| Energy | 3 | $48B |
|
||
Price history
+262.1% since first listed18 events — show timeline
- 2026-05-18 Listed $235,000 MLS Technology, Inc.
- 2021-04-01 Sold (MLS) $165,000 MLS Technology, Inc.
- 2021-02-04 Pending — MLS Technology, Inc.
- 2021-02-04 Price Changed $166,900 MLS Technology, Inc.
- 2021-02-03 Listed $160,000 MLS Technology, Inc.
- 2012-12-17 Sold (MLS) $86,000 MLS Technology, Inc.
- 2012-11-20 Listing Removed — MLS Technology, Inc.
- 2012-10-26 Listed $94,000 MLS Technology, Inc.
- 2004-03-29 Sold (Public Records) $99,500 Public Records
- 2004-03-24 Sold (MLS) $99,500 MLS Technology, Inc.
- 2004-03-08 Listing Removed — MLS Technology, Inc.
- 2004-01-16 Listed $99,500 MLS Technology, Inc.
- 1997-12-30 Sold (Public Records) $72,500 Public Records
- 1997-12-23 Sold (MLS) $72,500 MLS Technology, Inc.
- 1997-11-14 Listing Removed — MLS Technology, Inc.
- 1997-11-03 Listed $74,000 MLS Technology, Inc.
- 1991-12-30 Sold (Public Records) $62,000 Public Records
- 1991-10-08 Listed $64,900 MLS Technology, Inc.
Property tax history
+6.0%/yrLatest (2025): $2,703 · +4.9% YoY. Source: county tax records.
Cash-flow waterfall
monthlySold comps — $/sqft
last 12 mo · ≤1 miLoading sold comps…