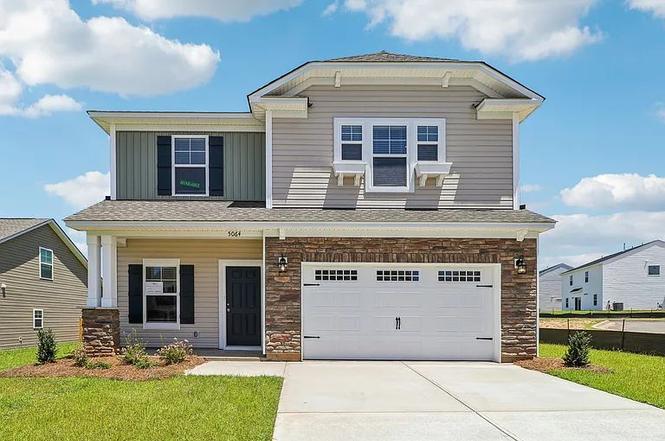
4266 Hartshorn Cir · Graniteville, SC
Flood risk No data
- FEMA flood zone
- —
- Chance of flooding over 30 yrs
- —
- Est. flood insurance / yr
- —
Fire risk No data
- Est. fire insurance / yr
- —
Heat risk No data
- Hot days now (above threshold)
- —
- Hot days in 30 yrs
- —
Wind risk No data
- Chance of severe wind over 30 yrs
- —
Air-quality risk No data
- Unhealthy air days now
- —
- Unhealthy air days in 30 yrs
- —
Risk factors via First Street. Map © Google.
Why this score? — see what drove the D- grade
The composite is a weighted blend of 9 inputs, each scored 0–100. Each bar is that input's sub-score; the figure is the points it added to the 100-point composite (weight × sub-score).
- Cash flow +11.1/30.0
- ARV discount +5.4/15.0
- Rent growth +3.8/5.0
- 1% rule +3.6/10.0
- DSCR +3.2/10.0
- Schools +3.2/10.0
- Livability +3.0/5.0
- Condition / age +2.5/5.0
- Appreciation +0.0/10.0
$274,900
🖨 Deal sheet 📄 Offer letter ✓ Due diligence
Listing remarks
Welcome to this stunning 4-bedroom, 2.5-bath home located in a desirable pool community. Designed with both comfort and style in mind, this home features an inviting open-concept floor plan ideal for everyday living and entertaining. The kitchen shines with beautiful granite countertops, a stylish tile backsplash, and ample workspace—perfect for any culinary enthusiast. Enter through a bright, welcoming foyer accented by upgraded luxury plank flooring that sets a sophisticated tone throughout the home. A functional mudroom provides convenient extra storage, keeping everything organized and clutter-free. Unwind at the end of the day in your relaxing soaking tub, or enjoy peaceful eveni
Key facts
- Open floor plan
- Mudroom storage
- Granite countertops
Tags
Property features AI
Finance
- Other: Located at 4266 Hartshorn Cir, Aiken, SC 29801
- Financial info: List price $269,900
Exterior
- Parking: 2 parking spaces
- Utilities: Natural gas; Electric
- Home design: Single-family residence (spec build); Harper II floor plan
- Exterior features: Living area approximately 1,889
Interior
- Bedrooms: 4 bedrooms
- Bathrooms: 2 full bathrooms and 1 half bathroom (2.5 total)
- Heating & cooling: Natural gas and electric forced-air heating; Central air conditioning
- Interior features: Spec home (Harper II plan)
Neighborhood map
What this means for you Summary
Snapshot
- This is a 5-bed/3.0-bath single-family listed at $275k.
Deal economics
- At list price, monthly cash flow is $-112 ($-1k/yr) — negative.
- To cash-flow at today's rent, offer at most $259k (5.9% below list).
- To meet the 1% rule (rent ≥ 1% of price), the offer needs to be $236k (14.0% below list).
- Recommended offer: $236k (14.0% below list) — sets the bar for 1% rule.
Location & tenants
- Location reads 59/100 on livability (#240 in SC) — a working-class tenant base; expect higher turnover. Strengths: cost of living A+, crime B+; Watch: schools F, amenities F, commute F.
- Aiken 01 (suburban): math 31% / reading 44% proficiency, ranked #36 of 80 in SC (top 45%) — families likely to look elsewhere, expect single-tenant / working-renter base with shorter leases.
- Market conditions: Rents rising fast (+5.1%/yr); 521 active listings in the ZIP; 3 comparable units currently listed for rent nearby; rentals at typical pace (median 21d on market — plan ~3-4 weeks tenant-placement turnaround); 2,500 units permitted in Aiken County in 2024 (1,023 in 5+ unit buildings).
- At $2,364/mo this rent would consume 48% of the median local household income ($60k/yr) (locally 1260% of renters already pay >50% of income on rent) — very limited rent-growth headroom before tenants either downsize or default.
Forward outlook
- Local home prices are declining (-3.0%/yr); year-one equity from $2k of loan paydown is wiped out by about $8k of value loss. Plan a longer hold.
- Aiken County population projected at +9% by 2050 — modest demand growth; plan on rents tracking national, not racing it.
Negotiation context
- It's been on market 205 days — a 12% lower offer ($242k) is reasonable based on typical stale-listing flexibility.
Questions for the listing agent
- What do current leases actually rent for vs. the listed asking? Can we see a recent rent roll and the last 12 months of T-12 income?
- It's been on market 205 days. Have you received any prior offers? Is the seller open to a 14% concession, seller financing, or rate buy-down credit?
- What does the HOA fee cover, when was the last increase, and are there any pending special assessments or reserve-fund shortfalls?
- Why hasn't it sold? Are there any deal-killer items the seller is aware of (foundation, flood, title, zoning, code violations)?
- Is there a deadline driving the sale (1031 exchange, divorce, estate, relocation)? That informs how much negotiation room exists.
- Schools are F-rated, which usually means shorter tenancies and higher turnover. Who's the typical renter profile here, and what's been the actual vacancy rate?
- The area grade is low — what's the realistic commute time and amenity access for the typical tenant pool here? Any planned neighborhood developments (good or bad) we should know about?
- What's the average days-on-market for RENTAL listings here right now (not sales)? A rising rental-DOM trend means longer vacancies and softer asking-rent achievability than the comps imply.
- What's the recent tenant-quality profile in this submarket — average credit score on applications, eviction rate, late-payment / NSF rate, and stable-employment percentage? A property-management company in the area should have these aggregated.
- How much new for-sale + rental construction is in the pipeline within 1–3 miles? Heavy new supply typically softens prices + rents 12–24 months out; constrained supply supports both.
Investment metrics
- 1% rule
- 0.86% ✗
- Cap rate
- 5.80%
- Cash-on-cash
- -1.75%
- DSCR
- 0.92
- GRM
- 9.7
CMA / ARV
- ARV (on-the-fly)
- $262,571
- Comps found
- 12
Show comp detail 12 sales within ~0.75 mi
| Address | Dist | Beds/Ba | Sqft | Sold | Price | $/sf | Match |
|---|---|---|---|---|---|---|---|
| 4213 Hartshorn Cir | 0.05mi | 4/2.5 (-1) | 1,889 (0%) | 7mo | $269,900 | $143 | 85 |
| 338 Mansell Park | 0.18mi | 4/2.5 (-1) | 2,122 (+12%) | 6mo | $279,000 | $131 | 59 |
| 597 Whitby Ct | 0.60mi | 4/2.5 (-1) | 1,976 (+5%) | 3mo | $275,230 | $139 | 55 |
| 580 Whitby Ct | 0.58mi | 4/2.5 (-1) | 1,976 (+5%) | 4mo | $273,220 | $138 | 55 |
| 567 Whitby Ct | 0.57mi | 4/2.5 (-1) | 1,976 (+5%) | 5mo | $273,230 | $138 | 55 |
| 567 Whitby Ct | 0.57mi | 4/2.5 (-1) | 1,976 (+5%) | 5mo | $273,230 | $138 | 55 |
| 610 Lytham Dr | 0.50mi | 4/2.0 (-1) | 1,774 (-6%) | 4mo | $289,910 | $163 | 54 |
| 610 Lytham Dr | 0.50mi | 4/2.0 (-1) | 1,774 (-6%) | 4mo | $289,910 | $163 | 54 |
| 542 Whitby Ct | 0.55mi | 4/2.5 (-1) | 1,976 (+5%) | 6mo | $273,230 | $138 | 54 |
| 631 Lytham Dr | 0.52mi | 4/2.0 (-1) | 1,774 (-6%) | 4mo | $291,910 | $165 | 53 |
| 631 Lytham Dr | 0.52mi | 4/2.0 (-1) | 1,774 (-6%) | 4mo | $291,910 | $165 | 53 |
| 525 Burnaby Ct | 0.35mi | 4/2.5 (-1) | 2,165 (+15%) | 8mo | $301,000 | $139 | 45 |
Match score weights: distance 35% · size 25% · config 20% · recency 20%. Top-matched comps best support the ARV.
Projected returns pro-forma
-3.0% appreciation · 5.06% rent growth · sell at horizon
- IRR
- -16.8%
- Equity multiple
- 0.39×
- Total profit
- $-46,599
- Equity at exit
- $40,988
- IRR
- -5.1%
- Equity multiple
- 0.64×
- Total profit
- $-28,021
- Equity at exit
- $23,768
Cash invested: $76,972 (down + closing). Projections, not guarantees.
Landlord ↔ Tenant lean methodology
- Overall (STATE)
- 90 Strongly Landlord-Friendly
- State South Carolina
- 90 Strongly Landlord-Friendly · R+6
- County
- — inherits STATE
- City
- — inherits STATE
ZIP-level market 29801
- Rents YoY
- 5.1%
- Active inventory
- 521
- Price-to-rent
- 9.7×
Monthly cashflow live
- Estimated rent
- $2,364 medium interval (Pro) →
- Mortgage (P&I)
- −$1,442
- Tax est. 1.5%
- −$344 /mo · $4,124/yr
- Insurance
- −$115
- HOA
- −$80
- Vacancy / Maint / Mgmt
- −$496
- Net cashflow
- $-112
Break-even live
UW: 25.0% down · 7.5% · 30yr · 1.5% tax · 5.0% vac · 8.0% maint · 8.0% mgmt
Financing live
Cash to close
- Down payment
- $68,725
- Closing costs
- $8,247
- Reserves months
- —
- Total cash needed
- —
Loan-product check · same deal, 3 products live
Conventional
25% down · 7.5% · 30yr
- Down + closing
- —
- Monthly P&I
- —
- Monthly cashflow
- —
- DSCR
- —
- Eligible?
- —
Personal DTI + credit; lowest rate.
DSCR
20% down · 8.5% · 30yr
- Down + closing
- —
- Monthly P&I
- —
- Monthly cashflow
- —
- DSCR
- —
- Eligible?
- —
No personal income docs; deal must DSCR.
Hard money
10% down · 12.0% · 12mo
- Down + closing
- —
- Monthly P&I
- —
- Monthly cashflow
- —
- DSCR
- —
- Eligible?
- —
Short-term bridge; refi at stabilization.
Rent comps 3 comps
| Address | Beds | Baths | Sqft | Rent | $/sqft | DOM | Units | Dist |
|---|---|---|---|---|---|---|---|---|
| 293 Mansell Park Aiken, SC | 4.0 | 2.5 | 2386 | $2,250 | $0.94 | 21d | 1 | 0.22mi |
| 860 Delta Ln Unit 860 Aiken, SC | 4.0 | 4.0 | 2336 | $2,100 | $0.90 | 14d | 1 | 0.36mi |
| 433 Whitby Ct Aiken, SC | 5.0 | 3.0 | 2378 | $2,495 | $1.05 | 21d | 1 | 0.43mi |
HOA detail
- Monthly dues
- $80 · $960/yr
- Likely covers
- pool
Listing history 6 events
-
2026-06-03remarks 693-char remark
-
2026-06-03pricestatusdays on market $274,900 Pending 205 DOM
-
2026-06-02days on market $269,900 Active 263 DOM
-
2026-06-01days on market $269,900 Active 262 DOM
-
2026-05-31remarks 392-char remark
-
2026-05-31$269,900 Active 261 DOM
ⓘ Source: listings_history table (triggers on properties + properties_extension) + one-shot
backfill from property_details.listing_events for pre-trigger history.
Nearby sold comps map
Loading sold comps map…
Walkable amenities ~0.75 mi
Loading nearby amenities…
Taxation est. · year 1
- Rental income
- $28,370
- − Mortgage interest
- −$15,399
- − Property taxes
- −$4,124
- − Insurance
- −$1,374
- − Repairs & maintenance
- −$2,270
- − Management
- −$2,270
- − HOA
- −$960
- − Depreciation
- −$7,997
- Taxable loss
- −$6,023
- Est. tax savings @ 24.0%
- +$1,446
- After-tax cash flow
- $100/yr
For passive investors: Depreciation is non-cash, so a rental often shows a tax loss while cash-flowing — sheltering income. Rental losses are passive: they offset passive income freely, and up to $25,000/yr can offset ordinary (W-2) income if you actively participate and your MAGI is under $100k (phasing out to $0 by $150k); unused losses carry forward. On sale, claimed depreciation is recaptured at up to 25%, and gains may owe capital-gains tax (a 1031 exchange can defer both). Figures are a year-1 estimate at your 24.0% rate — not tax advice; consult a CPA.
Schools (NCES district)
- District
- Aiken 01
- NCES district ID
- 4500720
- Math proficiency
- 31% ▼ -11.00%
- Reading proficiency
- 44% ▼ -1.00%
- Median HH income
- $45,081
- Composite
- 31.91/100
- National rank
- #5857
- State rank
- #36 of 80 in SC
Livability — Graniteville
- Score
- 59/100
- State rank
- #240
- US rank
- #19924
Category grades
Schools grade is shown separately in the Schools card above.
Census & demographics
- County
- Aiken County · 116,534 people
- City population
- 12,385
- Metro
- Augusta-Richmond County, GA-SC
- Population (ZIP)
- 31,108
- Household income
- $59,573
- Rent vs Own
- Severe rent burden
- 1260.0
Population outlook (Aiken County) Hauer SSP2
- Today (2025)
- 178,003 people
- By 2030
- 182,876 · +2.7%
- By 2040
- 189,970 · +6.7%
- By 2050
- 193,840 · +8.9%
- By 2075
- 199,453 · +12.1%
- By 2100
- 192,403 · +8.1%
Race, ethnicity, and origin ACS 2023
- Neighborhood character
- Diverse neighborhood (Simpson 0.57)
- Race & ethnicity
- White 50% Black 42% Hispanic / Latino 5% Two or more races 4% Asian 1%
- Hispanic origin (detail)
- Mexican 1% Puerto Rican 2%
- Common ancestry
- Slovak 2% Italian 1% Serbian 1%
- Foreign-born
- 3% · Canada, Jamaica
- Languages at home
- 95% English-only · Spanish 3% Other Indo-European 1%
Political lean MEDSL · Aiken
- 2024 margin
- Strong R (+25.9) · D 36.4% · R 62.2% · Other 1.4%
- 2008→2024 swing
- -1.9pp toward R · 2008: -24.0pp · 2024: -25.9pp
- All cycles
- 2024: R+25.9 2020: R+22.7 2016: R+27.5 2012: R+26.0 2008: R+24.0
Not yet ingested
- Civics
- —
Market trends
- HPI YoY
- ▼ -278.52%
- Current HPI
- 173.7944
- Rent YoY
- ▲ 5.06%
- Metro
- Augusta-Richmond County, GA-SC
- State GDP YoY
- ▲ 4.51%
- F500 in state
- 2
Industry mix (Fortune 500 HQ in SC)
| Industry | F500 HQs | Revenue |
|---|---|---|
| Packaging | 1 | $7B |
|
||
Cash-flow waterfall
monthlySold comps — $/sqft
last 12 mo · ≤1 miLoading sold comps…