90 Columbus Preece Rd · Inez, KY
Flood risk 7/10 · Major
- FEMA flood zone
- X (unshaded)
- Chance of flooding over 30 yrs
- 0.76%
- Est. flood insurance / yr
- $507 – $1,088
Fire risk 7/10 · Major
- Est. fire insurance / yr
- $839 – $1,559
Heat risk 4/10 · Minor
- Hot days now (above 100°F)
- 7 days/yr
- Hot days in 30 yrs
- 19 days/yr
Wind risk 2/10 · Minimal
- Chance of severe wind over 30 yrs
- 2.0%
Air-quality risk 1/10 · Minimal
- Unhealthy air days now
- 0 days/yr
- Unhealthy air days in 30 yrs
- 0 days/yr
Risk factors via First Street. Map © Google.
Why this score? — see what drove the B+ grade
The composite is a weighted blend of 9 inputs, each scored 0–100. Each bar is that input's sub-score; the figure is the points it added to the 100-point composite (weight × sub-score).
- Cash flow +30.0/30.0
- ARV discount +14.7/15.0
- 1% rule +10.0/10.0
- DSCR +10.0/10.0
- Appreciation +4.0/10.0
- Livability +3.2/5.0
- Rent growth +2.5/5.0
- Condition / age +2.2/5.0
- Schools +1.8/10.0
$60,000
🖨 Deal sheet (PDF) 📄 Offer letter ✓ Due diligence
Listing remarks MLS
Opportunity awaits with this 3-bedroom, 1.5-bath ranch home offering 1,125 sq ft of living space, perfectly situated on 7.78 acres of mixed terrain. Featuring a spacious, flat yard ideal for outdoor living, gardening, or expansion, this property is all about location and possibilities. This fixer-upper is perfect for investors, flippers, or buyers looking to create their dream home in a great location. Home is being sold in AS-IS condition. Per FEMA, NOT IN FLOOD ZONE MLS#128451
Key facts
- Not in flood zone
- Great location
- Spacious flat yard
Tags
Neighborhood map
What this means for you Summary
Snapshot
- This is a 3-bed/1.5-bath single-family listed at $60k. Condition is rated fair.
Deal economics
- At list price, monthly cash flow is $310 ($4k/yr) — positive.
- The deal already cash-flows at list — no discount required.
- Meets the 1% rule at list price ($970 rent vs $60k).
- Recommended offer: $58k (3.0% below list) — sets the bar for market timing.
Location & tenants
- Location reads 63/100 on livability (#322 in KY) — a middle-class / working-renter tenant base. Strengths: cost of living A+, housing A+, crime B+; Watch: employment D+, schools F, amenities F.
- Martin County (rural): math 15% / reading 31% proficiency, ranked #155 of 165 in KY (top 94%) — low school quality limits family demand, transient renter base, plan for 1-2y turnover.
- Market conditions: 14 active listings in the ZIP.
Forward outlook
- Local home prices are declining (-2.1%/yr); year-one equity from $415 of loan paydown is wiped out by about $1k of value loss. Plan a longer hold.
- Martin County population projected at -21% by 2050 — secular population decline; favor cash flow + early exit over multi-decade hold.
- At projected returns (-2.1% appreciation + 3.0% rent growth), your $17k cash investment doubles in ~5 years — after that, you're playing with house money.
Negotiation context
- It's been on market 39 days — a 3% lower offer ($58k) is reasonable based on typical stale-listing flexibility.
Risks & watch-outs
- Watch-outs: flood insurance adds $66/mo.
- Climate carrying-cost: major flood risk; major wildfire risk — expect insurance premiums to compound above CPI over the hold.
Questions for the listing agent
- It's been on market 39 days. Have you received any prior offers? Is the seller open to a 3% concession, seller financing, or rate buy-down credit?
- Have any recent inspections been done? Can we get a copy of the seller's disclosures and any deferred-maintenance estimates?
- What's the actual annual flood-insurance premium (NFIP or private), and is the property in a SFHA with mandatory coverage?
- Is there a deadline driving the sale (1031 exchange, divorce, estate, relocation)? That informs how much negotiation room exists.
- Schools are F-rated, which usually means shorter tenancies and higher turnover. Who's the typical renter profile here, and what's been the actual vacancy rate?
- What's the average days-on-market for RENTAL listings here right now (not sales)? A rising rental-DOM trend means longer vacancies and softer asking-rent achievability than the comps imply.
- What's the recent tenant-quality profile in this submarket — average credit score on applications, eviction rate, late-payment / NSF rate, and stable-employment percentage? A property-management company in the area should have these aggregated.
- How much new for-sale + rental construction is in the pipeline within 1–3 miles? Heavy new supply typically softens prices + rents 12–24 months out; constrained supply supports both.
Investment metrics
- 1% rule
- 1.62% ✓
- Cap rate
- 13.82%
- Cash-on-cash
- 26.89%
- DSCR
- 2.20
- GRM
- 5.2
CMA / ARV
- ARV (median comp)
- $71,344
- List price
- $60,000
- Delta
- -15.90%
- Verdict
- UNDERPRICED
- Comps
- 6 within 1.0 mi
Show comp detail 4 sales within ~0.75 mi
| Address | Dist | Beds/Ba | Sqft | Sold | Price | $/sf | Match |
|---|---|---|---|---|---|---|---|
| 90 Columbus Preece Rd | 0.00mi | 3/1.5 | 1,125 (+2%) | 0mo | $50,000 | $44 | 96 |
| 115 Hardinville Rd | 0.53mi | 3/1.0 | 1,123 (+2%) | 7mo | $45,000 | $40 | 64 |
| 1402 E Main St | 0.52mi | 4/2.0 (+1) | 1,260 (+14%) | 6mo | $75,000 | $60 | 39 |
| 1374 E Main St | 0.52mi | 2/1.0 (-1) | 1,004 (-9%) | 24mo | $64,000 | $64 | 34 |
Match score weights: distance 35% · size 25% · config 20% · recency 20%. Top-matched comps best support the ARV.
Projected returns pro-forma
-2.06% appreciation · 3.0% rent growth · sell at horizon
- IRR
- 17.3%
- Equity multiple
- 1.74×
- Total profit
- $12,460
- Equity at exit
- $11,501
- IRR
- 24.5%
- Equity multiple
- 3.30×
- Total profit
- $38,568
- Equity at exit
- $9,684
Cash invested: $16,800 (down + closing). Projections, not guarantees.
Landlord ↔ Tenant lean methodology
- Overall (STATE)
- 83 Strongly Landlord-Friendly
- State Kentucky
- 83 Strongly Landlord-Friendly · R+16
- County
- — inherits STATE
- City
- — inherits STATE
ZIP-level market 41224
- Home prices YoY
- -1.4%
- Active inventory
- 14
- Price-to-rent
- 5.2×
Monthly cashflow live
- Estimated rent
- $970 medium interval (Pro) →
- Mortgage (P&I)
- −$315
- Tax from tax record
- −$50 /mo · $604/yr
- Insurance
- −$25
- Flood insurance flood zone
- −$66 /mo · $798/yr
- HOA
- −$0
- Vacancy / Maint / Mgmt
- −$204
- Net cashflow
- $310
Break-even live
Sensitivity live
| Price | -10% $344 | -5% $327 | +0% $310 | +5% $293 | +10% $276 |
|---|---|---|---|---|---|
| Rent | -10% $233 | -5% $272 | +0% $310 | +5% $348 | +10% $387 |
| Rate | -1.0pp $340 | -0.5pp $325 | base $310 | +0.5pp $294 | +1.0pp $279 |
UW: 25.0% down · 7.5% · 30yr · 1.5% tax · 5.0% vac · 8.0% maint · 8.0% mgmt
Financing live
Cash to close
- Down payment
- $15,000
- Closing costs
- $1,800
- Reserves months
- —
- Total cash needed
- —
Loan-product check · same deal, 3 products live
Conventional
25% down · 7.5% · 30yr
- Down + closing
- —
- Monthly P&I
- —
- Monthly cashflow
- —
- DSCR
- —
- Eligible?
- —
Personal DTI + credit; lowest rate.
DSCR
20% down · 8.5% · 30yr
- Down + closing
- —
- Monthly P&I
- —
- Monthly cashflow
- —
- DSCR
- —
- Eligible?
- —
No personal income docs; deal must DSCR.
Hard money
10% down · 12.0% · 12mo
- Down + closing
- —
- Monthly P&I
- —
- Monthly cashflow
- —
- DSCR
- —
- Eligible?
- —
Short-term bridge; refi at stabilization.
Listing history 2 events
-
2026-05-17status Pending 484-char remark
Show marketing remark (484 chars)
Opportunity awaits with this 3-bedroom, 1.5-bath ranch home offering 1,125 sq ft of living space, perfectly situated on 7.78 acres of mixed terrain. Featuring a spacious, flat yard ideal for outdoor living, gardening, or expansion, this property is all about location and possibilities. This fixer-upper is perfect for investors, flippers, or buyers looking to create their dream home in a great location. Home is being sold in AS-IS condition. Per FEMA, NOT IN FLOOD ZONE MLS#128451
-
2026-04-08$60,000 Active 484-char remark
Show marketing remark (484 chars)
Opportunity awaits with this 3-bedroom, 1.5-bath ranch home offering 1,125 sq ft of living space, perfectly situated on 7.78 acres of mixed terrain. Featuring a spacious, flat yard ideal for outdoor living, gardening, or expansion, this property is all about location and possibilities. This fixer-upper is perfect for investors, flippers, or buyers looking to create their dream home in a great location. Home is being sold in AS-IS condition. Per FEMA, NOT IN FLOOD ZONE MLS#128451
ⓘ Source: listings_history table (triggers on properties + properties_extension) + one-shot
backfill from property_details.listing_events for pre-trigger history.
Tax reassessment forecast KY · Resets to sale price
- Current annual tax
- $604 · $50/mo
- Projected year-2 tax
- $604 · $50/mo
- Expected delta
- $0/yr ($0/mo · 0.0%)
ⓘ Screening estimate from a state-policy table — verify with the county assessor before closing.
Climate risk First Street
- Flood 7/10 Severe FEMA zone X (unshaded) · 76% chance over 30 yrs
- Wildfire 7/10 Severe
- Heat 4/10 Moderate 7 d/yr ≥100°F today · 19 d/yr by 30 yrs out
- Wind 2/10 Low 2% chance of damaging wind over 30 yrs
- Air quality 1/10 Low 0 unhealthy d/yr today · 0 by 30 yrs out
Nearby sold comps map
Loading sold comps map…
Walkable amenities ~0.75 mi
Loading nearby amenities…
Taxation est. · year 1
- Rental income
- $11,641
- − Mortgage interest
- −$3,361
- − Property taxes
- −$604
- − Insurance
- −$1,098
- − Repairs & maintenance
- −$931
- − Management
- −$931
- − Depreciation
- −$1,745
- Taxable income
- $2,971
- Est. tax owed @ 24.0%
- −$713
- After-tax cash flow
- $3,006/yr
For passive investors: Depreciation is non-cash, so a rental often shows a tax loss while cash-flowing — sheltering income. Rental losses are passive: they offset passive income freely, and up to $25,000/yr can offset ordinary (W-2) income if you actively participate and your MAGI is under $100k (phasing out to $0 by $150k); unused losses carry forward. On sale, claimed depreciation is recaptured at up to 25%, and gains may owe capital-gains tax (a 1031 exchange can defer both). Figures are a year-1 estimate at your 24.0% rate — not tax advice; consult a CPA.
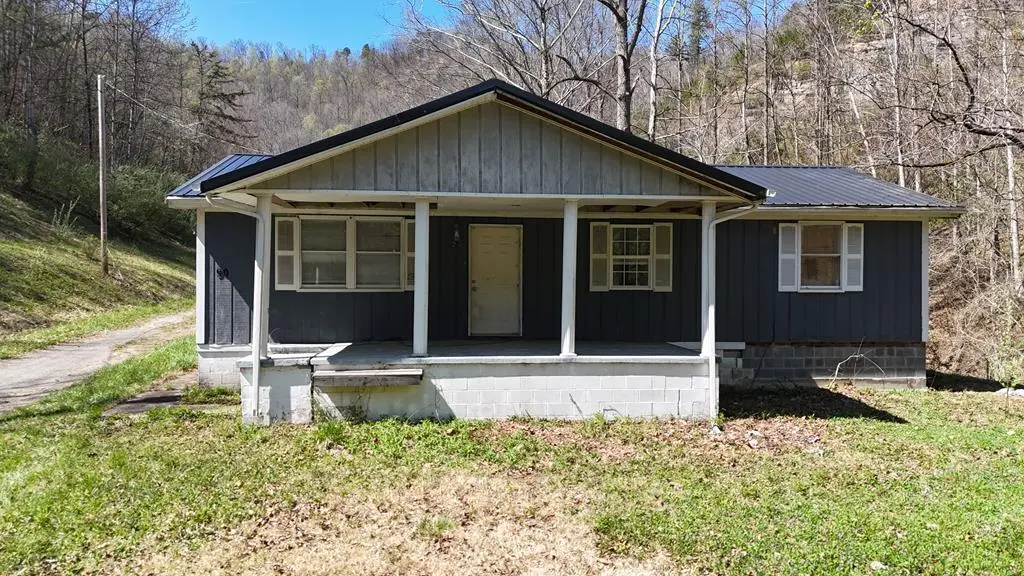
Condition & rehab AI · 1 photo
This 3-bedroom ranch home requires moderate renovations to improve its exterior and interior condition, enhancing its resale and rental value.
Repairs flagged
- Major exterior siding — Significant wear and tear
- Major porch flooring — Worn-out and uneven
- Major interior walls — Painted walls show significant wear
Value-add opportunities
- Both repair and paint exterior siding — Enhances curb appeal and value
- Both repair and paint interior walls — Improves interior appearance and value
- Both replace porch flooring — Enhances usability and value
Renovation cost estimate screening
| Repair item | Severity | Est. cost |
|---|---|---|
| exterior siding · Significant wear and tear | Major | $15,000–50,000 |
| porch flooring · Worn-out and uneven | Major | $15,000–50,000 |
| interior walls · Painted walls show significant wear | Major | $15,000–50,000 |
| Total estimated repair cost · 3 items | $45,000–150,000 |
Value-add ROI direction
- Both repair and paint exterior siding — Enhances curb appeal and value ↑
- Both repair and paint interior walls — Improves interior appearance and value ↑
- Both replace porch flooring — Enhances usability and value ↑
ⓘ Cost ranges are severity-bucket heuristics (US national rule-of-thumb). Get contractor quotes + a written scope before underwriting a rehab budget.
Schools (NCES district)
- District
- Martin County
- NCES district ID
- 2103840
- Math proficiency
- 15% ▼ -20.00%
- Reading proficiency
- 31% ▼ -21.00%
- Median HH income
- $28,846
- Composite
- 18.31/100
- National rank
- #8951
- State rank
- #155 of 165 in KY
Livability — Inez
- Score
- 63/100
- State rank
- #322
- US rank
- #15411
Category grades
Schools grade is shown separately in the Schools card above.
Census & demographics
- Population (ZIP)
- 4,536
Population outlook (Martin County) Hauer SSP2
- Today (2025)
- 11,561 people
- By 2030
- 11,118 · -3.8%
- By 2040
- 10,125 · -12.4%
- By 2050
- 9,088 · -21.4%
- By 2075
- 7,063 · -38.9%
- By 2100
- 5,580 · -51.7%
Race, ethnicity, and origin ACS 2023
- Neighborhood character
- Predominantly White (75%)
- Race & ethnicity
- White 75% Black 18% Hispanic / Latino 5% Two or more races 2% Native American 1%
- Common ancestry
- Slovak 3% Greek 1% Serbian 1%
- Foreign-born
- 2% · Canada
- Languages at home
- 97% English-only · Spanish 2%
Political lean MEDSL · Martin
- 2024 margin
- Solid R (+83.6) · D 7.8% · R 91.5%
- 2008→2024 swing
- -29.0pp toward R · 2008: -54.6pp · 2024: -83.6pp
- All cycles
- 2024: R+83.6 2020: R+78.6 2016: R+79.5 2012: R+68.2 2008: R+54.6
Not yet ingested
- Civics
- —
Market trends
- HPI YoY
- ▼ -2.06%
- Current HPI
- 150.7602
- Rent YoY
- —
- Metro
- —
- State GDP YoY
- ▲ 1.81%
- F500 in state
- 4
Industry mix (Fortune 500 HQ in KY)
| Industry | F500 HQs | Revenue |
|---|---|---|
| Healthcare | 1 | $118B |
|
||
| Food / Beverage | 1 | $7B |
|
||
Price history
2 events — show timeline
- 2026-05-17 Pending — EKAR
- 2026-04-08 Listed $60,000 EKAR
Property tax history
-0.2%/yrLatest (2025): $604 · -0.2% YoY. Source: county tax records.
Cash-flow waterfall
monthlySold comps — $/sqft
last 12 mo · ≤1 miLoading sold comps…