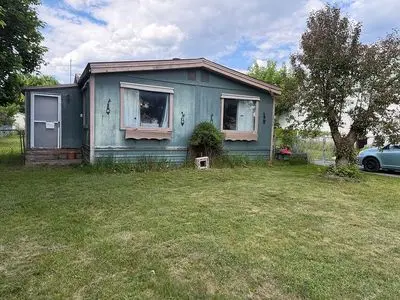
1008 W Main Ave · Chewelah, WA
Flood risk 1/10 · Minimal
- FEMA flood zone
- X
- Chance of flooding over 30 yrs
- 0.0%
- Est. flood insurance / yr
- $507 – $1,088
Fire risk 4/10 · Minor
- Est. fire insurance / yr
- $604 – $1,122
Heat risk 3/10 · Minor
- Hot days now (above 96°F)
- 7 days/yr
- Hot days in 30 yrs
- 16 days/yr
Wind risk 1/10 · Minimal
- Chance of severe wind over 30 yrs
- —
Air-quality risk 9/10 · Severe
- Unhealthy air days now
- 14 days/yr
- Unhealthy air days in 30 yrs
- 16 days/yr
Risk factors via First Street. Map © Google.
Why this score? — see what drove the B- grade
The composite is a weighted blend of 9 inputs, each scored 0–100. Each bar is that input's sub-score; the figure is the points it added to the 100-point composite (weight × sub-score).
- Cash flow +24.1/30.0
- ARV discount +15.0/15.0
- DSCR +7.8/10.0
- 1% rule +5.7/10.0
- Schools +4.4/10.0
- Livability +3.9/5.0
- Rent growth +2.5/5.0
- Condition / age +2.5/5.0
- Appreciation +0.0/10.0
$100,000
🖨 Deal sheet 📄 Offer letter ✓ Due diligence
Listing remarks MLS
Well maintained doublewide manufactured home with fenced yard, oversize single garage and paved driveway. Seller is licensed agent. SEE OUR VIRTUAL TOUR AT www. cbsells.com
Key facts
- Built 1976
- Listed 21 days
Neighborhood map
What this means for you Summary
Snapshot
- This is a 3-bed/2.0-bath manufactured listed at $100k.
Deal economics
- At list price, monthly cash flow is $197 ($2k/yr) — positive.
- The deal already cash-flows at list — no discount required.
- Meets the 1% rule at list price ($1k rent vs $100k).
- Recommended offer: $98k (1.5% below list) — sets the bar for market timing.
- Cap rate 8.7% vs local median 1.7% in Chewelah — top-decile yield for the area; either an underpriced asset or a hidden risk that comps aren't pricing in. Stress-test before assuming the spread holds.
Location & tenants
- Location reads 78/100 on livability (#116 in WA, #2,374 nationally) — a middle-class / working-renter tenant base. Strengths: amenities A+, cost of living A+, housing A+; Watch: employment D+, commute F.
- Chewelah School District (rural): math 39% / reading 63% proficiency, ranked #153 of 291 in WA (top 53%) — acceptable for families but not a draw, mixed tenant base, ~2y average lease.
- Market conditions: 132 active listings in the ZIP; 3 comparable units currently listed for rent nearby; rentals at typical pace (median 15d on market — plan ~3-4 weeks tenant-placement turnaround); 341 units permitted in Stevens County in 2024 (72 in 5+ unit buildings).
Forward outlook
- Local home prices are declining (-3.0%/yr); year-one equity from $691 of loan paydown is wiped out by about $3k of value loss. Plan a longer hold.
- Stevens County population projected at -12% by 2050 — secular population decline; favor cash flow + early exit over multi-decade hold.
Negotiation context
- It's been on market 22 days — a 2% lower offer ($98k) is reasonable based on typical stale-listing flexibility.
- 2 sale attempts since 24y ago; this cycle's ask has dropped $15k (13%) from the opening price — seller is motivated, your offer sets the floor, not the list.
- Current owner paid $65k; list at $100k implies a 54% gain — meaningful room to come down on a strong offer.
Questions for the listing agent
- Built in 1976 — when were the roof, HVAC, electrical panel, plumbing, and water heater last replaced?
- Is there a deadline driving the sale (1031 exchange, divorce, estate, relocation)? That informs how much negotiation room exists.
- What's the average days-on-market for RENTAL listings here right now (not sales)? A rising rental-DOM trend means longer vacancies and softer asking-rent achievability than the comps imply.
- What's the recent tenant-quality profile in this submarket — average credit score on applications, eviction rate, late-payment / NSF rate, and stable-employment percentage? A property-management company in the area should have these aggregated.
- How much new for-sale + rental construction is in the pipeline within 1–3 miles? Heavy new supply typically softens prices + rents 12–24 months out; constrained supply supports both.
Investment metrics
- 1% rule
- 1.07% ✓
- Cap rate
- 8.66%
- Cash-on-cash
- 8.45%
- DSCR
- 1.38
- GRM
- 7.8
CMA / ARV
- ARV (on-the-fly)
- $161,280
- Comps found
- 1
Show comp detail 1 sale within ~0.75 mi
| Address | Dist | Beds/Ba | Sqft | Sold | Price | $/sf | Match |
|---|---|---|---|---|---|---|---|
| 304 S Kruger St | 0.28mi | 3/2.0 | 1,248 (+8%) | 3mo | $175,000 | $140 | 70 |
Match score weights: distance 35% · size 25% · config 20% · recency 20%. Top-matched comps best support the ARV.
Projected returns pro-forma
-3.0% appreciation · 3.0% rent growth · sell at horizon
- IRR
- -3.5%
- Equity multiple
- 0.87×
- Total profit
- $-3,661
- Equity at exit
- $14,910
- IRR
- 6.2%
- Equity multiple
- 1.46×
- Total profit
- $12,937
- Equity at exit
- $8,646
Cash invested: $28,000 (down + closing). Projections, not guarantees.
Landlord ↔ Tenant lean methodology
- Overall (STATE)
- 28 Tenant-Leaning
- State Washington
- 28 Tenant-Leaning · D+8
- County
- — inherits STATE
- City
- — inherits STATE
ZIP-level market 99109
- Home prices YoY
- -19.2%
- Active inventory
- 132
- Price-to-rent
- 7.8×
Monthly cashflow live
- Estimated rent
- $1,071 medium interval (Pro) →
- Mortgage (P&I)
- −$524
- Tax from tax record
- −$83 /mo · $993/yr
- Insurance
- −$42
- HOA
- −$0
- Vacancy / Maint / Mgmt
- −$225
- Net cashflow
- $197
Break-even live
Sensitivity live
| Price | -10% $254 | -5% $225 | +0% $197 | +5% $169 | +10% $140 |
|---|---|---|---|---|---|
| Rent | -10% $113 | -5% $155 | +0% $197 | +5% $239 | +10% $282 |
| Rate | -1.0pp $247 | -0.5pp $223 | base $197 | +0.5pp $171 | +1.0pp $145 |
UW: 25.0% down · 7.5% · 30yr · 1.5% tax · 5.0% vac · 8.0% maint · 8.0% mgmt
Financing live
Cash to close
- Down payment
- $25,000
- Closing costs
- $3,000
- Reserves months
- —
- Total cash needed
- —
Loan-product check · same deal, 3 products live
Conventional
25% down · 7.5% · 30yr
- Down + closing
- —
- Monthly P&I
- —
- Monthly cashflow
- —
- DSCR
- —
- Eligible?
- —
Personal DTI + credit; lowest rate.
DSCR
20% down · 8.5% · 30yr
- Down + closing
- —
- Monthly P&I
- —
- Monthly cashflow
- —
- DSCR
- —
- Eligible?
- —
No personal income docs; deal must DSCR.
Hard money
10% down · 12.0% · 12mo
- Down + closing
- —
- Monthly P&I
- —
- Monthly cashflow
- —
- DSCR
- —
- Eligible?
- —
Short-term bridge; refi at stabilization.
Rent comps 3 comps
| Address | Beds | Baths | Sqft | Rent | $/sqft | DOM | Units | Dist |
|---|---|---|---|---|---|---|---|---|
| 1108 W Clay Ave Unit 2 Chewelah, WA | 2.0 | 1.0 | 900 | $1,045 | $1.16 | 44d | 1 | 0.11mi |
| 202 N Baker St Unit 1 Chewelah, WA | 2.0 | 1.0 | 800 | $1,020 | $1.27 | 14d | 1 | 0.12mi |
| 202 W Main Ave Unit B Chewelah, WA | 2.0 | 1.0 | 975 | $1,350 | $1.38 | 14d | 1 | 0.51mi |
Listing history 19 events
-
2026-06-18days on market $100,000 Active 22 DOM
-
2026-06-17days on market $100,000 Active 21 DOM
-
2026-06-16pricedays on market $100,000 Active 20 DOM
-
2026-06-15days on market $115,000 Active 19 DOM
-
2026-06-15days on market $115,000 Active 18 DOM
-
2026-06-13days on market $115,000 Active 17 DOM
-
2026-06-12days on market $115,000 Active 16 DOM
-
2026-06-09days on market $115,000 Active 13 DOM
-
2026-06-08days on market $115,000 Active 12 DOM
-
2026-06-08days on market $115,000 Active 11 DOM
-
2026-06-07days on market $115,000 Active 10 DOM
-
2026-06-03days on market $115,000 Active 7 DOM
-
2026-06-02days on market $115,000 Active 6 DOM
-
2026-06-01days on market $115,000 Active 5 DOM
-
2026-05-31days on market $115,000 Active 4 DOM
-
2026-05-28$115,000 Active
-
2002-06-07soldstatus $65,000 172-char remark
Show marketing remark (172 chars)
Well maintained doublewide manufactured home with fenced yard, oversize single garage and paved driveway. Seller is licensed agent. SEE OUR VIRTUAL TOUR AT www. cbsells.com
-
2002-06-07soldstatus $65,000
Show marketing remark (172 chars)
Well maintained doublewide manufactured home with fenced yard, oversize single garage and paved driveway. Seller is licensed agent. SEE OUR VIRTUAL TOUR AT www. cbsells.com
-
2002-04-03$65,000 172-char remark
Show marketing remark (172 chars)
Well maintained doublewide manufactured home with fenced yard, oversize single garage and paved driveway. Seller is licensed agent. SEE OUR VIRTUAL TOUR AT www. cbsells.com
ⓘ Source: listings_history table (triggers on properties + properties_extension) + one-shot
backfill from property_details.listing_events for pre-trigger history.
Tax reassessment forecast WA · Resets to sale price
- Current annual tax
- $993 · $83/mo
- Projected year-2 tax
- $993 · $83/mo
- Expected delta
- $0/yr ($0/mo · 0.0%)
ⓘ Screening estimate from a state-policy table — verify with the county assessor before closing.
Climate risk First Street
- Flood 1/10 Low FEMA zone X · 0% chance over 30 yrs
- Wildfire 4/10 Moderate
- Heat 3/10 Moderate 7 d/yr ≥96°F today · 16 d/yr by 30 yrs out
- Wind 1/10 Low
- Air quality 9/10 Extreme 14 unhealthy d/yr today · 16 by 30 yrs out
Nearby sold comps map
Loading sold comps map…
Walkable amenities ~0.75 mi
Loading nearby amenities…
Taxation est. · year 1
- Rental income
- $12,850
- − Mortgage interest
- −$5,602
- − Property taxes
- −$993
- − Insurance
- −$500
- − Repairs & maintenance
- −$1,028
- − Management
- −$1,028
- − Depreciation
- −$2,909
- Taxable income
- $790
- Est. tax owed @ 24.0%
- −$190
- After-tax cash flow
- $2,176/yr
For passive investors: Depreciation is non-cash, so a rental often shows a tax loss while cash-flowing — sheltering income. Rental losses are passive: they offset passive income freely, and up to $25,000/yr can offset ordinary (W-2) income if you actively participate and your MAGI is under $100k (phasing out to $0 by $150k); unused losses carry forward. On sale, claimed depreciation is recaptured at up to 25%, and gains may owe capital-gains tax (a 1031 exchange can defer both). Figures are a year-1 estimate at your 24.0% rate — not tax advice; consult a CPA.
Schools (NCES district)
- District
- Chewelah School District
- NCES district ID
- 5301260
- Math proficiency
- 39% ▼ -9.00%
- Reading proficiency
- 63% ▬ 0.00%
- Median HH income
- $36,173
- Composite
- 44.23/100
- National rank
- #6191
- State rank
- #153 of 291 in WA
Livability — Chewelah
- Score
- 78/100
- State rank
- #116
- US rank
- #2374
Category grades
Schools grade is shown separately in the Schools card above.
Census & demographics
- Census place
- Chewelah, WA
- Population (ZIP)
- 5,075
Population outlook (Stevens County) Hauer SSP2
- Today (2025)
- 43,696 people
- By 2030
- 43,203 · -1.1%
- By 2040
- 41,190 · -5.7%
- By 2050
- 38,231 · -12.5%
- By 2075
- 31,260 · -28.5%
- By 2100
- 22,931 · -47.5%
Race, ethnicity, and origin ACS 2023
- Neighborhood character
- Predominantly White (84%)
- Race & ethnicity
- White 84% Two or more races 8% Native American 3% Hispanic / Latino 2% Pacific Islander 1%
- Common ancestry
- Portuguese 6% Italian 4% Lithuanian 2%
- Foreign-born
- 1% · Canada
- Languages at home
- 98% English-only · Spanish 1%
Political lean MEDSL · Stevens
- 2024 margin
- Solid R (+44.1) · D 26.7% · R 70.8% · Other 2.5%
- 2008→2024 swing
- -23.4pp toward R · 2008: -20.7pp · 2024: -44.1pp
- All cycles
- 2024: R+44.1 2020: R+42.1 2016: R+40.8 2012: R+27.7 2008: R+20.7
Not yet ingested
- Civics
- —
Market trends
- HPI YoY
- ▼ -74.63%
- Current HPI
- 313.3997
- Rent YoY
- —
- Metro
- —
- State GDP YoY
- ▲ 4.65%
- F500 in state
- 22
Industry mix (Fortune 500 HQ in WA)
| Industry | F500 HQs | Revenue |
|---|---|---|
| Retail | 2 | $269B |
|
||
| Technology / Retail | 1 | $638B |
|
||
| Technology | 1 | $245B |
|
||
| Telecommunications | 1 | $38B |
|
||
| Food / Beverage | 1 | $36B |
|
||
| Automotive / Trucks | 1 | $34B |
|
||
Price history
+76.9% since first listed4 events — show timeline
- 2026-05-28 Listed $115,000 FSBO.com
- 2002-06-07 Sold (Public Records) $65,000 Public Records
- 2002-06-07 Sold (MLS) $65,000 NEWMLS
- 2002-04-03 Listed $65,000 NEWMLS
Property tax history
+4.1%/yrLatest (2026): $993 · +1.5% YoY. Source: county tax records.
Cash-flow waterfall
monthlySold comps — $/sqft
last 12 mo · ≤1 miLoading sold comps…