2924 Dune Rd · Lake Lafayette, MO
Flood risk 1/10 · Minimal
- FEMA flood zone
- X (unshaded)
- Chance of flooding over 30 yrs
- 0.0%
- Est. flood insurance / yr
- $473 – $860
Fire risk 4/10 · Minor
- Est. fire insurance / yr
- $1,054 – $1,958
Heat risk 4/10 · Minor
- Hot days now (above 107°F)
- 7 days/yr
- Hot days in 30 yrs
- 16 days/yr
Wind risk 2/10 · Minimal
- Chance of severe wind over 30 yrs
- 0.0%
Air-quality risk 2/10 · Minimal
- Unhealthy air days now
- 0 days/yr
- Unhealthy air days in 30 yrs
- 1 days/yr
Risk factors via First Street. Map © Google.
Why this score? — see what drove the C grade
The composite is a weighted blend of 9 inputs, each scored 0–100. Each bar is that input's sub-score; the figure is the points it added to the 100-point composite (weight × sub-score).
- Cash flow +25.1/30.0
- DSCR +8.2/10.0
- ARV discount +7.5/15.0
- 1% rule +6.6/10.0
- Schools +3.5/10.0
- Rent growth +2.5/5.0
- Livability +2.5/5.0
- Condition / age +2.5/5.0
- Appreciation +0.0/10.0
$140,000
🖨 Deal sheet 📄 Offer letter ✓ Due diligence
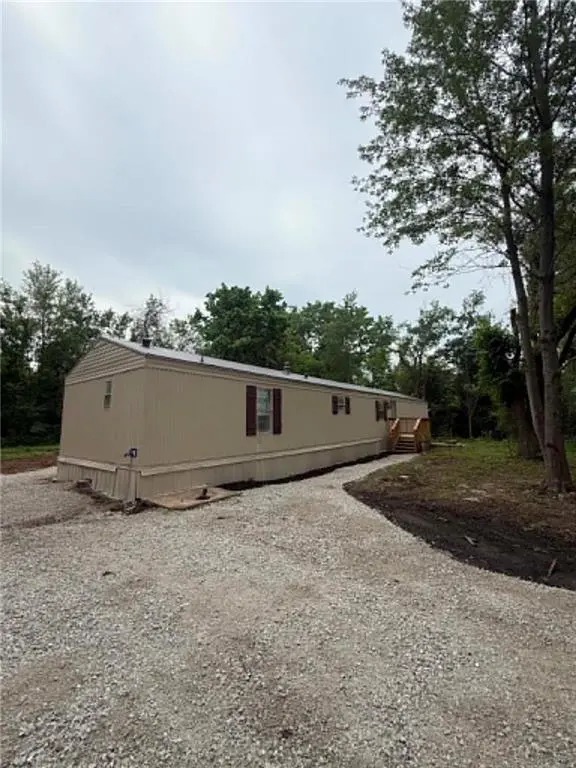
Listing remarks
Take a look at this beautifully remodeled 3-bedroom, 2-bath home in the Odessa R-VII School District, featuring new flooring, new carpet, an updated kitchen with a new sink, and a new washer & dryer included. This move-in-ready home sits just 5 minutes from the 90-acre Odessa City Lake, offering fishing, trails, and peaceful views. Easy access to I-70 and Hwy 50 provides a convenient commute while still enjoying affordable country living. Affidavit of affixation on file! Schedule your showing today!
Key facts
- New carpet
- New flooring
- New sink
Tags
Property features AI
Finance
- Other: Lot is level and wooded; Lot on gravel road; Lot size about 0.29 acres; Not in flood plain; Directions: From Hwy 131 north, right on Newton Rd, ~2 miles, left on Dune Dr (no road sign). If you pass Kite Rd you went too far.
- HOA & community: No association fees; No maintenance provided
Exterior
- Parking: Other parking
- Security: Smoke detector(s)
- Utilities: Public water; Septic tank; Cable available
- Home design: Manufactured single-family residence; Living area approximately 1,140; 21–30 years old
- Construction: Metal siding; Metal roof
- Exterior features: Porch; Shed(s); Fenced (other)
Interior
- Kitchen: Dishwasher; Gas range
- Bedrooms: 3 bedrooms
- Flooring: Carpet; Other
- Bathrooms: 2 full bathrooms
- Heating & cooling: Propane heating; Electric cooling (has cooling)
- Interior features: Ceiling fans; Vaulted ceilings; Kit/Dining combo
- Laundry & utility: Separate laundry room; Washer; Dryer
Neighborhood map
What this means for you Summary
Snapshot
- This is a 3-bed/2.0-bath manufactured listed at $140k.
Deal economics
- At list price, monthly cash flow is $310 ($4k/yr) — positive.
- The deal already cash-flows at list — no discount required.
- Meets the 1% rule at list price ($2k rent vs $140k).
- Recommended offer: $138k (1.5% below list) — sets the bar for market timing.
Location & tenants
- Location reads 50/100 on livability (#907 in MO) — a working-class tenant base; expect higher turnover. Strengths: cost of living A+, housing A+; Watch: schools F, crime F, amenities F.
- Odessa R-VII (town): math 34% / reading 48% proficiency, ranked #123 of 324 in MO (top 38%) — families likely to look elsewhere, expect single-tenant / working-renter base with shorter leases.
- Market conditions: 146 active listings in the ZIP; 112 units permitted in Lafayette County in 2024 (0 in 5+ unit buildings).
Forward outlook
- Local home prices are declining (-3.0%/yr); year-one equity from $968 of loan paydown is wiped out by about $4k of value loss. Plan a longer hold.
- Lafayette County population projected at -21% by 2050 — secular population decline; favor cash flow + early exit over multi-decade hold.
Negotiation context
- It's been on market 16 days — a 2% lower offer ($138k) is reasonable based on typical stale-listing flexibility.
Questions for the listing agent
- Is there a deadline driving the sale (1031 exchange, divorce, estate, relocation)? That informs how much negotiation room exists.
- Schools are F-rated, which usually means shorter tenancies and higher turnover. Who's the typical renter profile here, and what's been the actual vacancy rate?
- Crime grade is F in this area — have there been break-ins, vandalism, or insurance claims at this property in the last 3 years? What carrier currently insures it and at what premium?
- What's the average days-on-market for RENTAL listings here right now (not sales)? A rising rental-DOM trend means longer vacancies and softer asking-rent achievability than the comps imply.
- What's the recent tenant-quality profile in this submarket — average credit score on applications, eviction rate, late-payment / NSF rate, and stable-employment percentage? A property-management company in the area should have these aggregated.
- How much new for-sale + rental construction is in the pipeline within 1–3 miles? Heavy new supply typically softens prices + rents 12–24 months out; constrained supply supports both.
Investment metrics
- 1% rule
- 1.16% ✓
- Cap rate
- 8.95%
- Cash-on-cash
- 9.49%
- DSCR
- 1.42
- GRM
- 7.2
CMA / ARV
No comps found within radius.
Projected returns pro-forma
-3.0% appreciation · 3.0% rent growth · sell at horizon
- IRR
- -2.0%
- Equity multiple
- 0.93×
- Total profit
- $-2,916
- Equity at exit
- $20,874
- IRR
- 7.7%
- Equity multiple
- 1.59×
- Total profit
- $22,986
- Equity at exit
- $12,105
Cash invested: $39,200 (down + closing). Projections, not guarantees.
Landlord ↔ Tenant lean methodology
- Overall (STATE)
- 81 Strongly Landlord-Friendly
- State Missouri
- 81 Strongly Landlord-Friendly · R+10
- County
- — inherits STATE
- City
- — inherits STATE
ZIP-level market 64076
- Home prices YoY
- -18.0%
- Active inventory
- 146
- Price-to-rent
- 7.2×
Monthly cashflow live
- Estimated rent
- $1,617 medium interval (Pro) →
- Mortgage (P&I)
- −$734
- Tax est. 1.5%
- −$175 /mo · $2,100/yr
- Insurance
- −$58
- HOA
- −$0
- Vacancy / Maint / Mgmt
- −$340
- Net cashflow
- $310
Break-even live
UW: 25.0% down · 7.5% · 30yr · 1.5% tax · 5.0% vac · 8.0% maint · 8.0% mgmt
Financing live
Cash to close
- Down payment
- $35,000
- Closing costs
- $4,200
- Reserves months
- —
- Total cash needed
- —
Loan-product check · same deal, 3 products live
Conventional
25% down · 7.5% · 30yr
- Down + closing
- —
- Monthly P&I
- —
- Monthly cashflow
- —
- DSCR
- —
- Eligible?
- —
Personal DTI + credit; lowest rate.
DSCR
20% down · 8.5% · 30yr
- Down + closing
- —
- Monthly P&I
- —
- Monthly cashflow
- —
- DSCR
- —
- Eligible?
- —
No personal income docs; deal must DSCR.
Hard money
10% down · 12.0% · 12mo
- Down + closing
- —
- Monthly P&I
- —
- Monthly cashflow
- —
- DSCR
- —
- Eligible?
- —
Short-term bridge; refi at stabilization.
Listing history 12 events
-
2026-06-19days on market $140,000 Active 16 DOM
-
2026-06-18days on market $140,000 Active 15 DOM
-
2026-06-17days on market $140,000 Active 14 DOM
-
2026-06-16days on market $140,000 Active 13 DOM
-
2026-06-15days on market $140,000 Active 12 DOM
-
2026-06-14days on market $140,000 Active 10 DOM
-
2026-06-12pricedays on market $140,000 Active 9 DOM
-
2026-06-09days on market $155,000 Active 6 DOM
-
2026-06-08days on market $155,000 Active 5 DOM
-
2026-06-07days on market $155,000 Active 4 DOM
-
2026-06-03remarks 506-char remark
-
2026-06-03$155,000 Active 1 DOM
ⓘ Source: listings_history table (triggers on properties + properties_extension) + one-shot
backfill from property_details.listing_events for pre-trigger history.
Climate risk First Street
- Flood 1/10 Low FEMA zone X (unshaded) · 0% chance over 30 yrs
- Wildfire 4/10 Moderate
- Heat 4/10 Moderate 7 d/yr ≥107°F today · 16 d/yr by 30 yrs out
- Wind 2/10 Low 0% chance of damaging wind over 30 yrs
- Air quality 2/10 Low 0 unhealthy d/yr today · 1 by 30 yrs out
Nearby sold comps map
Loading sold comps map…
Walkable amenities ~0.75 mi
Loading nearby amenities…
Taxation est. · year 1
- Rental income
- $19,406
- − Mortgage interest
- −$7,842
- − Property taxes
- −$2,100
- − Insurance
- −$700
- − Repairs & maintenance
- −$1,552
- − Management
- −$1,552
- − Depreciation
- −$4,073
- Taxable income
- $1,586
- Est. tax owed @ 24.0%
- −$381
- After-tax cash flow
- $3,340/yr
For passive investors: Depreciation is non-cash, so a rental often shows a tax loss while cash-flowing — sheltering income. Rental losses are passive: they offset passive income freely, and up to $25,000/yr can offset ordinary (W-2) income if you actively participate and your MAGI is under $100k (phasing out to $0 by $150k); unused losses carry forward. On sale, claimed depreciation is recaptured at up to 25%, and gains may owe capital-gains tax (a 1031 exchange can defer both). Figures are a year-1 estimate at your 24.0% rate — not tax advice; consult a CPA.
Schools (NCES district)
- District
- Odessa R-VII
- NCES district ID
- 2923100
- Math proficiency
- 34% ▼ -9.00%
- Reading proficiency
- 48% ▼ -1.00%
- Median HH income
- $51,736
- Composite
- 35.44/100
- National rank
- #4932
- State rank
- #123 of 324 in MO
Livability — Lake Lafayette
- Score
- 50/100
- State rank
- #907
- US rank
- #25659
Category grades
Schools grade is shown separately in the Schools card above.
Census & demographics
- Population (ZIP)
- 9,236
Population outlook (Lafayette County) Hauer SSP2
- Today (2025)
- 31,118 people
- By 2030
- 29,993 · -3.6%
- By 2040
- 27,436 · -11.8%
- By 2050
- 24,585 · -21.0%
- By 2075
- 18,426 · -40.8%
- By 2100
- 12,897 · -58.6%
Race, ethnicity, and origin ACS 2023
- Neighborhood character
- Predominantly White (95%)
- Race & ethnicity
- White 95% Two or more races 4%
- Common ancestry
- Slovak 4% Danish 2% Italian 1%
- Foreign-born
- 1% · Canada
- Languages at home
- 97% English-only · German/W. Germanic 1% Spanish 1%
Political lean MEDSL · Lafayette
- 2024 margin
- Solid R (+48.9) · D 24.9% · R 73.8% · Other 1.3%
- 2008→2024 swing
- -33.6pp toward R · 2008: -15.3pp · 2024: -48.9pp
- All cycles
- 2024: R+48.9 2020: R+45.7 2016: R+43.8 2012: R+26.3 2008: R+15.3
Not yet ingested
- Civics
- —
Market trends
- HPI YoY
- ▼ -56.23%
- Current HPI
- 255.8581
- Rent YoY
- —
- Metro
- —
- State GDP YoY
- ▲ 1.84%
- F500 in state
- 20
Industry mix (Fortune 500 HQ in MO)
| Industry | F500 HQs | Revenue |
|---|---|---|
| Healthcare | 1 | $163B |
|
||
| Insurance | 1 | $21B |
|
||
| Industrial Technology | 1 | $17B |
|
||
| Retail | 1 | $16B |
|
||
| Industrial Distribution | 1 | $10B |
|
||
| Utilities | 1 | $9B |
|
||
Price history
1 event — show timeline
- 2026-06-03 Listed $155,000 Heartland MLS as Distributed by MLS Grid
Property tax history
-0.0%/yrLatest (2025): $243 · -9.6% YoY. Source: county tax records.
Cash-flow waterfall
monthlySold comps — $/sqft
last 12 mo · ≤1 miLoading sold comps…