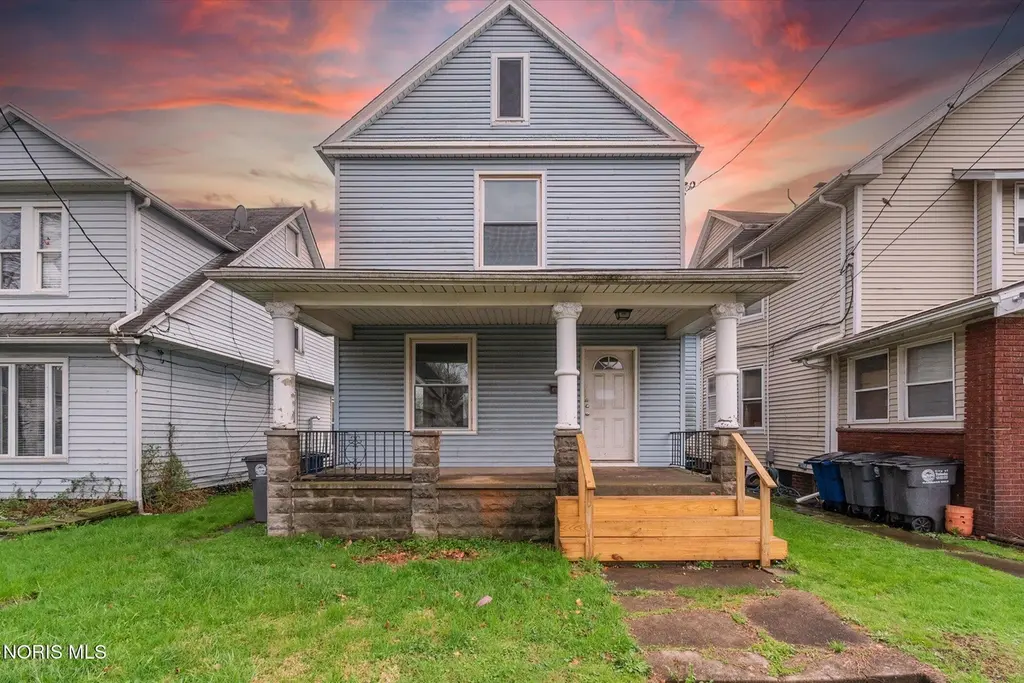
822 Delence St · Toledo, OH
Flood risk 1/10 · Minimal
- FEMA flood zone
- X (unshaded)
- Chance of flooding over 30 yrs
- 0.0%
- Est. flood insurance / yr
- $473 – $860
Fire risk 1/10 · Minimal
- Est. fire insurance / yr
- $713 – $1,323
Heat risk 3/10 · Minor
- Hot days now (above 100°F)
- 7 days/yr
- Hot days in 30 yrs
- 16 days/yr
Wind risk 2/10 · Minimal
- Chance of severe wind over 30 yrs
- —
Air-quality risk 2/10 · Minimal
- Unhealthy air days now
- 1 days/yr
- Unhealthy air days in 30 yrs
- 2 days/yr
Risk factors via First Street. Map © Google.
Why this score? — see what drove the B- grade
The composite is a weighted blend of 9 inputs, each scored 0–100. Each bar is that input's sub-score; the figure is the points it added to the 100-point composite (weight × sub-score).
- Cash flow +30.0/30.0
- DSCR +10.0/10.0
- 1% rule +8.3/10.0
- ARV discount +7.5/15.0
- Rent growth +3.8/5.0
- Livability +3.3/5.0
- Condition / age +2.5/5.0
- Schools +1.6/10.0
- Appreciation +0.0/10.0
$114,900
🖨 Deal sheet (PDF) 📄 Offer letter ✓ Due diligence
Listing remarks MLS
Welcome to this inviting property in the heart of East Toledo. The bright foyer opens to a spacious living and dining room combo. The dining area includes a charming bay window, ceramic tile floors that extend into the eat-in kitchen, and an awesome bar-top peninsula, with new light fixtures, that?s perfect for casual dining. Make your way upstairs from the kitchen or the foyer with the split staircase. Upstairs features 3 bedrooms, an office/ 4th bedroom, and the updated restroom. The primary bedroom is massive and includes a large closet. News Include: Furnace, Hot Water Tank, Insulation, Drywall, and windows.
Key facts
- 3,900 sq ft lot
- Built 1900
- Listed 61 days
Neighborhood map
What this means for you Summary
Snapshot
- This is a 5-bed/1.0-bath single-family listed at $115k.
Deal economics
- At list price, monthly cash flow is $462 ($6k/yr) — positive.
- The deal already cash-flows at list — no discount required.
- Meets the 1% rule at list price ($2k rent vs $115k).
- Recommended offer: $108k (6.0% below list) — sets the bar for market timing.
- Cap rate 11.1% vs local median 7.7% in Toledo — top-decile yield for the area; either an underpriced asset or a hidden risk that comps aren't pricing in. Stress-test before assuming the spread holds.
Location & tenants
- Location reads 66/100 on livability (#645 in OH) — a middle-class / working-renter tenant base. Strengths: cost of living A+, housing A+, health & safety A+; Watch: amenities C-, crime F, commute F.
- Toledo City (urban): math 15% / reading 24% proficiency, ranked #634 of 656 in OH (top 97%) — low school quality limits family demand, transient renter base, plan for 1-2y turnover; 72% free/reduced lunch — lower-income household profile, screen leases tightly.
- Zoned schools: Waite High School (math 12% / reading 24%, grade F, #687 of 781 statewide, top 88%, 997 students, 0% FRL) — zoned schools average 0% FRL vs 72% district-wide (72 pts lower); this property's tenant base skews higher-income than the district average.
- Market conditions: Rents rising fast (+5.4%/yr); 118 active listings in the ZIP; 2 comparable units currently listed for rent nearby; lower-income renter base — watch delinquency; 415 units permitted in Lucas County in 2024 (122 in 5+ unit buildings).
- At $1,526/mo this rent would consume 47% of the median local household income ($39k/yr) (locally 1257% of renters already pay >50% of income on rent) — very limited rent-growth headroom before tenants either downsize or default.
Forward outlook
- Local home prices are declining (-3.0%/yr); year-one equity from $794 of loan paydown is wiped out by about $3k of value loss. Plan a longer hold.
- Lucas County population projected at -16% by 2050 — secular population decline; favor cash flow + early exit over multi-decade hold.
- At projected returns (-3.0% appreciation + 5.4% rent growth), your $32k cash investment doubles in ~7 years — after that, you're playing with house money.
Negotiation context
- It's been on market 61 days — a 6% lower offer ($108k) is reasonable based on typical stale-listing flexibility.
Risks & watch-outs
- Watch-outs: built in 1900 — expect roof / HVAC / electrical / plumbing capex.
Questions for the listing agent
- It's been on market 61 days. Have you received any prior offers? Is the seller open to a 6% concession, seller financing, or rate buy-down credit?
- Built in 1900 — when were the roof, HVAC, electrical panel, plumbing, and water heater last replaced?
- Why hasn't it sold? Are there any deal-killer items the seller is aware of (foundation, flood, title, zoning, code violations)?
- Is there a deadline driving the sale (1031 exchange, divorce, estate, relocation)? That informs how much negotiation room exists.
- Schools are D-rated, which usually means shorter tenancies and higher turnover. Who's the typical renter profile here, and what's been the actual vacancy rate?
- Crime grade is F in this area — have there been break-ins, vandalism, or insurance claims at this property in the last 3 years? What carrier currently insures it and at what premium?
- What's the average days-on-market for RENTAL listings here right now (not sales)? A rising rental-DOM trend means longer vacancies and softer asking-rent achievability than the comps imply.
- What's the recent tenant-quality profile in this submarket — average credit score on applications, eviction rate, late-payment / NSF rate, and stable-employment percentage? A property-management company in the area should have these aggregated.
- How much new for-sale + rental construction is in the pipeline within 1–3 miles? Heavy new supply typically softens prices + rents 12–24 months out; constrained supply supports both.
Investment metrics
- 1% rule
- 1.33% ✓
- Cap rate
- 11.12%
- Cash-on-cash
- 17.23%
- DSCR
- 1.77
- GRM
- 6.3
CMA / ARV
- ARV (median comp)
- $49,555
- List price
- $114,900
- Delta
- 131.86%
- Verdict
- OVERPRICED
- Comps
- 20 within 1.0 mi
Show comp detail 12 sales within ~0.75 mi
| Address | Dist | Beds/Ba | Sqft | Sold | Price | $/sf | Match |
|---|---|---|---|---|---|---|---|
| 452 Saint Louis St | 0.29mi | 5/1.0 | 1,418 (+2%) | 6mo | $62,500 | $44 | 78 |
| 647 Woodville Rd | 0.26mi | 4/1.0 (-1) | 1,402 (+0%) | 11mo | $60,000 | $43 | 73 |
| 456 Fifth St | 0.34mi | 4/1.0 (-1) | 1,417 (+2%) | 10mo | $75,000 | $53 | 68 |
| 727 Raymer Blvd | 0.46mi | 4/2.0 (-1) | 1,408 (+1%) | 9mo | $89,900 | $64 | 61 |
| 624 White St | 0.33mi | 4/2.0 (-1) | 1,350 (-3%) | 12mo | $63,000 | $47 | 60 |
| 503 Utah St | 0.52mi | 4/2.0 (-1) | 1,440 (+3%) | 5mo | $137,250 | $95 | 57 |
| 40 Nevada St | 0.65mi | 4/2.0 (-1) | 1,356 (-3%) | 9mo | $60,750 | $45 | 48 |
| 322 Valleywood Dr | 0.53mi | 4/1.5 (-1) | 1,469 (+5%) | 14mo | $81,000 | $55 | 48 |
| 368 Plymouth St | 0.33mi | 4/1.5 (-1) | 1,552 (+11%) | 18mo | $76,000 | $49 | 44 |
| 442 Raymer Blvd | 0.39mi | 4/1.0 (-1) | 1,537 (+10%) | 21mo | $44,000 | $29 | 43 |
| 952 Kingston Ave | 0.67mi | 4/2.0 (-1) | 1,485 (+6%) | 9mo | $145,000 | $98 | 42 |
| 29 Neise Ave | 0.67mi | 4/1.5 (-1) | 1,284 (-8%) | 13mo | $68,000 | $53 | 38 |
Match score weights: distance 35% · size 25% · config 20% · recency 20%. Top-matched comps best support the ARV.
Projected returns pro-forma
-3.0% appreciation · 5.37% rent growth · sell at horizon
- IRR
- 11.1%
- Equity multiple
- 1.45×
- Total profit
- $14,521
- Equity at exit
- $17,132
- IRR
- 21.9%
- Equity multiple
- 3.07×
- Total profit
- $66,540
- Equity at exit
- $9,934
Cash invested: $32,172 (down + closing). Projections, not guarantees.
Landlord ↔ Tenant lean methodology
- Overall (STATE)
- 73 Landlord-Friendly
- State Ohio
- 73 Landlord-Friendly · R+6
- County
- — inherits STATE
- City
- — inherits STATE
ZIP-level market 43605
- Home prices YoY
- -25.6%
- Rents YoY
- 5.4%
- Active inventory
- 118
- Price-to-rent
- 6.3×
Monthly cashflow live
- Estimated rent
- $1,526 medium interval (Pro) →
- Mortgage (P&I)
- −$603
- Tax from tax record
- −$93 /mo · $1,113/yr
- Insurance
- −$48
- HOA
- −$0
- Vacancy / Maint / Mgmt
- −$320
- Net cashflow
- $462
Break-even live
Sensitivity live
| Price | -10% $527 | -5% $495 | +0% $462 | +5% $429 | +10% $397 |
|---|---|---|---|---|---|
| Rent | -10% $341 | -5% $402 | +0% $462 | +5% $522 | +10% $583 |
| Rate | -1.0pp $520 | -0.5pp $491 | base $462 | +0.5pp $432 | +1.0pp $402 |
UW: 25.0% down · 7.5% · 30yr · 1.5% tax · 5.0% vac · 8.0% maint · 8.0% mgmt
Financing live
Cash to close
- Down payment
- $28,725
- Closing costs
- $3,447
- Reserves months
- —
- Total cash needed
- —
Loan-product check · same deal, 3 products live
Conventional
25% down · 7.5% · 30yr
- Down + closing
- —
- Monthly P&I
- —
- Monthly cashflow
- —
- DSCR
- —
- Eligible?
- —
Personal DTI + credit; lowest rate.
DSCR
20% down · 8.5% · 30yr
- Down + closing
- —
- Monthly P&I
- —
- Monthly cashflow
- —
- DSCR
- —
- Eligible?
- —
No personal income docs; deal must DSCR.
Hard money
10% down · 12.0% · 12mo
- Down + closing
- —
- Monthly P&I
- —
- Monthly cashflow
- —
- DSCR
- —
- Eligible?
- —
Short-term bridge; refi at stabilization.
Rent comps 2 comps
| Address | Beds | Baths | Sqft | Rent | $/sqft | DOM | Units | Dist |
|---|---|---|---|---|---|---|---|---|
| 29 Garfield Pl Toledo, OH | 4.0 | 2.0 | 1300 | $1,250 | $0.96 | 15d | 1 | 0.19mi |
| 921 Berry St Toledo, OH | 4.0 | 1.0 | 1204 | $1,350 | $1.12 | 15d | 1 | 0.52mi |
Listing history 19 events
-
2026-06-21days on market $114,900 Active 61 DOM
-
2026-06-18days on market $114,900 Active 58 DOM
-
2026-06-17days on market $114,900 Active 57 DOM
-
2026-06-16days on market $114,900 Active 56 DOM
-
2026-06-15days on market $114,900 Active 55 DOM
-
2026-06-14days on market $114,900 Active 53 DOM
-
2026-06-10days on market $114,900 Active 50 DOM
-
2026-06-09days on market $114,900 Active 49 DOM
-
2026-06-09price $114,900 Active 48 DOM
-
2026-06-08days on market $119,900 Active 48 DOM
-
2026-06-07days on market $119,900 Active 47 DOM
-
2026-06-05days on market $119,900 Active 44 DOM
-
2026-06-03days on market $119,900 Active 43 DOM
-
2026-06-02days on market $119,900 Active 42 DOM
-
2026-06-01days on market $119,900 Active 41 DOM
-
2026-05-31days on market $119,900 Active 40 DOM
-
2026-05-30days on market $119,900 Active 39 DOM
-
2026-04-21$119,900 Active 619-char remark
Show marketing remark (619 chars)
Welcome to this inviting property in the heart of East Toledo. The bright foyer opens to a spacious living and dining room combo. The dining area includes a charming bay window, ceramic tile floors that extend into the eat-in kitchen, and an awesome bar-top peninsula, with new light fixtures, that?s perfect for casual dining. Make your way upstairs from the kitchen or the foyer with the split staircase. Upstairs features 3 bedrooms, an office/ 4th bedroom, and the updated restroom. The primary bedroom is massive and includes a large closet. News Include: Furnace, Hot Water Tank, Insulation, Drywall, and windows.
-
2026-04-17historical $119,900 619-char remark
Show marketing remark (619 chars)
Welcome to this inviting property in the heart of East Toledo. The bright foyer opens to a spacious living and dining room combo. The dining area includes a charming bay window, ceramic tile floors that extend into the eat-in kitchen, and an awesome bar-top peninsula, with new light fixtures, that?s perfect for casual dining. Make your way upstairs from the kitchen or the foyer with the split staircase. Upstairs features 3 bedrooms, an office/ 4th bedroom, and the updated restroom. The primary bedroom is massive and includes a large closet. News Include: Furnace, Hot Water Tank, Insulation, Drywall, and windows.
ⓘ Source: listings_history table (triggers on properties + properties_extension) + one-shot
backfill from property_details.listing_events for pre-trigger history.
Tax reassessment forecast OH · Partial reset (capped growth)
- Current annual tax
- $1,113 · $93/mo
- Projected year-2 tax
- $1,453 · $121/mo
- Expected delta
- +$340/yr (+$28/mo · 30.5%)
ⓘ Screening estimate from a state-policy table — verify with the county assessor before closing.
Climate risk First Street
- Flood 1/10 Low FEMA zone X (unshaded) · 0% chance over 30 yrs
- Wildfire 1/10 Low
- Heat 3/10 Moderate 7 d/yr ≥100°F today · 16 d/yr by 30 yrs out
- Wind 2/10 Low
- Air quality 2/10 Low 1 unhealthy d/yr today · 2 by 30 yrs out
Nearby sold comps map
Loading sold comps map…
Walkable amenities ~0.75 mi
Loading nearby amenities…
Taxation est. · year 1
- Rental income
- $18,306
- − Mortgage interest
- −$6,436
- − Property taxes
- −$1,113
- − Insurance
- −$574
- − Repairs & maintenance
- −$1,464
- − Management
- −$1,464
- − Depreciation
- −$3,343
- Taxable income
- $3,911
- Est. tax owed @ 24.0%
- −$939
- After-tax cash flow
- $4,605/yr
For passive investors: Depreciation is non-cash, so a rental often shows a tax loss while cash-flowing — sheltering income. Rental losses are passive: they offset passive income freely, and up to $25,000/yr can offset ordinary (W-2) income if you actively participate and your MAGI is under $100k (phasing out to $0 by $150k); unused losses carry forward. On sale, claimed depreciation is recaptured at up to 25%, and gains may owe capital-gains tax (a 1031 exchange can defer both). Figures are a year-1 estimate at your 24.0% rate — not tax advice; consult a CPA.
Schools (NCES district)
- District
- Toledo City
- NCES district ID
- 3904490
- Math proficiency
- 15% ▼ -16.00%
- Reading proficiency
- 24% ▼ -13.00%
- Median HH income
- $32,137
- Composite
- 15.76/100
- National rank
- #9276
- State rank
- #634 of 656 in OH
Livability — Toledo
- Score
- 66/100
- State rank
- #645
- US rank
- #11442
Category grades
Schools grade is shown separately in the Schools card above.
Census & demographics
- Census place
- Toledo, OH
- County
- Lucas County · 380,724 people
- City population
- 280,811
- Metro
- Toledo, OH
- Population (ZIP)
- 24,441
- Household income
- $39,118
- Rent vs Own
- Severe rent burden
- 1257.0
Population outlook (Lucas County) Hauer SSP2
- Today (2025)
- 420,751 people
- By 2030
- 410,187 · -2.5%
- By 2040
- 384,019 · -8.7%
- By 2050
- 355,125 · -15.6%
- By 2075
- 291,683 · -30.7%
- By 2100
- 233,670 · -44.5%
Race, ethnicity, and origin ACS 2023
- Neighborhood character
- Diverse neighborhood (Simpson 0.61)
- Race & ethnicity
- White 57% Hispanic / Latino 21% Black 14% Two or more races 14%
- Hispanic origin (detail)
- Mexican 17% Puerto Rican 2%
- Common ancestry
- Romanian 3% Lithuanian 2% Portuguese 1%
- Foreign-born
- 3% · Canada
- Languages at home
- 91% English-only · Spanish 7% Arabic 1%
Political lean MEDSL · Lucas
- 2024 margin
- D (+12.6) · D 55.8% · R 43.2%
- 2008→2024 swing
- -18.9pp toward R · 2008: 31.4pp · 2024: 12.6pp
- All cycles
- 2024: D+12.6 2020: D+16.8 2016: D+17.4 2012: D+30.4 2008: D+31.4
Not yet ingested
- Civics
- —
Market trends
- HPI YoY
- ▼ -47.85%
- Current HPI
- 138.6894
- Rent YoY
- ▲ 5.37%
- Metro
- Toledo, OH
- State GDP YoY
- ▲ 1.98%
- F500 in state
- 48
Industry mix (Fortune 500 HQ in OH)
| Industry | F500 HQs | Revenue |
|---|---|---|
| Insurance | 3 | $145B |
|
||
| Industrial Machinery | 3 | $49B |
|
||
| Financial Services | 3 | $24B |
|
||
| Consumer Goods | 2 | $93B |
|
||
| Aerospace / Defense | 2 | $47B |
|
||
| Utilities | 2 | $33B |
|
||
Price history
+0.0% since first listed2 events — show timeline
- 2026-04-21 Listed $119,900 NORIS
- 2026-04-17 Coming Soon $119,900 NORIS
Property tax history
+2.8%/yrLatest (2025): $1,113 · +13.8% YoY. Source: county tax records.
Cash-flow waterfall
monthlySold comps — $/sqft
last 12 mo · ≤1 miLoading sold comps…