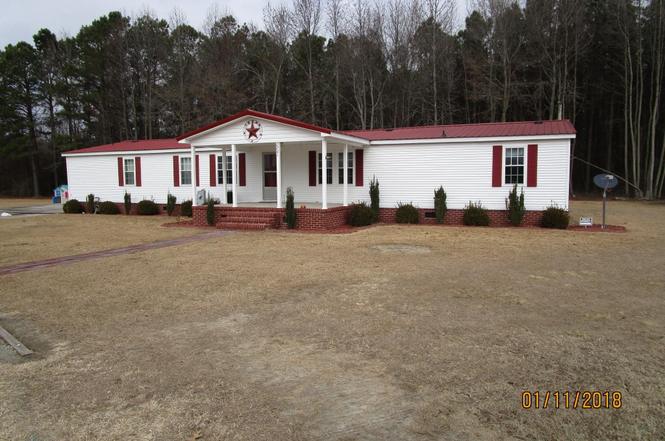
2201 Trent Cir · Deep Run, NC
Flood risk No data
- FEMA flood zone
- —
- Chance of flooding over 30 yrs
- —
- Est. flood insurance / yr
- —
Fire risk No data
- Est. fire insurance / yr
- —
Heat risk No data
- Hot days now (above threshold)
- —
- Hot days in 30 yrs
- —
Wind risk No data
- Chance of severe wind over 30 yrs
- —
Air-quality risk No data
- Unhealthy air days now
- —
- Unhealthy air days in 30 yrs
- —
Risk factors via First Street. Map © Google.
Why this score? — see what drove the D- grade
The composite is a weighted blend of 9 inputs, each scored 0–100. Each bar is that input's sub-score; the figure is the points it added to the 100-point composite (weight × sub-score).
- Cash flow +9.0/30.0
- Appreciation +8.0/10.0
- ARV discount +7.5/15.0
- 1% rule +2.7/10.0
- DSCR +2.5/10.0
- Rent growth +2.5/5.0
- Schools +2.5/10.0
- Livability +2.5/5.0
- Condition / age +2.5/5.0
$180,000
🖨 Deal sheet (PDF) 📄 Offer letter ✓ Due diligence
Listing remarks MLS
Beautiful 4 bedroom home located on nice country lot. Home features metal roof, large open floor plan, large family room, updated laminate flooring, heat pump, gas stove, beautiful kitchen cabinets, lots of counter space, large garden tube, walk-in shower, spacious back yard and more.
Key facts
- 0.52 acre lot
- Built 2021
- Listed 134 days
Property features AI
Finance
- Other: Living area listed as 2,430 (square footage omitted in section display per instructions)
- Financial info: Annual taxes listed (amount withheld from output per instructions)
- HOA & community: No homeowners association; Not a senior community
Exterior
- Utilities: Other sewer; Other water source; Other utilities
- Home design: Manufactured house; One level
- Construction: Built with other/unspecified construction materials
- Exterior features: Other foundation details; Other roof type; Lot about 0.52 acre (publicly maintained road)
Interior
- Kitchen: Dishwasher; Range; Other kitchen features
- Bedrooms: 4 bedrooms
- Flooring: Other flooring
- Bathrooms: 3 full bathrooms
- Heating & cooling: Electric heating; Central air conditioning
- Interior features: Open to additional unspecified features (details listed as 'Other')
- Laundry & utility: Other utility features
Neighborhood map
What this means for you Summary
Snapshot
- This is a 3-bed/2.0-bath manufactured listed at $180k.
Deal economics
- At list price, monthly cash flow is $-142 ($-2k/yr) — negative.
- To cash-flow at today's rent, offer at most $155k (14.0% below list).
- To meet the 1% rule (rent ≥ 1% of price), the offer needs to be $138k (23.1% below list).
- Recommended offer: $138k (23.1% below list) — sets the bar for 1% rule.
Location & tenants
- Location reads: area grade D — affects rentability + tenant quality, not the cash-flow math above.
- Lenoir County Public Schools (rural): math 29% / reading 32% proficiency, ranked #147 of 178 in NC (top 83%) — families likely to look elsewhere, expect single-tenant / working-renter base with shorter leases; 65% free/reduced lunch — lower-income household profile, screen leases tightly.
- Zoned schools: Pink Hill Elementary (math 36% / reading 37%, grade F, #806 of 1,410 statewide, top 57%, 459 students, 99% FRL); Woodington Middle (math 31% / reading 43%, grade F, #262 of 475 statewide, top 57%, 577 students, 100% FRL); South Lenoir High (math 52% / reading 42%, grade D-, #334 of 535 statewide, top 64%, 771 students, 99% FRL) — zoned schools average 99% FRL vs 65% district-wide (34 pts higher); higher-poverty schools than district average — tighter screening recommended.
- Market conditions: 13 active listings in the ZIP; 148 units permitted in Lenoir County in 2024 (0 in 5+ unit buildings).
Forward outlook
- In year one you build about $12k of equity ($1k loan paydown + $11k appreciation (6.0% local appreciation)).
- Lenoir County population projected at -18% by 2050 — secular population decline; favor cash flow + early exit over multi-decade hold.
- By year 4, paydown + projected appreciation supports a ~$41k cash-out refi (75% LTV) — recoverable capital for the next deal without selling this one.
Negotiation context
- It's been on market 134 days — a 12% lower offer ($158k) is reasonable based on typical stale-listing flexibility.
- 3 sale attempts since 8y ago; this cycle's ask has dropped $10k (5%) from the opening price — seller is motivated, your offer sets the floor, not the list.
- Current owner paid $75k; list at $180k implies a 140% gain — meaningful room to come down on a strong offer.
Questions for the listing agent
- What do current leases actually rent for vs. the listed asking? Can we see a recent rent roll and the last 12 months of T-12 income?
- It's been on market 134 days. Have you received any prior offers? Is the seller open to a 23% concession, seller financing, or rate buy-down credit?
- Why hasn't it sold? Are there any deal-killer items the seller is aware of (foundation, flood, title, zoning, code violations)?
- Is there a deadline driving the sale (1031 exchange, divorce, estate, relocation)? That informs how much negotiation room exists.
- The area grade is low — what's the realistic commute time and amenity access for the typical tenant pool here? Any planned neighborhood developments (good or bad) we should know about?
- What's the average days-on-market for RENTAL listings here right now (not sales)? A rising rental-DOM trend means longer vacancies and softer asking-rent achievability than the comps imply.
- What's the recent tenant-quality profile in this submarket — average credit score on applications, eviction rate, late-payment / NSF rate, and stable-employment percentage? A property-management company in the area should have these aggregated.
- How much new for-sale + rental construction is in the pipeline within 1–3 miles? Heavy new supply typically softens prices + rents 12–24 months out; constrained supply supports both.
Investment metrics
- 1% rule
- 0.77% ✗
- Cap rate
- 5.35%
- Cash-on-cash
- -3.38%
- DSCR
- 0.85
- GRM
- 10.8
CMA / ARV
No comps found within radius.
Projected returns pro-forma
6.02% appreciation · 3.0% rent growth · sell at horizon
- IRR
- 12.7%
- Equity multiple
- 1.86×
- Total profit
- $43,185
- Equity at exit
- $113,423
- IRR
- 13.3%
- Equity multiple
- 3.66×
- Total profit
- $134,075
- Equity at exit
- $205,919
Cash invested: $50,400 (down + closing). Projections, not guarantees.
Landlord ↔ Tenant lean methodology
- Overall (STATE)
- 85 Strongly Landlord-Friendly
- State North Carolina
- 85 Strongly Landlord-Friendly · R+3
- County
- — inherits STATE
- City
- — inherits STATE
ZIP-level market 28525
- Home prices YoY
- 2.9%
- Active inventory
- 13
- Price-to-rent
- 10.8×
Monthly cashflow live
- Estimated rent
- $1,385 medium interval (Pro) →
- Mortgage (P&I)
- −$944
- Tax from tax record
- −$217 /mo · $2,606/yr
- Insurance
- −$75
- HOA
- −$0
- Vacancy / Maint / Mgmt
- −$291
- Net cashflow
- $-142
Break-even live
Sensitivity live
| Price | -10% $-40 | -5% $-91 | +0% $-142 | +5% $-193 | +10% $-244 |
|---|---|---|---|---|---|
| Rent | -10% $-252 | -5% $-197 | +0% $-142 | +5% $-87 | +10% $-33 |
| Rate | -1.0pp $-51 | -0.5pp $-96 | base $-142 | +0.5pp $-189 | +1.0pp $-236 |
UW: 25.0% down · 7.5% · 30yr · 1.5% tax · 5.0% vac · 8.0% maint · 8.0% mgmt
Financing live
Cash to close
- Down payment
- $45,000
- Closing costs
- $5,400
- Reserves months
- —
- Total cash needed
- —
Loan-product check · same deal, 3 products live
Conventional
25% down · 7.5% · 30yr
- Down + closing
- —
- Monthly P&I
- —
- Monthly cashflow
- —
- DSCR
- —
- Eligible?
- —
Personal DTI + credit; lowest rate.
DSCR
20% down · 8.5% · 30yr
- Down + closing
- —
- Monthly P&I
- —
- Monthly cashflow
- —
- DSCR
- —
- Eligible?
- —
No personal income docs; deal must DSCR.
Hard money
10% down · 12.0% · 12mo
- Down + closing
- —
- Monthly P&I
- —
- Monthly cashflow
- —
- DSCR
- —
- Eligible?
- —
Short-term bridge; refi at stabilization.
Listing history 13 events
-
2026-05-31days on market $180,000 Active 134 DOM
-
2026-02-18price $180,000
-
2026-01-16$190,000 Active
-
2025-11-25historical
-
2025-11-21price $142,000
-
2025-11-12price $149,000
-
2025-10-31price $157,000
-
2025-10-13price $159,000
-
2025-10-09price $169,000
-
2025-10-01price $174,000
-
2025-09-25$184,000 Active
-
2018-04-30soldstatus $75,000 285-char remark
Show marketing remark (285 chars)
Beautiful 4 bedroom home located on nice country lot. Home features metal roof, large open floor plan, large family room, updated laminate flooring, heat pump, gas stove, beautiful kitchen cabinets, lots of counter space, large garden tube, walk-in shower, spacious back yard and more.
-
2018-01-04$80,000 285-char remark
Show marketing remark (285 chars)
Beautiful 4 bedroom home located on nice country lot. Home features metal roof, large open floor plan, large family room, updated laminate flooring, heat pump, gas stove, beautiful kitchen cabinets, lots of counter space, large garden tube, walk-in shower, spacious back yard and more.
ⓘ Source: listings_history table (triggers on properties + properties_extension) + one-shot
backfill from property_details.listing_events for pre-trigger history.
Tax reassessment forecast NC · Resets to sale price
- Current annual tax
- $2,606 · $217/mo
- Projected year-2 tax
- $2,606 · $217/mo
- Expected delta
- $0/yr ($0/mo · 0.0%)
ⓘ Screening estimate from a state-policy table — verify with the county assessor before closing.
Nearby sold comps map
Loading sold comps map…
Walkable amenities ~0.75 mi
Loading nearby amenities…
Taxation est. · year 1
- Rental income
- $16,617
- − Mortgage interest
- −$10,083
- − Property taxes
- −$2,606
- − Insurance
- −$900
- − Repairs & maintenance
- −$1,329
- − Management
- −$1,329
- − Depreciation
- −$5,236
- Taxable loss
- −$4,867
- Est. tax savings @ 24.0%
- +$1,168
- After-tax cash flow
- $-538/yr
For passive investors: Depreciation is non-cash, so a rental often shows a tax loss while cash-flowing — sheltering income. Rental losses are passive: they offset passive income freely, and up to $25,000/yr can offset ordinary (W-2) income if you actively participate and your MAGI is under $100k (phasing out to $0 by $150k); unused losses carry forward. On sale, claimed depreciation is recaptured at up to 25%, and gains may owe capital-gains tax (a 1031 exchange can defer both). Figures are a year-1 estimate at your 24.0% rate — not tax advice; consult a CPA.
Schools (NCES district)
- District
- Lenoir County Public Schools
- NCES district ID
- 3702610
- Math proficiency
- 29% ▲ 1.00%
- Reading proficiency
- 32% ▼ -4.00%
- Median HH income
- $34,958
- Composite
- 25.17/100
- National rank
- #7515
- State rank
- #147 of 178 in NC
Livability — Deep Run
No livability data for this city. (Only ~50 U.S. cities are tracked.)
Census & demographics
- Census place
- Deep Run, NC
- Population (ZIP)
- 2,684
Population outlook (Lenoir County) Hauer SSP2
- Today (2025)
- 55,002 people
- By 2030
- 53,048 · -3.6%
- By 2040
- 49,041 · -10.8%
- By 2050
- 45,136 · -17.9%
- By 2075
- 36,547 · -33.6%
- By 2100
- 27,731 · -49.6%
Race, ethnicity, and origin ACS 2023
- Neighborhood character
- Majority White (63%)
- Race & ethnicity
- White 63% Hispanic / Latino 27% Two or more races 10% Black 9%
- Hispanic origin (detail)
- Mexican 26%
- Common ancestry
- Italian 2% Slovak 1%
- Foreign-born
- 16% · Canada
- Languages at home
- 75% English-only · Spanish 25%
Political lean MEDSL · Lenoir
- 2024 margin
- Lean R (+6.8) · D 46.2% · R 53.0%
- 2008→2024 swing
- -6.7pp toward R · 2008: -0.1pp · 2024: -6.8pp
- All cycles
- 2024: R+6.8 2020: R+3.5 2016: R+6.3 2012: R+1.5 2008: R+0.1
Not yet ingested
- Civics
- —
Market trends
- HPI YoY
- ▲ 6.02%
- Current HPI
- 214.2322
- Rent YoY
- —
- Metro
- —
- State GDP YoY
- ▲ 3.28%
- F500 in state
- 26
Industry mix (Fortune 500 HQ in NC)
| Industry | F500 HQs | Revenue |
|---|---|---|
| Financial Services | 2 | $213B |
|
||
| Retail | 2 | $95B |
|
||
| Industrial Conglomerate | 1 | $38B |
|
||
| Metals / Steel | 1 | $35B |
|
||
| Utilities | 1 | $30B |
|
||
| Industrial Machinery | 1 | $19B |
|
||
Price history
+125.0% since first listed12 events — show timeline
- 2026-02-18 Price Changed $180,000 TMLS
- 2026-01-16 Listed $190,000 TMLS
- 2025-11-25 Listing Removed — Hive MLS
- 2025-11-21 Price Changed $142,000 Hive MLS
- 2025-11-12 Price Changed $149,000 Hive MLS
- 2025-10-31 Price Changed $157,000 Hive MLS
- 2025-10-13 Price Changed $159,000 Hive MLS
- 2025-10-09 Price Changed $169,000 Hive MLS
- 2025-10-01 Price Changed $174,000 Hive MLS
- 2025-09-25 Listed $184,000 Hive MLS
- 2018-04-30 Sold (MLS) $75,000 Hive MLS
- 2018-01-04 Listed $80,000 Hive MLS
Property tax history
+28.9%/yrLatest (2025): $2,606 · +221.6% YoY. Source: county tax records.
Cash-flow waterfall
monthlySold comps — $/sqft
last 12 mo · ≤1 miLoading sold comps…