1685 Liberty Dr · Marion, PA
Flood risk 1/10 · Minimal
- FEMA flood zone
- X (unshaded)
- Chance of flooding over 30 yrs
- 0.0%
- Est. flood insurance / yr
- $507 – $1,088
Fire risk 3/10 · Minor
- Est. fire insurance / yr
- $511 – $949
Heat risk 5/10 · Moderate
- Hot days now (above 100°F)
- 7 days/yr
- Hot days in 30 yrs
- 15 days/yr
Wind risk 2/10 · Minimal
- Chance of severe wind over 30 yrs
- 1.0%
Air-quality risk 2/10 · Minimal
- Unhealthy air days now
- 1 days/yr
- Unhealthy air days in 30 yrs
- 2 days/yr
Risk factors via First Street. Map © Google.
Why this score? — see what drove the B- grade
The composite is a weighted blend of 9 inputs, each scored 0–100. Each bar is that input's sub-score; the figure is the points it added to the 100-point composite (weight × sub-score).
- Cash flow +30.0/30.0
- 1% rule +10.0/10.0
- DSCR +10.0/10.0
- ARV discount +7.5/15.0
- Schools +3.5/10.0
- Livability +3.2/5.0
- Rent growth +2.5/5.0
- Condition / age +2.2/5.0
- Appreciation +0.0/10.0
$70,000
🖨 Deal sheet (PDF) 📄 Offer letter ✓ Due diligence
Listing remarks
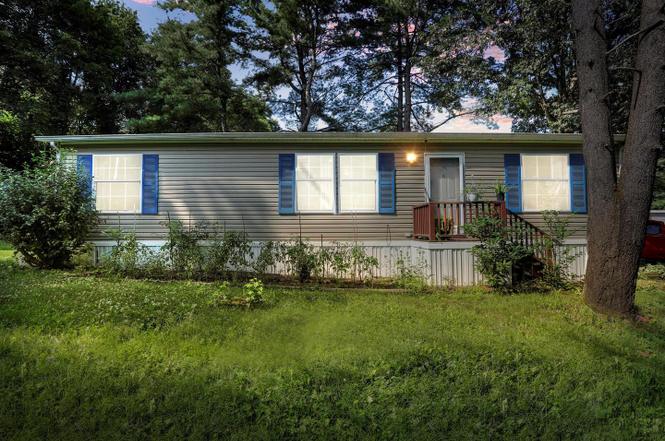
Welcome to 1685 Liberty Drive, Chambersburg, Pa - As you enter the front door, you'll be welcomed into an open-concept great room filled with natural light and plenty of space--flowing seamlessly into a spacious eat-in-kitchen with a bump out room perfect for those needing storage. To the left of the kitchen, you'll find the primary bedroom, complete with a full bathroom. There is a large laundry/mud room just off your rear driveway entrance. Looking for privacy? This home sits on a wooded lot, giving you the peaceful setting you've been searching for in a manufactured community. M Must have 24-hour notice to show. Must be park approved. This is a great home to customize to your liking! Sel
Key facts
- Wooded lot
- Bump out room
- Peaceful setting
Tags
Neighborhood map
What this means for you Summary
Snapshot
- This is a 3-bed/2.0-bath single-family listed at $70k. Condition is rated fair.
Deal economics
- At list price, monthly cash flow is $954 ($11k/yr) — positive.
- The deal already cash-flows at list — no discount required.
- Meets the 1% rule at list price ($2k rent vs $70k).
- Recommended offer: $62k (12.0% below list) — sets the bar for market timing.
- Cap rate 22.6% vs local median 2.6% in Marion — top-decile yield for the area; either an underpriced asset or a hidden risk that comps aren't pricing in. Stress-test before assuming the spread holds.
Location & tenants
- Location reads 63/100 on livability (#1,248 in PA) — a middle-class / working-renter tenant base. Strengths: crime A+, cost of living A, employment B+; Watch: schools F, amenities F, commute F.
- Tuscarora SD (rural): math 28% / reading 53% proficiency, ranked #338 of 539 in PA (top 63%) — families likely to look elsewhere, expect single-tenant / working-renter base with shorter leases.
- Market conditions: 224 active listings in the ZIP; 633 units permitted in Franklin County in 2024 (112 in 5+ unit buildings).
Forward outlook
- Local home prices are declining (-3.0%/yr); year-one equity from $484 of loan paydown is wiped out by about $2k of value loss. Plan a longer hold.
- At projected returns (-3.0% appreciation + 3.0% rent growth), your $20k cash investment doubles in ~2 years — after that, you're playing with house money.
Negotiation context
- It's been on market 253 days — a 12% lower offer ($62k) is reasonable based on typical stale-listing flexibility.
- 2 sale attempts; this cycle's ask has dropped $10k (12%) from the opening price — seller is motivated, your offer sets the floor, not the list.
Risks & watch-outs
- Climate carrying-cost: extreme-heat days projected 7→15/yr by 2055 (HVAC capex compounding) — expect insurance premiums to compound above CPI over the hold.
Questions for the listing agent
- It's been on market 253 days. Have you received any prior offers? Is the seller open to a 12% concession, seller financing, or rate buy-down credit?
- Have any recent inspections been done? Can we get a copy of the seller's disclosures and any deferred-maintenance estimates?
- Why hasn't it sold? Are there any deal-killer items the seller is aware of (foundation, flood, title, zoning, code violations)?
- Is there a deadline driving the sale (1031 exchange, divorce, estate, relocation)? That informs how much negotiation room exists.
- Schools are F-rated, which usually means shorter tenancies and higher turnover. Who's the typical renter profile here, and what's been the actual vacancy rate?
- What's the average days-on-market for RENTAL listings here right now (not sales)? A rising rental-DOM trend means longer vacancies and softer asking-rent achievability than the comps imply.
- What's the recent tenant-quality profile in this submarket — average credit score on applications, eviction rate, late-payment / NSF rate, and stable-employment percentage? A property-management company in the area should have these aggregated.
- How much new for-sale + rental construction is in the pipeline within 1–3 miles? Heavy new supply typically softens prices + rents 12–24 months out; constrained supply supports both.
Investment metrics
- 1% rule
- 2.60% ✓
- Cap rate
- 22.65%
- Cash-on-cash
- 58.40%
- DSCR
- 3.60
- GRM
- 3.2
CMA / ARV
- ARV (on-the-fly)
- $287,616
- Comps found
- 12
Show comp detail 12 sales within ~0.75 mi
| Address | Dist | Beds/Ba | Sqft | Sold | Price | $/sf | Match |
|---|---|---|---|---|---|---|---|
| 1685 Liberty Dr | 0.00mi | 3/2.0 | 1,344 (0%) | 1mo | $70,000 | $52 | 99 |
| 4307 Percy Ave | 0.21mi | 3/2.0 | 1,352 (+1%) | 3mo | $308,500 | $228 | 86 |
| 3746 Percy Ave | 0.30mi | 3/2.5 | 1,398 (+4%) | 1mo | $329,900 | $236 | 77 |
| 3607 Hickory Ct | 0.27mi | 3/2.5 | 1,404 (+4%) | 3mo | $329,900 | $235 | 76 |
| 4106 Percy Ave | 0.16mi | 3/2.0 | 1,398 (+4%) | 15mo | $299,900 | $215 | 74 |
| 4421 Percy Ave | 0.29mi | 3/2.5 | 1,398 (+4%) | 7mo | $329,500 | $236 | 72 |
| 4080 Dixie Ave #4080 | 0.35mi | 3/1.0 | 1,304 (-3%) | 4mo | $239,900 | $184 | 71 |
| 3955 Percy Ave | 0.25mi | 3/2.0 | 1,398 (+4%) | 13mo | $295,000 | $211 | 71 |
| 4402 Shatzer St | 0.43mi | 3/1.0 | 1,372 (+2%) | 4mo | $283,000 | $206 | 69 |
| 3728 Percy Ave | 0.30mi | 3/2.0 | 1,423 (+6%) | 12mo | $289,900 | $204 | 66 |
| 1224 Hade Rd | 0.44mi | 2/1.0 (-1) | 1,298 (-3%) | 5mo | $185,000 | $143 | 60 |
| Percy Ave | 0.28mi | 3/2.5 | 1,423 (+6%) | 21mo | $304,000 | $214 | 58 |
Match score weights: distance 35% · size 25% · config 20% · recency 20%. Top-matched comps best support the ARV.
Projected returns pro-forma
-3.0% appreciation · 3.0% rent growth · sell at horizon
- IRR
- 57.0%
- Equity multiple
- 3.52×
- Total profit
- $49,440
- Equity at exit
- $10,437
- IRR
- 61.9%
- Equity multiple
- 7.19×
- Total profit
- $121,396
- Equity at exit
- $6,052
Cash invested: $19,600 (down + closing). Projections, not guarantees.
Landlord ↔ Tenant lean methodology
- Overall (STATE)
- 62 Landlord-Friendly
- State Pennsylvania
- 62 Landlord-Friendly · EVEN
- County
- — inherits STATE
- City
- — inherits STATE
ZIP-level market 17202
- Home prices YoY
- -26.1%
- Active inventory
- 224
- Price-to-rent
- 3.2×
Monthly cashflow live
- Estimated rent
- $1,820 medium interval (Pro) →
- Mortgage (P&I)
- −$367
- Tax est. 1.5%
- −$88 /mo · $1,050/yr
- Insurance
- −$29
- HOA
- −$0
- Vacancy / Maint / Mgmt
- −$382
- Net cashflow
- $954
Break-even live
Sensitivity live
| Price | -10% $1,002 | -5% $978 | +0% $954 | +5% $930 | +10% $906 |
|---|---|---|---|---|---|
| Rent | -10% $810 | -5% $882 | +0% $954 | +5% $1,026 | +10% $1,098 |
| Rate | -1.0pp $989 | -0.5pp $972 | base $954 | +0.5pp $936 | +1.0pp $917 |
UW: 25.0% down · 7.5% · 30yr · 1.5% tax · 5.0% vac · 8.0% maint · 8.0% mgmt
Financing live
Cash to close
- Down payment
- $17,500
- Closing costs
- $2,100
- Reserves months
- —
- Total cash needed
- —
Loan-product check · same deal, 3 products live
Conventional
25% down · 7.5% · 30yr
- Down + closing
- —
- Monthly P&I
- —
- Monthly cashflow
- —
- DSCR
- —
- Eligible?
- —
Personal DTI + credit; lowest rate.
DSCR
20% down · 8.5% · 30yr
- Down + closing
- —
- Monthly P&I
- —
- Monthly cashflow
- —
- DSCR
- —
- Eligible?
- —
No personal income docs; deal must DSCR.
Hard money
10% down · 12.0% · 12mo
- Down + closing
- —
- Monthly P&I
- —
- Monthly cashflow
- —
- DSCR
- —
- Eligible?
- —
Short-term bridge; refi at stabilization.
Listing history 5 events
-
2026-04-21status Pending
-
2026-03-28status Active
-
2026-03-06status Pending
-
2025-10-31price $70,000
-
2025-07-20$80,000 Active
ⓘ Source: listings_history table (triggers on properties + properties_extension) + one-shot
backfill from property_details.listing_events for pre-trigger history.
Climate risk First Street
- Flood 1/10 Low FEMA zone X (unshaded) · 0% chance over 30 yrs
- Wildfire 3/10 Moderate
- Heat 5/10 Major 7 d/yr ≥100°F today · 15 d/yr by 30 yrs out
- Wind 2/10 Low 100% chance of damaging wind over 30 yrs
- Air quality 2/10 Low 1 unhealthy d/yr today · 2 by 30 yrs out
Nearby sold comps map
Loading sold comps map…
Walkable amenities ~0.75 mi
Loading nearby amenities…
Taxation est. · year 1
- Rental income
- $21,838
- − Mortgage interest
- −$3,921
- − Property taxes
- −$1,050
- − Insurance
- −$350
- − Repairs & maintenance
- −$1,747
- − Management
- −$1,747
- − Depreciation
- −$2,036
- Taxable income
- $10,987
- Est. tax owed @ 24.0%
- −$2,637
- After-tax cash flow
- $8,810/yr
For passive investors: Depreciation is non-cash, so a rental often shows a tax loss while cash-flowing — sheltering income. Rental losses are passive: they offset passive income freely, and up to $25,000/yr can offset ordinary (W-2) income if you actively participate and your MAGI is under $100k (phasing out to $0 by $150k); unused losses carry forward. On sale, claimed depreciation is recaptured at up to 25%, and gains may owe capital-gains tax (a 1031 exchange can defer both). Figures are a year-1 estimate at your 24.0% rate — not tax advice; consult a CPA.
Condition & rehab AI · 13 photos
The home requires moderate repairs and maintenance, particularly to the exterior siding and landscaping. Painting and landscaping improvements can significantly enhance its resale and rental value.
Repairs flagged
- Major Siding — The siding is weathered and peeling, indicating significant damage.
- Major Landscaping — The landscaping is overgrown with weeds and shrubs, requiring trimming and maintenance.
Value-add opportunities
- Resale Painting the exterior — Painting the exterior can significantly improve the home's curb appeal and resale value.
- Rental Landscaping — A well-maintained and aesthetically pleasing landscape can attract more renters and increase rental value.
Renovation cost estimate screening
| Repair item | Severity | Est. cost |
|---|---|---|
| Siding · The siding is weathered and peeling, indicating significant damage. | Major | $15,000–50,000 |
| Landscaping · The landscaping is overgrown with weeds and shrubs, requiring trimming and maintenance. | Major | $15,000–50,000 |
| Total estimated repair cost · 2 items | $30,000–100,000 |
Value-add ROI direction
- Resale Painting the exterior — Painting the exterior can significantly improve the home's curb appeal and resale value. ↑
- Rental Landscaping — A well-maintained and aesthetically pleasing landscape can attract more renters and increase rental value. ↑
ⓘ Cost ranges are severity-bucket heuristics (US national rule-of-thumb). Get contractor quotes + a written scope before underwriting a rehab budget.
Schools (NCES district)
- District
- Tuscarora SD
- NCES district ID
- 4222740
- Math proficiency
- 28% ▼ -16.00%
- Reading proficiency
- 53% ▼ -12.00%
- Median HH income
- $54,293
- Composite
- 35.22/100
- National rank
- #4983
- State rank
- #338 of 539 in PA
Livability — Marion
- Score
- 63/100
- State rank
- #1248
- US rank
- #14994
Category grades
Schools grade is shown separately in the Schools card above.
Census & demographics
- City population
- 682
- Population (ZIP)
- 32,772
Population outlook (Franklin County) Hauer SSP2
- Today (2025)
- 157,827 people
- By 2030
- 158,933 · +0.7%
- By 2040
- 159,060 · +0.8%
- By 2050
- 155,132 · -1.7%
- By 2075
- 138,545 · -12.2%
- By 2100
- 112,321 · -28.8%
Race, ethnicity, and origin ACS 2023
- Neighborhood character
- Predominantly White (84%)
- Race & ethnicity
- White 84% Hispanic / Latino 7% Two or more races 5% Black 2% Asian 2%
- Hispanic origin (detail)
- Mexican 1% Puerto Rican 2%
- Common ancestry
- Romanian 3% Italian 3% Polish 1%
- Foreign-born
- 4% · Canada, Philippines
- Languages at home
- 92% English-only · Spanish 6% Other Asian/Pacific 1%
Political lean MEDSL · Franklin
- 2024 margin
- Solid R (+43.0) · D 28.1% · R 71.1%
- 2008→2024 swing
- -10.4pp toward R · 2008: -32.6pp · 2024: -43.0pp
- All cycles
- 2024: R+43.0 2020: R+43.1 2016: R+46.5 2012: R+38.5 2008: R+32.6
Not yet ingested
- Civics
- —
Market trends
- HPI YoY
- ▼ -81.86%
- Current HPI
- 232.0695
- Rent YoY
- —
- Metro
- —
- State GDP YoY
- ▲ 1.68%
- F500 in state
- 34
Industry mix (Fortune 500 HQ in PA)
| Industry | F500 HQs | Revenue |
|---|---|---|
| Healthcare | 2 | $309B |
|
||
| Insurance | 2 | $27B |
|
||
| Telecommunications / Media | 1 | $124B |
|
||
| Industrial Distribution | 1 | $22B |
|
||
| Financial Services | 1 | $20B |
|
||
| Chemicals / Materials | 1 | $18B |
|
||
Price history
-12.5% since first listed5 events — show timeline
- 2026-04-21 Pending — BRIGHT MLS
- 2026-03-28 Relisted — BRIGHT MLS
- 2026-03-06 Pending — BRIGHT MLS
- 2025-10-31 Price Changed $70,000 BRIGHT MLS
- 2025-07-20 Listed $80,000 BRIGHT MLS
Cash-flow waterfall
monthlySold comps — $/sqft
last 12 mo · ≤1 miLoading sold comps…