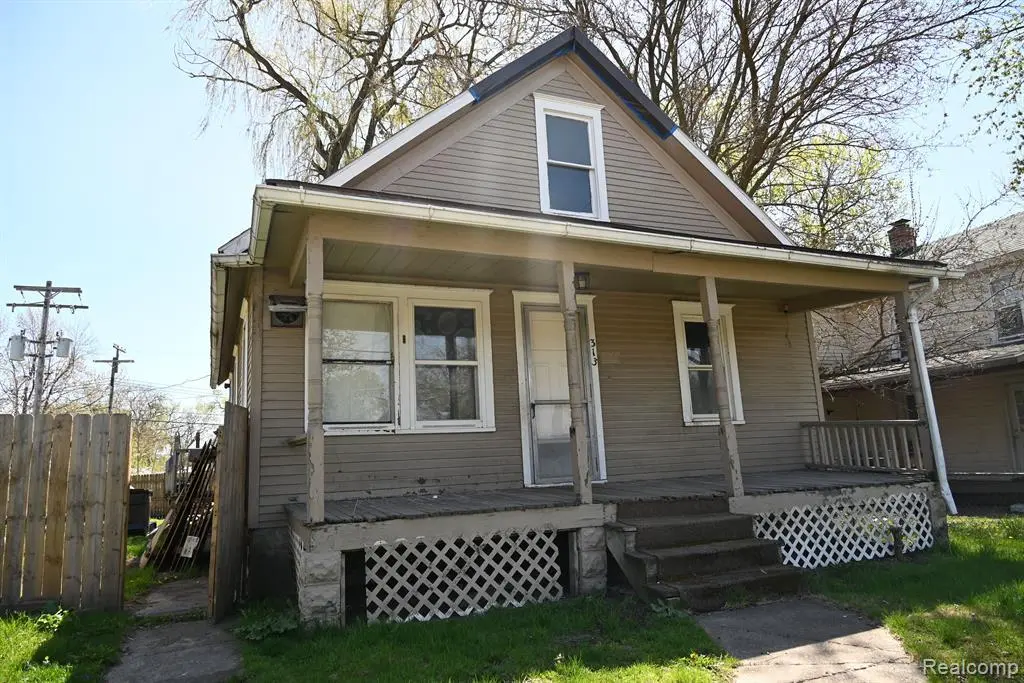
313 Kentucky Ave · Monroe, MI
Flood risk 1/10 · Minimal
- FEMA flood zone
- X (unshaded)
- Chance of flooding over 30 yrs
- 0.0%
- Est. flood insurance / yr
- $507 – $1,088
Fire risk 1/10 · Minimal
- Est. fire insurance / yr
- $784 – $1,456
Heat risk 3/10 · Minor
- Hot days now (above 101°F)
- 7 days/yr
- Hot days in 30 yrs
- 15 days/yr
Wind risk 2/10 · Minimal
- Chance of severe wind over 30 yrs
- —
Air-quality risk 4/10 · Minor
- Unhealthy air days now
- 3 days/yr
- Unhealthy air days in 30 yrs
- 6 days/yr
Risk factors via First Street. Map © Google.
Why this score? — see what drove the B- grade
The composite is a weighted blend of 9 inputs, each scored 0–100. Each bar is that input's sub-score; the figure is the points it added to the 100-point composite (weight × sub-score).
- Cash flow +30.0/30.0
- 1% rule +10.0/10.0
- DSCR +10.0/10.0
- ARV discount +7.5/15.0
- Livability +4.2/5.0
- Schools +3.0/10.0
- Rent growth +2.5/5.0
- Condition / age +2.5/5.0
- Appreciation +0.0/10.0
$38,900
🖨 Deal sheet 📄 Offer letter ✓ Due diligence
Listing remarks MLS
GREAT INVESTMENT OPPORTUNITY, WOULD MAKE A NICE RENTAL PROPERTY AS WELL. NEEDS SOME RENOVATION, GREAT POTENTIAL. CASH SALE ONLY, THEIR IS NO POWER ON AT THIS PROPERTY, BRING FLASHLIGHT IF SHOWING AT NIGHT. HOUSE IS BEING SOLD AS IS. SELLER HAS NEVER LIVED IN PROPERTY. B. A. T. V. A. I.
Key facts
- 7,841 sq ft lot
- Built 1918
- Listed 43 days
Property features AI
Finance
- Other: Pets allowed
Exterior
- Parking: No garage
- Utilities: Public water; Sewer available
- Home design: Single-family residence; One story; Ground-level entry with steps
- Construction: Aluminum siding; Asbestos exterior material; Asphalt roof
- Exterior features: Fenced yard; Paved road frontage with alley access; Shed on property
Interior
- Bathrooms: One full bathroom
- Heating & cooling: Forced air heating (natural gas); No central cooling
- Interior features: Full, unfinished basement; Five total rooms
Neighborhood map
What this means for you Summary
Snapshot
- This is a 2-bed/1.0-bath single-family listed at $39k.
Deal economics
- At list price, monthly cash flow is $617 ($7k/yr) — positive.
- The deal already cash-flows at list — no discount required.
- Meets the 1% rule at list price ($1k rent vs $39k).
- Recommended offer: $38k (3.0% below list) — sets the bar for market timing.
- Cap rate 25.3% vs local median 4.0% in Monroe — top-decile yield for the area; either an underpriced asset or a hidden risk that comps aren't pricing in. Stress-test before assuming the spread holds.
Location & tenants
- Location reads 83/100 on livability (#51 in MI, #1,034 nationally) — a professional / high-income tenant draw. Strengths: commute A+, cost of living A+, housing A+; Watch: employment C-, crime D+, amenities D+.
- Monroe Public Schools (suburban): math 24% / reading 47% proficiency, ranked #278 of 540 in MI (top 52%) — families likely to look elsewhere, expect single-tenant / working-renter base with shorter leases.
- Market conditions: 142 active listings in the ZIP; 7 comparable units currently listed for rent nearby; rentals lingering (median 44d on market — plan ~5-8 weeks vacancy on turnover, expect pricing pressure); 71% of comp listings sitting > 30 days — soft ceiling on asking rent; 264 units permitted in Monroe County in 2024 (40 in 5+ unit buildings).
Forward outlook
- Local home prices are declining (-3.0%/yr); year-one equity from $269 of loan paydown is wiped out by about $1k of value loss. Plan a longer hold.
- Monroe County population projected at -20% by 2050 — secular population decline; favor cash flow + early exit over multi-decade hold.
- At projected returns (-3.0% appreciation + 3.0% rent growth), your $11k cash investment doubles in ~2 years — after that, you're playing with house money.
Negotiation context
- It's been on market 44 days — a 3% lower offer ($38k) is reasonable based on typical stale-listing flexibility.
- 8 sale attempts since 9y ago with the ask held roughly flat each time — persistent listings suggest the price (not the market) is what's stuck; bring a comps-based counter.
- Current owner paid $14k; list at $39k implies a 180% gain — meaningful room to come down on a strong offer.
Risks & watch-outs
- Watch-outs: built in 1918 — expect roof / HVAC / electrical / plumbing capex.
Questions for the listing agent
- It's been on market 44 days. Have you received any prior offers? Is the seller open to a 3% concession, seller financing, or rate buy-down credit?
- Built in 1918 — when were the roof, HVAC, electrical panel, plumbing, and water heater last replaced?
- Is there a deadline driving the sale (1031 exchange, divorce, estate, relocation)? That informs how much negotiation room exists.
- Schools are D-rated, which usually means shorter tenancies and higher turnover. Who's the typical renter profile here, and what's been the actual vacancy rate?
- Crime grade is D in this area — have there been break-ins, vandalism, or insurance claims at this property in the last 3 years? What carrier currently insures it and at what premium?
- What's the average days-on-market for RENTAL listings here right now (not sales)? A rising rental-DOM trend means longer vacancies and softer asking-rent achievability than the comps imply.
- What's the recent tenant-quality profile in this submarket — average credit score on applications, eviction rate, late-payment / NSF rate, and stable-employment percentage? A property-management company in the area should have these aggregated.
- How much new for-sale + rental construction is in the pipeline within 1–3 miles? Heavy new supply typically softens prices + rents 12–24 months out; constrained supply supports both.
Investment metrics
- 1% rule
- 2.86% ✓
- Cap rate
- 25.32%
- Cash-on-cash
- 67.94%
- DSCR
- 4.02
- GRM
- 2.9
CMA / ARV
- ARV (median comp)
- $100,088
- List price
- $38,900
- Delta
- -61.13%
- Verdict
- UNDERPRICED
- Comps
- 20 within 1.0 mi
Show comp detail 12 sales within ~0.75 mi
| Address | Dist | Beds/Ba | Sqft | Sold | Price | $/sf | Match |
|---|---|---|---|---|---|---|---|
| 314 Half St | 0.17mi | 2/1.0 | 806 (-7%) | 4mo | $119,000 | $148 | 76 |
| 1440 Oak St | 0.43mi | 2/1.0 | 864 (-1%) | 11mo | $54,000 | $63 | 70 |
| 419 Almyra Ave | 0.27mi | 3/1.0 (+1) | 913 (+5%) | 6mo | $90,000 | $99 | 69 |
| 606 Church St | 0.23mi | 2/1.0 | 949 (+9%) | 6mo | $60,000 | $63 | 69 |
| 516 Eastchester St | 0.19mi | 3/1.0 (+1) | 932 (+7%) | 8mo | $139,900 | $150 | 68 |
| 934 E 9th St | 0.42mi | 3/1.0 (+1) | 832 (-4%) | 7mo | $142,000 | $171 | 62 |
| 635 Laplaisance Rd | 0.51mi | 3/1.0 (+1) | 825 (-5%) | 2mo | $155,000 | $188 | 61 |
| 208 Maple Blvd | 0.65mi | 2/1.0 | 880 (+1%) | 11mo | $148,000 | $168 | 58 |
| 1763 Oak St | 0.66mi | 3/1.0 (+1) | 888 (+2%) | 3mo | $149,000 | $168 | 58 |
| 916 Cherry St | 0.52mi | 3/1.0 (+1) | 960 (+10%) | 6mo | $228,000 | $238 | 49 |
| 306 Arbor St | 0.72mi | 2/1.0 | 978 (+12%) | 5mo | $147,000 | $150 | 42 |
| 1810 Peters St | 0.67mi | 3/1.0 (+1) | 760 (-13%) | 4mo | $66,000 | $87 | 39 |
Match score weights: distance 35% · size 25% · config 20% · recency 20%. Top-matched comps best support the ARV.
Projected returns pro-forma
-3.0% appreciation · 3.0% rent growth · sell at horizon
- IRR
- 67.3%
- Equity multiple
- 4.03×
- Total profit
- $32,987
- Equity at exit
- $5,800
- IRR
- 71.5%
- Equity multiple
- 8.29×
- Total profit
- $79,353
- Equity at exit
- $3,363
Cash invested: $10,892 (down + closing). Projections, not guarantees.
Landlord ↔ Tenant lean methodology
- Overall (STATE)
- 62 Landlord-Friendly
- State Michigan
- 62 Landlord-Friendly · EVEN
- County
- — inherits STATE
- City
- — inherits STATE
ZIP-level market 48161
- Active inventory
- 142
- Price-to-rent
- 2.9×
Monthly cashflow live
- Estimated rent
- $1,113 high interval (Pro) →
- Mortgage (P&I)
- −$204
- Tax from tax record
- −$42 /mo · $505/yr
- Insurance
- −$16
- HOA
- −$0
- Vacancy / Maint / Mgmt
- −$234
- Net cashflow
- $617
Break-even live
UW: 25.0% down · 7.5% · 30yr · 1.5% tax · 5.0% vac · 8.0% maint · 8.0% mgmt
Financing live
Cash to close
- Down payment
- $9,725
- Closing costs
- $1,167
- Reserves months
- —
- Total cash needed
- —
Loan-product check · same deal, 3 products live
Conventional
25% down · 7.5% · 30yr
- Down + closing
- —
- Monthly P&I
- —
- Monthly cashflow
- —
- DSCR
- —
- Eligible?
- —
Personal DTI + credit; lowest rate.
DSCR
20% down · 8.5% · 30yr
- Down + closing
- —
- Monthly P&I
- —
- Monthly cashflow
- —
- DSCR
- —
- Eligible?
- —
No personal income docs; deal must DSCR.
Hard money
10% down · 12.0% · 12mo
- Down + closing
- —
- Monthly P&I
- —
- Monthly cashflow
- —
- DSCR
- —
- Eligible?
- —
Short-term bridge; refi at stabilization.
Rent comps 7 comps
| Address | Beds | Baths | Sqft | Rent | $/sqft | DOM | Units | Dist |
|---|---|---|---|---|---|---|---|---|
| 739 Washington St Monroe, MI | 2.0 | 2.0 | 853 | $995 | $1.17 | 43d | 1 | 0.69mi |
| 733 Smith St Monroe, MI | 3.0 | 1.5 | 1000 | $1,500 | $1.50 | 43d | 1 | 0.99mi |
| 411 W 3rd St Unit 2 Monroe, MI | 1.0 | 1.0 | 700 | $700 | $1.00 | 43d | 1 | 1.04mi |
| 1450 S Monroe St Monroe, MI | 1.0–2.0 | 1.0–2.0 | 851 | $1,350 | $1.59 | 23d | 1 | 1.18mi |
| 765 N Macomb St Monroe, MI | 2.0 | 1.0 | 1050 | $1,150 | $1.10 | 43d | 1 | 1.26mi |
| 767 N Macomb St Monroe, MI | 2.0 | 1.0 | 1050 | $1,150 | $1.10 | 43d | 1 | 1.27mi |
| 927 N Macomb St Monroe, MI | 1.0 | 1.0 | 900 | $1,195 | $1.33 | 18d | 1 | 1.38mi |
Listing history 46 events
-
2026-06-18days on market $38,900 Active 44 DOM
-
2026-06-17days on market $38,900 Active 43 DOM
-
2026-06-16days on market $38,900 Active 42 DOM
-
2026-06-15days on market $38,900 Active 41 DOM
-
2026-06-14days on market $38,900 Active 39 DOM
-
2026-06-12days on market $38,900 Active 38 DOM
-
2026-06-09days on market $38,900 Active 35 DOM
-
2026-06-08days on market $38,900 Active 34 DOM
-
2026-06-07days on market $38,900 Active 33 DOM
-
2026-06-05days on market $38,900 Active 30 DOM
-
2026-06-02days on market $38,900 Active 28 DOM
-
2026-06-01days on market $38,900 Active 27 DOM
-
2026-05-31days on market $38,900 Active 26 DOM
-
2026-05-30days on market $38,900 Active 25 DOM
Show marketing remark (286 chars)
GREAT INVESTMENT OPPORTUNITY, WOULD MAKE A NICE RENTAL PROPERTY AS WELL. NEEDS SOME RENOVATION, GREAT POTENTIAL. CASH SALE ONLY, THEIR IS NO POWER ON AT THIS PROPERTY, BRING FLASHLIGHT IF SHOWING AT NIGHT. HOUSE IS BEING SOLD AS IS. SELLER HAS NEVER LIVED IN PROPERTY. B. A. T. V. A. I.
-
2026-05-05$39,900 Active 286-char remark
Show marketing remark (286 chars)
GREAT INVESTMENT OPPORTUNITY, WOULD MAKE A NICE RENTAL PROPERTY AS WELL. NEEDS SOME RENOVATION, GREAT POTENTIAL. CASH SALE ONLY, THEIR IS NO POWER ON AT THIS PROPERTY, BRING FLASHLIGHT IF SHOWING AT NIGHT. HOUSE IS BEING SOLD AS IS. SELLER HAS NEVER LIVED IN PROPERTY. B. A. T. V. A. I.
-
2025-10-12historical
-
2025-10-07price $38,900
-
2025-10-06price $38,900
-
2025-09-22price $39,899
-
2025-09-22price $39,899
-
2025-09-13price $39,900
-
2025-09-13status Active
-
2025-09-13status Active
-
2025-09-13price $39,900
-
2025-09-10historical
-
2025-08-09price $44,500
-
2025-08-08price $44,500
-
2025-07-23price $44,900
-
2025-07-23price $44,900
-
2025-07-13price $49,900
-
2025-07-13price $49,900
-
2025-05-18price $49,000
-
2025-05-18price $49,000
-
2025-05-04price $49,900
-
2025-05-04price $49,900
-
2025-05-01price $54,900
-
2025-04-30price $54,900
-
2025-04-29$59,900 Active
-
2025-04-28$59,900 Active
-
2017-10-20soldstatus $13,900
-
2017-10-20soldstatus $13,900 Closed
-
2017-08-17status Pending
-
2017-07-14$14,900 Active
-
2017-07-12$14,900
-
2002-09-16soldstatus $50,000
ⓘ Source: listings_history table (triggers on properties + properties_extension) + one-shot
backfill from property_details.listing_events for pre-trigger history.
Tax reassessment forecast MI · Partial reset (capped growth)
- Current annual tax
- $505 · $42/mo
- Projected year-2 tax
- $552 · $46/mo
- Expected delta
- +$47/yr (+$4/mo · 9.3%)
ⓘ Screening estimate from a state-policy table — verify with the county assessor before closing.
Climate risk First Street
- Flood 1/10 Low FEMA zone X (unshaded) · 0% chance over 30 yrs
- Wildfire 1/10 Low
- Heat 3/10 Moderate 7 d/yr ≥101°F today · 15 d/yr by 30 yrs out
- Wind 2/10 Low
- Air quality 4/10 Moderate 3 unhealthy d/yr today · 6 by 30 yrs out
Nearby sold comps map
Loading sold comps map…
Walkable amenities ~0.75 mi
Loading nearby amenities…
Taxation est. · year 1
- Rental income
- $13,352
- − Mortgage interest
- −$2,179
- − Property taxes
- −$505
- − Insurance
- −$194
- − Repairs & maintenance
- −$1,068
- − Management
- −$1,068
- − Depreciation
- −$1,132
- Taxable income
- $7,205
- Est. tax owed @ 24.0%
- −$1,729
- After-tax cash flow
- $5,671/yr
For passive investors: Depreciation is non-cash, so a rental often shows a tax loss while cash-flowing — sheltering income. Rental losses are passive: they offset passive income freely, and up to $25,000/yr can offset ordinary (W-2) income if you actively participate and your MAGI is under $100k (phasing out to $0 by $150k); unused losses carry forward. On sale, claimed depreciation is recaptured at up to 25%, and gains may owe capital-gains tax (a 1031 exchange can defer both). Figures are a year-1 estimate at your 24.0% rate — not tax advice; consult a CPA.
Schools (NCES district)
- District
- Monroe Public Schools
- NCES district ID
- 2624150
- Math proficiency
- 24% ▲ 3.00%
- Reading proficiency
- 47% ▲ 12.00%
- Median HH income
- $46,437
- Composite
- 30.33/100
- National rank
- #6269
- State rank
- #278 of 540 in MI
Livability — Monroe
- Score
- 83/100
- State rank
- #51
- US rank
- #1034
Category grades
Schools grade is shown separately in the Schools card above.
Census & demographics
- Census place
- Monroe, MI
- County
- Monroe County · 54,460 people
- Metro
- Monroe, MI
- Population (ZIP)
- 26,304
- Household income
- $67,414
- Rent vs Own
- Severe rent burden
- 733.0
Population outlook (Monroe County) Hauer SSP2
- Today (2025)
- 144,439 people
- By 2030
- 140,033 · -3.1%
- By 2040
- 128,408 · -11.1%
- By 2050
- 115,024 · -20.4%
- By 2075
- 87,273 · -39.6%
- By 2100
- 63,110 · -56.3%
Race, ethnicity, and origin ACS 2023
- Neighborhood character
- Predominantly White (85%)
- Race & ethnicity
- White 85% Two or more races 7% Black 5% Hispanic / Latino 5%
- Common ancestry
- Lithuanian 10% Romanian 8% Italian 2%
- Foreign-born
- 3% · Canada, Jamaica
- Languages at home
- 96% English-only · Spanish 2% Other Indo-European 1% Arabic 1%
Political lean MEDSL · Monroe
- 2024 margin
- Strong R (+27.1) · D 35.7% · R 62.9% · Other 1.4%
- 2008→2024 swing
- -31.5pp toward R · 2008: 4.3pp · 2024: -27.1pp
- All cycles
- 2024: R+27.1 2020: R+22.6 2016: R+22.1 2012: D+1.0 2008: D+4.3
Not yet ingested
- Civics
- —
Market trends
- HPI YoY
- ▼ -178.99%
- Current HPI
- 126.2638
- Rent YoY
- —
- Metro
- Monroe, MI
- State GDP YoY
- ▲ 1.37%
- F500 in state
- 28
Industry mix (Fortune 500 HQ in MI)
| Industry | F500 HQs | Revenue |
|---|---|---|
| Automotive Parts | 3 | $48B |
|
||
| Automotive | 2 | $372B |
|
||
| Chemicals | 1 | $45B |
|
||
| Automotive Retail | 1 | $29B |
|
||
| Healthcare / Medical Devices | 1 | $23B |
|
||
| Automotive Technology | 1 | $20B |
|
||
Price history
-22.2% since first listed34 events — show timeline
- 2026-05-30 Price Changed $38,900 MiRealSource-MiMLS
- 2026-05-30 Price Changed $38,900 REALCOMP
- 2026-05-05 Listed $39,900 REALCOMP
- 2026-05-05 Listed $39,900 MiRealSource-MiMLS
- 2025-10-12 Listing Removed — MiRealSource-MiMLS
- 2025-10-07 Price Changed $38,900 MiRealSource-MiMLS
- 2025-10-06 Price Changed $38,900 REALCOMP
- 2025-09-22 Price Changed $39,899 MiRealSource-MiMLS
- 2025-09-22 Price Changed $39,899 REALCOMP
- 2025-09-13 Price Changed $39,900 MiRealSource-MiMLS
- 2025-09-13 Relisted — MiRealSource-MiMLS
- 2025-09-13 Relisted — REALCOMP
- 2025-09-13 Price Changed $39,900 REALCOMP
- 2025-09-10 Listing Removed — MiRealSource-MiMLS
- 2025-08-09 Price Changed $44,500 MiRealSource-MiMLS
- 2025-08-08 Price Changed $44,500 REALCOMP
- 2025-07-23 Price Changed $44,900 MiRealSource-MiMLS
- 2025-07-23 Price Changed $44,900 REALCOMP
- 2025-07-13 Price Changed $49,900 MiRealSource-MiMLS
- 2025-07-13 Price Changed $49,900 REALCOMP
- 2025-05-18 Price Changed $49,000 MiRealSource-MiMLS
- 2025-05-18 Price Changed $49,000 REALCOMP
- 2025-05-04 Price Changed $49,900 MiRealSource-MiMLS
- 2025-05-04 Price Changed $49,900 REALCOMP
- 2025-05-01 Price Changed $54,900 MiRealSource-MiMLS
- 2025-04-30 Price Changed $54,900 REALCOMP
- 2025-04-29 Listed $59,900 REALCOMP
- 2025-04-28 Listed $59,900 MiRealSource-MiMLS
- 2017-10-20 Sold (MLS) $13,900 MiRealSource-MiMLS
- 2017-10-20 Sold (MLS) $13,900 REALCOMP
- 2017-08-17 Pending — MiRealSource-MiMLS
- 2017-07-14 Listed $14,900 MiRealSource-MiMLS
- 2017-07-12 Listed $14,900 REALCOMP
- 2002-09-16 Sold (Public Records) $50,000 Public Records
Property tax history
-0.1%/yrLatest (2025): $505 · -36.7% YoY. Source: county tax records.
Cash-flow waterfall
monthlySold comps — $/sqft
last 12 mo · ≤1 miLoading sold comps…