 🌊 Lakefront
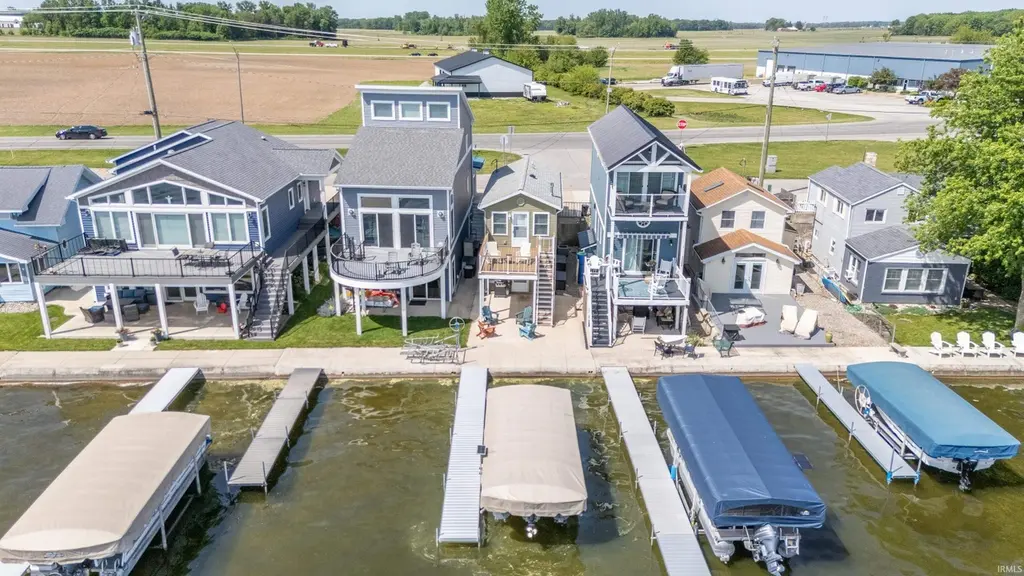
2509 Barrett Rd · Rochester, IN
Flood risk 1/10 · Minimal
- FEMA flood zone
- X (unshaded)
- Chance of flooding over 30 yrs
- 0.0%
- Est. flood insurance / yr
- $507 – $1,088
Fire risk 1/10 · Minimal
- Est. fire insurance / yr
- $717 – $1,331
Heat risk 2/10 · Minimal
- Hot days now (above 100°F)
- 7 days/yr
- Hot days in 30 yrs
- 16 days/yr
Wind risk 2/10 · Minimal
- Chance of severe wind over 30 yrs
- —
Air-quality risk 3/10 · Minor
- Unhealthy air days now
- 1 days/yr
- Unhealthy air days in 30 yrs
- 3 days/yr
Risk factors via First Street. Map © Google.
Why this score? — see what drove the D grade
The composite is a weighted blend of 9 inputs, each scored 0–100. Each bar is that input's sub-score; the figure is the points it added to the 100-point composite (weight × sub-score).
- Cash flow +15.0/30.0
- ARV discount +7.5/15.0
- 1% rule +5.0/10.0
- DSCR +5.0/10.0
- Livability +3.5/5.0
- Schools +3.0/10.0
- Rent growth +2.5/5.0
- Condition / age +2.5/5.0
- Appreciation +0.0/10.0
$1
🖨 Deal sheet 📄 Offer letter ✓ Due diligence
Listing remarks MLS
Absolutely adorable lakefront home, custom built new in 2016! Such nice quality, with open kitchen/great room, vaulted ceilings and gas fireplace on main level. Entry has both coat closet and pantry and cute half bath. Lower level has all mechanicals, laundry, full bath with tub/shower and the rest of the walkout space as large master bedroom suite, or creative sleeping space! Maintenance free wood-laminate flooring and bright white painted doors/trim throughout entire home. Fantastic north shore, main lake views of Lake Manitou. You won't find a better price point on the lake! Less is so much more!
Key facts
- Furnished lake home
- Brand new lift
- Fully updated
Tags
Property features AI
Finance
- HOA & community: No association amenities
Exterior
- Parking: Concrete parking surface
- Security: Smoke detector(s)
- Utilities: Public water; Public sewer; Cable connected; Public power
- Home design: Single-family residence (site-built); 2 stories
- Construction: Vinyl siding
- Exterior features: Deck; Patio; Porch; Storm door(s); No fencing; Shingle roof; Waterfront lot on Lake Manitou
Interior
- Kitchen: Disposal; Dishwasher; Microwave; Refrigerator; Electric cooktop; Electric oven
- Bedrooms: Total of 3 rooms
- Flooring: Vinyl flooring
- Bathrooms: 1 full bathroom; 1 half bathroom; One full bathroom on the main level
- Heating & cooling: Central air; Ceiling fan cooling; Natural gas forced-air heating; Gas water heater
- Interior features: Ceiling fans; Eat-in kitchen; Open floorplan; Laminate countertops; Blinds on windows; Finished basement with walk-out access and sump pump; Gas-log ventless fireplace in the living room
- Laundry & utility: Washer and dryer included; Washer hookup; Electric dryer hookup; Gas dryer hookup; Main-level laundry
Neighborhood map
What this means for you Summary
Snapshot
- This is a 1-bed/1.5-bath single-family listed at $1.
Deal economics
- At list price, monthly cash flow is $686 ($8k/yr) — positive.
- The deal already cash-flows at list — no discount required.
- Meets the 1% rule at list price ($868 rent vs $1).
- Cap rate 823042.1% vs local median 2.4% in Rochester — top-decile yield for the area; either an underpriced asset or a hidden risk that comps aren't pricing in. Stress-test before assuming the spread holds.
Location & tenants
- Location reads 69/100 on livability (#206 in IN) — a middle-class / working-renter tenant base. Strengths: cost of living A+, housing A+, health & safety A; Watch: employment D, amenities F, commute F.
- Rochester Community School Corporation (town): math 31% / reading 41% proficiency, ranked #188 of 301 in IN (top 62%) — families likely to look elsewhere, expect single-tenant / working-renter base with shorter leases.
- Zoned schools: Rochester Community Middle School (math 28% / reading 42%, grade F, #164 of 330 statewide, top 50%, 317 students, 58% FRL); Rochester Community High School (math 27% / reading 62%, grade F, #169 of 369 statewide, top 51%, 610 students, 57% FRL) — zoned schools average 57% FRL vs 41% district-wide (16 pts higher); higher-poverty schools than district average — tighter screening recommended.
- Market conditions: 97 active listings in the ZIP; 2 comparable units currently listed for rent nearby; 23 units permitted in Fulton County in 2024 (0 in 5+ unit buildings).
- This rent is only 17% of the median local income ($61k/yr) — well below the 30% rent-burden line; pricing power to push rent on renewal without tenant pushback.
Forward outlook
- Local home prices are declining (-3.0%/yr); year-one equity from $0 of loan paydown is wiped out by about $0 of value loss. Plan a longer hold.
- Fulton County population projected at -13% by 2050 — secular population decline; favor cash flow + early exit over multi-decade hold.
- At projected returns (-3.0% appreciation + 3.0% rent growth), your $0 cash investment doubles in ~1 year — after that, you're playing with house money.
Negotiation context
- Only 10 days on market — expect competitive offers; lowballing is unlikely to land.
- 2 sale attempts since 6y ago with the ask held roughly flat each time — persistent listings suggest the price (not the market) is what's stuck; bring a comps-based counter.
Questions for the listing agent
- Is there a deadline driving the sale (1031 exchange, divorce, estate, relocation)? That informs how much negotiation room exists.
- Schools are F-rated, which usually means shorter tenancies and higher turnover. Who's the typical renter profile here, and what's been the actual vacancy rate?
- The area grade is low — what's the realistic commute time and amenity access for the typical tenant pool here? Any planned neighborhood developments (good or bad) we should know about?
- This sits on a lake — are riparian / water-frontage rights deeded with the parcel? Any dock permits, shoreline easements, or HOA water-use restrictions?
- What's the documented flood / surge / shoreline-erosion history here (FEMA AND non-FEMA — e.g., storm surge, creek backup, septic-field saturation)?
- Any water-quality or seasonal algae-bloom issues that affect tenant satisfaction or short-term-rental demand?
- What's the average days-on-market for RENTAL listings here right now (not sales)? A rising rental-DOM trend means longer vacancies and softer asking-rent achievability than the comps imply.
- What's the recent tenant-quality profile in this submarket — average credit score on applications, eviction rate, late-payment / NSF rate, and stable-employment percentage? A property-management company in the area should have these aggregated.
- How much new for-sale + rental construction is in the pipeline within 1–3 miles? Heavy new supply typically softens prices + rents 12–24 months out; constrained supply supports both.
Investment metrics
- 1% rule
- 86819.00% ✓
- Cap rate
- 823042.12%
- Cash-on-cash
- 2939413.67%
- DSCR
- 130788.37
- GRM
- 0.0
CMA / ARV
No comps found within radius.
Projected returns pro-forma
-3.0% appreciation · 3.0% rent growth · sell at horizon
- IRR
- —
- Equity multiple
- 156057.89×
- Total profit
- $43,696
- Equity at exit
- $0
- IRR
- —
- Equity multiple
- 336971.33×
- Total profit
- $94,352
- Equity at exit
- $0
Cash invested: $0 (down + closing). Projections, not guarantees.
Landlord ↔ Tenant lean methodology
- Overall (STATE)
- 90 Strongly Landlord-Friendly
- State Indiana
- 90 Strongly Landlord-Friendly · R+11
- County
- — inherits STATE
- City
- — inherits STATE
ZIP-level market 46975
- Home prices YoY
- -28.7%
- Active inventory
- 97
Monthly cashflow live
- Estimated rent
- $868 medium interval (Pro) →
- Mortgage (P&I)
- −$0
- Tax est. 1.5%
- −$0 /mo · $0/yr
- Insurance
- −$0
- HOA
- −$0
- Vacancy / Maint / Mgmt
- −$182
- Net cashflow
- $686
Break-even live
UW: 25.0% down · 7.5% · 30yr · 1.5% tax · 5.0% vac · 8.0% maint · 8.0% mgmt
Financing live
Cash to close
- Down payment
- $0
- Closing costs
- $0
- Reserves months
- —
- Total cash needed
- —
Loan-product check · same deal, 3 products live
Conventional
25% down · 7.5% · 30yr
- Down + closing
- —
- Monthly P&I
- —
- Monthly cashflow
- —
- DSCR
- —
- Eligible?
- —
Personal DTI + credit; lowest rate.
DSCR
20% down · 8.5% · 30yr
- Down + closing
- —
- Monthly P&I
- —
- Monthly cashflow
- —
- DSCR
- —
- Eligible?
- —
No personal income docs; deal must DSCR.
Hard money
10% down · 12.0% · 12mo
- Down + closing
- —
- Monthly P&I
- —
- Monthly cashflow
- —
- DSCR
- —
- Eligible?
- —
Short-term bridge; refi at stabilization.
Rent comps 2 comps
| Address | Beds | Baths | Sqft | Rent | $/sqft | DOM | Units | Dist |
|---|---|---|---|---|---|---|---|---|
| 2203 Indiana 14 Rochester, IN | 2.0 | 1.0 | 650 | $950 | $1.46 | 43d | 1 | 0.25mi |
| 2203 E State Road 14 Unit 3 Rochester, IN | 2.0 | 1.0 | 650 | $950 | $1.46 | 43d | 1 | 0.25mi |
Listing history 8 events
-
2026-06-18days on market $1 Active 10 DOM
-
2026-06-17days on market $1 Active 9 DOM
-
2026-06-16days on market $1 Active 8 DOM
-
2026-06-15days on market $1 Active 7 DOM
-
2026-06-14days on market $1 Active 5 DOM
-
2026-06-10days on market $1 Active 2 DOM
-
2026-06-09remarks 687-char remark
-
2026-06-09$1 Active 1 DOM
ⓘ Source: listings_history table (triggers on properties + properties_extension) + one-shot
backfill from property_details.listing_events for pre-trigger history.
Climate risk First Street
- Flood 1/10 Low FEMA zone X (unshaded) · 0% chance over 30 yrs
- Wildfire 1/10 Low
- Heat 2/10 Low 7 d/yr ≥100°F today · 16 d/yr by 30 yrs out
- Wind 2/10 Low
- Air quality 3/10 Moderate 1 unhealthy d/yr today · 3 by 30 yrs out
Nearby sold comps map
Loading sold comps map…
Walkable amenities ~0.75 mi
Loading nearby amenities…
Taxation est. · year 1
- Rental income
- $10,418
- − Mortgage interest
- −$0
- − Property taxes
- −$0
- − Insurance
- −$0
- − Repairs & maintenance
- −$833
- − Management
- −$833
- − Depreciation
- −$0
- Taxable income
- $8,751
- Est. tax owed @ 24.0%
- −$2,100
- After-tax cash flow
- $6,130/yr
For passive investors: Depreciation is non-cash, so a rental often shows a tax loss while cash-flowing — sheltering income. Rental losses are passive: they offset passive income freely, and up to $25,000/yr can offset ordinary (W-2) income if you actively participate and your MAGI is under $100k (phasing out to $0 by $150k); unused losses carry forward. On sale, claimed depreciation is recaptured at up to 25%, and gains may owe capital-gains tax (a 1031 exchange can defer both). Figures are a year-1 estimate at your 24.0% rate — not tax advice; consult a CPA.
Schools (NCES district)
- District
- Rochester Community School Corporation
- NCES district ID
- 1809630
- Math proficiency
- 31% ▼ -4.00%
- Reading proficiency
- 41% ▲ 2.00%
- Median HH income
- $42,645
- Composite
- 30.44/100
- National rank
- #6231
- State rank
- #188 of 301 in IN
Livability — Rochester
- Score
- 69/100
- State rank
- #206
- US rank
- #9060
Category grades
Schools grade is shown separately in the Schools card above.
Census & demographics
- Census place
- Rochester, IN
- County
- Fulton County · 13,824 people
- City population
- 13,824
- Metro
- nan
- Population (ZIP)
- 13,824
- Household income
- $61,185
- Rent vs Own
- Severe rent burden
- 238.0
Population outlook (Fulton County) Hauer SSP2
- Today (2025)
- 19,537 people
- By 2030
- 19,013 · -2.7%
- By 2040
- 17,959 · -8.1%
- By 2050
- 17,038 · -12.8%
- By 2075
- 15,117 · -22.6%
- By 2100
- 13,179 · -32.5%
Race, ethnicity, and origin ACS 2023
- Neighborhood character
- Predominantly White (91%)
- Race & ethnicity
- White 91% Hispanic / Latino 4% Two or more races 3%
- Common ancestry
- Iranian 2% Scottish 2% Lithuanian 2%
- Foreign-born
- 1% · Canada
- Languages at home
- 97% English-only · German/W. Germanic 2% Spanish 1%
Political lean MEDSL · Fulton
- 2024 margin
- Solid R (+51.2) · D 23.7% · R 74.9% · Other 1.4%
- 2008→2024 swing
- -35.2pp toward R · 2008: -16.0pp · 2024: -51.2pp
- All cycles
- 2024: R+51.2 2020: R+48.2 2016: R+48.4 2012: R+33.2 2008: R+16.0
Not yet ingested
- Civics
- —
Market trends
- HPI YoY
- ▼ -85.72%
- Current HPI
- 212.9033
- Rent YoY
- —
- Metro
- nan
- State GDP YoY
- ▲ 2.90%
- F500 in state
- 18
Industry mix (Fortune 500 HQ in IN)
| Industry | F500 HQs | Revenue |
|---|---|---|
| Industrial Machinery | 2 | $37B |
|
||
| Healthcare | 1 | $177B |
|
||
| Pharmaceuticals | 1 | $45B |
|
||
| Metals / Steel | 1 | $18B |
|
||
| Agriculture | 1 | $17B |
|
||
| Packaging | 1 | $12B |
|
||
Price history
+34.0% since first listed4 events — show timeline
- 2026-06-08 Listed $1 IRMLS
- 2020-04-03 Sold (MLS) $205,000 IRMLS
- 2020-02-04 Listed $225,000 IRMLS
- 2015-12-29 Sold (Public Records) $153,000 Public Records
Property tax history
+8.8%/yrLatest (2024): $3,468 · +3.3% YoY. Source: county tax records.
Cash-flow waterfall
monthlySold comps — $/sqft
last 12 mo · ≤1 miLoading sold comps…