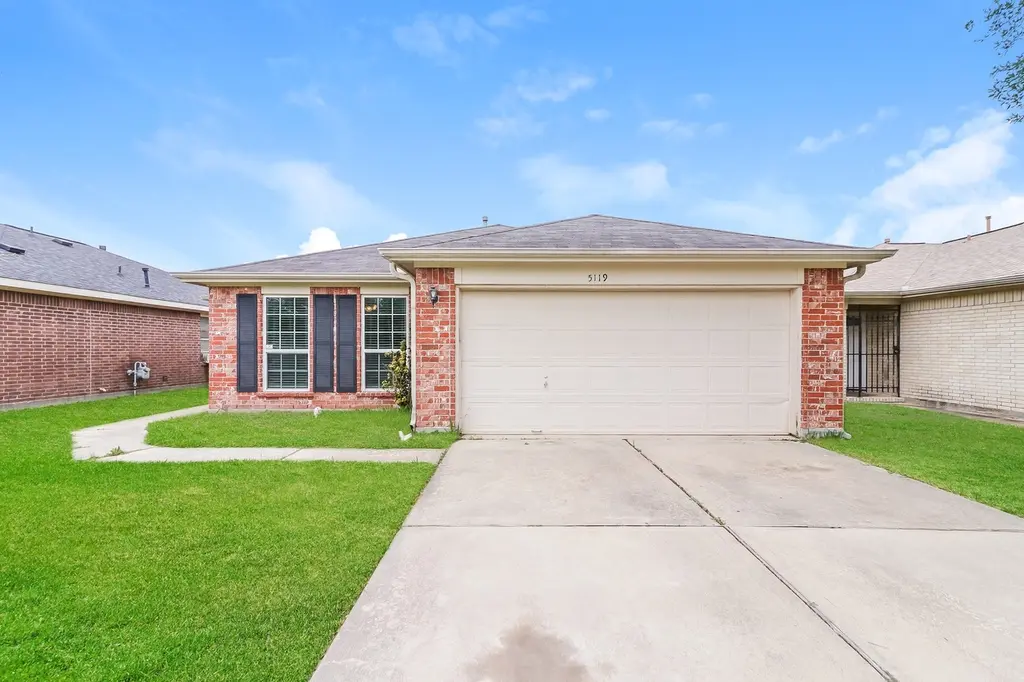
5119 Panay Park Dr · Houston, TX
Flood risk 1/10 · Minimal
- FEMA flood zone
- X (unshaded)
- Chance of flooding over 30 yrs
- 0.0%
- Est. flood insurance / yr
- $507 – $1,088
Fire risk 1/10 · Minimal
- Est. fire insurance / yr
- $1,222 – $2,270
Heat risk 9/10 · Severe
- Hot days now (above 108°F)
- 7 days/yr
- Hot days in 30 yrs
- 25 days/yr
Wind risk 9/10 · Severe
- Chance of severe wind over 30 yrs
- 99.0%
Air-quality risk 2/10 · Minimal
- Unhealthy air days now
- 1 days/yr
- Unhealthy air days in 30 yrs
- 2 days/yr
Risk factors via First Street. Map © Google.
Why this score? — see what drove the F grade
The composite is a weighted blend of 9 inputs, each scored 0–100. Each bar is that input's sub-score; the figure is the points it added to the 100-point composite (weight × sub-score).
- Cash flow +8.1/30.0
- Appreciation +6.3/10.0
- Livability +3.7/5.0
- 1% rule +2.9/10.0
- Rent growth +2.8/5.0
- Schools +2.7/10.0
- Condition / age +2.5/5.0
- DSCR +2.1/10.0
- ARV discount +0.0/15.0
$237,700
🖨 Deal sheet 📄 Offer letter ✓ Due diligence
Listing remarks MLS
Spacious, newly renovated house on a quiet street. This 4 bedroom 2 bathroom house features large rooms, new floors/carpets, light fixtures and a 2 car garage! Large backyard perfect for entertaining friends and family. Come schedule your showing today, won’t last long! (all room measurements are approximates)
Key facts
- Quiet street
- Fenced in back yard
- 7,331 sq ft lot
Tags
Property features AI
Finance
- Financial info: Lease not considered
Exterior
- Parking: Attached garage with 2 parking spaces
- Utilities: Public water; Public sewer
- Home design: Residential property; Built in 2015; Slab foundation
- Construction: Brick construction; Composition roof
- Exterior features: Lot approximately 7,330 square feet; Lot features: Other
Interior
- Bedrooms: Primary bedroom on the first floor (13 x 11); Bedroom on the first floor (11 x 10); Bedroom on the first floor (9 x 10); Bedroom on the first floor (9 x 10)
- Bathrooms: 2 full bathrooms
- Heating & cooling: Central electric heating; Central electric cooling (Central Air)
- Interior features: 4 total rooms; Seller disclosure available
Neighborhood map
What this means for you Summary
Snapshot
- This is a 4-bed/2.0-bath single-family listed at $238k.
Deal economics
- At list price, monthly cash flow is $-236 ($-3k/yr) — negative.
- To cash-flow at today's rent, offer at most $196k (17.5% below list).
- To meet the 1% rule (rent ≥ 1% of price), the offer needs to be $188k (20.7% below list).
- Recommended offer: $188k (20.7% below list) — sets the bar for 1% rule.
- Cap rate 5.1% vs local median 3.2% in Houston — top-decile yield for the area; either an underpriced asset or a hidden risk that comps aren't pricing in. Stress-test before assuming the spread holds.
Location & tenants
- Location reads 74/100 on livability (#184 in TX, #4,771 nationally) — a middle-class / working-renter tenant base. Strengths: amenities A+, cost of living A+, housing A+; Watch: crime F.
- Houston ISD (urban): math 27% / reading 35% proficiency, ranked #593 of 826 in TX (top 72%) — families likely to look elsewhere, expect single-tenant / working-renter base with shorter leases; 71% free/reduced lunch — lower-income household profile, screen leases tightly.
- Zoned schools: Thomas Middle (math 3% / reading 13%, grade F, #1,654 of 1,662 statewide, top 100%, 526 students, 98% FRL); Sterling H S (math 16% / reading 27%, grade F, #1,377 of 1,632 statewide, top 85%, 1,421 students, 92% FRL) — zoned schools average 95% FRL vs 71% district-wide (24 pts higher); higher-poverty schools than district average — tighter screening recommended.
- Zoned-school proficiency averages 15% at this address vs 31% district-wide (-16 pts) — the specific schools serving this property underperform the Houston ISD average; the district grade overstates school quality for this exact location.
- Market conditions: Rents rising (+1.2%/yr); 303 active listings in the ZIP; 21 comparable units currently listed for rent nearby; rentals at typical pace (median 19d on market — plan ~3-4 weeks tenant-placement turnaround); 29,883 units permitted in Harris County in 2024 (8,621 in 5+ unit buildings).
- This rent runs 40% of the median local income ($57k/yr) — at the standard rent-burdened threshold; future hikes will face affordability resistance.
Forward outlook
- In year one you build about $8k of equity ($2k loan paydown + $6k appreciation (2.6% local appreciation)).
- Harris County population projected at +47% by 2050 — long-run rental-demand tailwind backs the buy-and-hold thesis.
- By year 5, paydown + projected appreciation supports a ~$34k cash-out refi (75% LTV) — recoverable capital for the next deal without selling this one.
Negotiation context
- It's been on market 31 days — a 3% lower offer ($231k) is reasonable based on typical stale-listing flexibility.
- 4 sale attempts since 8y ago with the ask held roughly flat each time — persistent listings suggest the price (not the market) is what's stuck; bring a comps-based counter.
Risks & watch-outs
- Climate carrying-cost: severe wind risk, 99% chance of damaging wind over 30y; extreme-heat days projected 7→25/yr by 2055 (HVAC capex compounding) — expect insurance premiums to compound above CPI over the hold.
Questions for the listing agent
- What do current leases actually rent for vs. the listed asking? Can we see a recent rent roll and the last 12 months of T-12 income?
- It's been on market 31 days. Have you received any prior offers? Is the seller open to a 21% concession, seller financing, or rate buy-down credit?
- Is there a deadline driving the sale (1031 exchange, divorce, estate, relocation)? That informs how much negotiation room exists.
- Schools are D-rated, which usually means shorter tenancies and higher turnover. Who's the typical renter profile here, and what's been the actual vacancy rate?
- Crime grade is F in this area — have there been break-ins, vandalism, or insurance claims at this property in the last 3 years? What carrier currently insures it and at what premium?
- The area grade is low — what's the realistic commute time and amenity access for the typical tenant pool here? Any planned neighborhood developments (good or bad) we should know about?
- What's the average days-on-market for RENTAL listings here right now (not sales)? A rising rental-DOM trend means longer vacancies and softer asking-rent achievability than the comps imply.
- What's the recent tenant-quality profile in this submarket — average credit score on applications, eviction rate, late-payment / NSF rate, and stable-employment percentage? A property-management company in the area should have these aggregated.
- How much new for-sale + rental construction is in the pipeline within 1–3 miles? Heavy new supply typically softens prices + rents 12–24 months out; constrained supply supports both.
Investment metrics
- 1% rule
- 0.79% ✗
- Cap rate
- 5.10%
- Cash-on-cash
- -4.26%
- DSCR
- 0.81
- GRM
- 10.5
CMA / ARV
- ARV (on-the-fly)
- $198,120
- Comps found
- 12
Show comp detail 12 sales within ~0.75 mi
| Address | Dist | Beds/Ba | Sqft | Sold | Price | $/sf | Match |
|---|---|---|---|---|---|---|---|
| 12106 Panay Dr | 0.08mi | 3/2.0 (-1) | 1,532 (+0%) | 1mo | $199,900 | $130 | 90 |
| 11926 Panay Dr | 0.13mi | 3/2.0 (-1) | 1,494 (-2%) | 2mo | $230,000 | $154 | 84 |
| 5315 Fairgreen Ln | 0.35mi | 4/2.0 | 1,576 (+3%) | 2mo | $199,990 | $127 | 77 |
| 11406 Glenhollow Dr | 0.54mi | 3/2.0 (-1) | 1,514 (-1%) | 2mo | $139,999 | $92 | 67 |
| 12302 Swae Lee | 0.69mi | 4/2.0 | 1,540 (+1%) | 1mo | $243,800 | $158 | 65 |
| 12702 Fawnway Dr | 0.30mi | 4/2.5 | 1,698 (+11%) | 2mo | $215,000 | $127 | 64 |
| 5102 Tavenor Ln | 0.37mi | 4/2.0 | 1,724 (+13%) | 2mo | $220,000 | $128 | 60 |
| 5227 Honeyvine Dr | 0.45mi | 3/2.0 (-1) | 1,407 (-8%) | 2mo | $199,000 | $141 | 59 |
| 12015 Rosecroft Dr | 0.73mi | 3/2.0 (-1) | 1,536 (+1%) | 1mo | $199,999 | $130 | 59 |
| 11407 Murr Way | 0.56mi | 3/1.5 (-1) | 1,592 (+4%) | 3mo | $143,000 | $90 | 57 |
| 4807 Tili And Gili St | 0.59mi | 3/2.5 (-1) | 1,423 (-7%) | 2mo | $249,990 | $176 | 53 |
| 4218 Richmeadow Dr | 0.64mi | 3/2.0 (-1) | 1,388 (-9%) | 0mo | $238,500 | $172 | 50 |
Match score weights: distance 35% · size 25% · config 20% · recency 20%. Top-matched comps best support the ARV.
Projected returns pro-forma
2.61% appreciation · 1.17% rent growth · sell at horizon
- IRR
- 1.5%
- Equity multiple
- 1.08×
- Total profit
- $5,426
- Equity at exit
- $101,722
- IRR
- 4.4%
- Equity multiple
- 1.64×
- Total profit
- $42,335
- Equity at exit
- $152,869
Cash invested: $66,556 (down + closing). Projections, not guarantees.
Landlord ↔ Tenant lean methodology
- Overall (STATE)
- 87 Strongly Landlord-Friendly
- State Texas
- 87 Strongly Landlord-Friendly · R+5
- County
- — inherits STATE
- City
- — inherits STATE
ZIP-level market 77048
- Home prices YoY
- 1.0%
- Rents YoY
- 1.2%
- Active inventory
- 303
- Price-to-rent
- 10.5×
Monthly cashflow live
- Estimated rent
- $1,884 high interval (Pro) →
- Mortgage (P&I)
- −$1,247
- Tax from tax record
- −$379 /mo · $4,550/yr
- Insurance
- −$99
- HOA
- −$0
- Vacancy / Maint / Mgmt
- −$396
- Net cashflow
- $-236
Break-even live
UW: 25.0% down · 7.5% · 30yr · 1.5% tax · 5.0% vac · 8.0% maint · 8.0% mgmt
Financing live
Cash to close
- Down payment
- $59,425
- Closing costs
- $7,131
- Reserves months
- —
- Total cash needed
- —
Loan-product check · same deal, 3 products live
Conventional
25% down · 7.5% · 30yr
- Down + closing
- —
- Monthly P&I
- —
- Monthly cashflow
- —
- DSCR
- —
- Eligible?
- —
Personal DTI + credit; lowest rate.
DSCR
20% down · 8.5% · 30yr
- Down + closing
- —
- Monthly P&I
- —
- Monthly cashflow
- —
- DSCR
- —
- Eligible?
- —
No personal income docs; deal must DSCR.
Hard money
10% down · 12.0% · 12mo
- Down + closing
- —
- Monthly P&I
- —
- Monthly cashflow
- —
- DSCR
- —
- Eligible?
- —
Short-term bridge; refi at stabilization.
Rent comps 21 comps
| Address | Beds | Baths | Sqft | Rent | $/sqft | DOM | Units | Dist |
|---|---|---|---|---|---|---|---|---|
| 12210 Roandale Dr Houston, TX | 3.0 | 2.0 | 1738 | $1,775 | $1.02 | 43d | 1 | 0.34mi |
| 12227 Cape Hyannis Dr Houston, TX | 3.0 | 2.0 | 1432 | $1,705 | $1.19 | 14d | 1 | 0.42mi |
| 5425 E Orem Dr Houston, TX | 1.0–4.0 | 1.0–2.0 | 1040 | $1,661 | $1.60 | 4d | 13 | 0.56mi |
| 12207 Duane Ct Houston, TX | 3.0 | 2.0 | 1548 | $1,691 | $1.09 | 7d | 1 | 0.57mi |
| 11319 Murr Way Houston, TX | 3.0 | 1.5 | 1213 | $1,699 | $1.40 | 18d | 1 | 0.63mi |
| 4510 Bungalow Ln Houston, TX | 3.0 | 2.5 | 2100 | $1,995 | $0.95 | 43d | 1 | 0.66mi |
| 5602 Selinsky Rd Unit 510 Houston, TX | 3.0 | 2.0 | 1167 | $1,313 | $1.13 | 11d | 1 | 0.80mi |
| 5602 Selinsky Rd Unit 3187 Houston, TX | 3.0 | 2.0 | 1167 | $1,281 | $1.10 | 3d | 1 | 0.80mi |
| 5602 Selinsky Rd Unit 3047 Houston, TX | 3.0 | 2.0 | 1167 | $1,324 | $1.13 | 11d | 1 | 0.80mi |
| 5426 Greylog Dr Houston, TX | 3.0 | 2.0 | 1205 | $1,750 | $1.45 | 24d | 1 | 0.91mi |
| 4015 Marchant Rd Houston, TX | 3.0 | 2.0 | 1200 | $1,700 | $1.42 | 43d | 1 | 0.96mi |
| 4814 Centipede Rd Unit B Houston, TX | 3.0 | 2.5 | 1701 | $1,950 | $1.15 | 22d | 1 | 0.99mi |
| 11819 Leitrim Way Houston, TX | 3.0 | 1.0 | 1476 | $1,150 | $0.78 | 5d | 1 | 1.00mi |
| 3918 Almeda-Genoa Rd Houston, TX | 1.0–3.0 | 1.0–2.0 | 1038 | $2,220 | $2.14 | 1d | 26 | 1.09mi |
| 13555 Cullen Blvd Houston, TX | 1.0–3.0 | 1.0–2.0 | 917 | $1,900 | $2.07 | 43d | 35 | 1.12mi |
| 13311 Lucky Bill Ln Houston, TX | 3.0 | 2.5 | 1597 | $2,250 | $1.41 | 43d | 1 | 1.14mi |
| 10902 Faircroft Dr Houston, TX | 3.0 | 1.0 | 1308 | $1,480 | $1.13 | 43d | 1 | 1.15mi |
| 5458 Osprey Dr Houston, TX | 3.0 | 2.0 | 1614 | $1,595 | $0.99 | 20d | 1 | 1.17mi |
| 13427 Lucky Bill Ln Houston, TX | 3.0 | 2.5 | 1443 | $2,095 | $1.45 | 7d | 1 | 1.26mi |
| 13442 Lucky Bill Ln Houston, TX | 3.0 | 2.0 | 1427 | $2,195 | $1.54 | 22d | 1 | 1.30mi |
| 5726 Waterford Dr Houston, TX | 3.0 | 2.0 | 2000 | $1,850 | $0.93 | 10d | 1 | 1.42mi |
Listing history 25 events
-
2026-06-18days on market $237,700 Active 31 DOM
-
2026-06-17price $237,700 Active 30 DOM
-
2026-06-17days on market $241,000 Active 30 DOM
-
2026-06-16days on market $241,000 Active 29 DOM
-
2026-06-15days on market $241,000 Active 28 DOM
-
2026-06-13days on market $241,000 Active 26 DOM
-
2026-06-10days on market $241,000 Active 22 DOM
-
2026-06-08days on market $241,000 Active 21 DOM
-
2026-06-07days on market $241,000 Active 20 DOM
-
2026-06-04pricedays on market $241,000 Active 17 DOM
-
2026-06-01days on market $245,000 Active 14 DOM
-
2026-05-31days on market $245,000 Active 13 DOM
-
2026-05-18$245,000 Active
-
2022-01-14price $1,515
-
2021-08-03soldstatus
-
2021-08-02soldstatus Sold 317-char remark
Show marketing remark (317 chars)
Spacious, newly renovated house on a quiet street. This 4 bedroom 2 bathroom house features large rooms, new floors/carpets, light fixtures and a 2 car garage! Large backyard perfect for entertaining friends and family. Come schedule your showing today, won’t last long! (all room measurements are approximates)
-
2021-07-24status Pending 317-char remark
Show marketing remark (317 chars)
Spacious, newly renovated house on a quiet street. This 4 bedroom 2 bathroom house features large rooms, new floors/carpets, light fixtures and a 2 car garage! Large backyard perfect for entertaining friends and family. Come schedule your showing today, won’t last long! (all room measurements are approximates)
-
2021-07-12status Option Pending 317-char remark
Show marketing remark (317 chars)
Spacious, newly renovated house on a quiet street. This 4 bedroom 2 bathroom house features large rooms, new floors/carpets, light fixtures and a 2 car garage! Large backyard perfect for entertaining friends and family. Come schedule your showing today, won’t last long! (all room measurements are approximates)
-
2021-07-12status Active 317-char remark
Show marketing remark (317 chars)
Spacious, newly renovated house on a quiet street. This 4 bedroom 2 bathroom house features large rooms, new floors/carpets, light fixtures and a 2 car garage! Large backyard perfect for entertaining friends and family. Come schedule your showing today, won’t last long! (all room measurements are approximates)
-
2021-07-04status Pending 317-char remark
Show marketing remark (317 chars)
Spacious, newly renovated house on a quiet street. This 4 bedroom 2 bathroom house features large rooms, new floors/carpets, light fixtures and a 2 car garage! Large backyard perfect for entertaining friends and family. Come schedule your showing today, won’t last long! (all room measurements are approximates)
-
2021-06-23status Option Pending 317-char remark
Show marketing remark (317 chars)
Spacious, newly renovated house on a quiet street. This 4 bedroom 2 bathroom house features large rooms, new floors/carpets, light fixtures and a 2 car garage! Large backyard perfect for entertaining friends and family. Come schedule your showing today, won’t last long! (all room measurements are approximates)
-
2021-06-17$209,000 Active 317-char remark
Show marketing remark (317 chars)
Spacious, newly renovated house on a quiet street. This 4 bedroom 2 bathroom house features large rooms, new floors/carpets, light fixtures and a 2 car garage! Large backyard perfect for entertaining friends and family. Come schedule your showing today, won’t last long! (all room measurements are approximates)
-
2021-04-28soldstatus
-
2018-08-31soldstatus Sold 35-char remark
Show marketing remark (35 chars)
Home will be ready for move in 9/1.
-
2018-08-20$1,500 Active 35-char remark
Show marketing remark (35 chars)
Home will be ready for move in 9/1.
ⓘ Source: listings_history table (triggers on properties + properties_extension) + one-shot
backfill from property_details.listing_events for pre-trigger history.
Tax reassessment forecast TX · Resets to sale price
- Current annual tax
- $4,550 · $379/mo
- Projected year-2 tax
- $4,550 · $379/mo
- Expected delta
- $0/yr ($0/mo · 0.0%)
ⓘ Screening estimate from a state-policy table — verify with the county assessor before closing.
Climate risk First Street
- Flood 1/10 Low FEMA zone X (unshaded) · 0% chance over 30 yrs
- Wildfire 1/10 Low
- Heat 9/10 Extreme 7 d/yr ≥108°F today · 25 d/yr by 30 yrs out
- Wind 9/10 Extreme 99% chance of damaging wind over 30 yrs
- Air quality 2/10 Low 1 unhealthy d/yr today · 2 by 30 yrs out
Nearby sold comps map
Loading sold comps map…
Walkable amenities ~0.75 mi
Loading nearby amenities…
Taxation est. · year 1
- Rental income
- $22,613
- − Mortgage interest
- −$13,315
- − Property taxes
- −$4,550
- − Insurance
- −$1,188
- − Repairs & maintenance
- −$1,809
- − Management
- −$1,809
- − Depreciation
- −$6,915
- Taxable loss
- −$6,973
- Est. tax savings @ 24.0%
- +$1,674
- After-tax cash flow
- $-1,159/yr
For passive investors: Depreciation is non-cash, so a rental often shows a tax loss while cash-flowing — sheltering income. Rental losses are passive: they offset passive income freely, and up to $25,000/yr can offset ordinary (W-2) income if you actively participate and your MAGI is under $100k (phasing out to $0 by $150k); unused losses carry forward. On sale, claimed depreciation is recaptured at up to 25%, and gains may owe capital-gains tax (a 1031 exchange can defer both). Figures are a year-1 estimate at your 24.0% rate — not tax advice; consult a CPA.
Schools (NCES district)
- District
- Houston ISD
- NCES district ID
- 4823640
- Math proficiency
- 27% ▼ -18.00%
- Reading proficiency
- 35% ▼ -6.00%
- Median HH income
- $46,054
- Composite
- 26.63/100
- National rank
- #7173
- State rank
- #593 of 826 in TX
Livability — Houston
- Score
- 74/100
- State rank
- #184
- US rank
- #4771
Category grades
Schools grade is shown separately in the Schools card above.
Census & demographics
- Census place
- Houston, TX
- County
- Harris County · 4,702,590 people
- City population
- 3,226,434
- Metro
- Houston-The Woodlands-Sugar Land, TX
- Population (ZIP)
- 21,151
- Household income
- $56,747
- Rent vs Own
- Severe rent burden
- 1117.0
Population outlook (Harris County) Hauer SSP2
- Today (2025)
- 5,571,493 people
- By 2030
- 6,089,821 · +9.3%
- By 2040
- 7,142,806 · +28.2%
- By 2050
- 8,185,864 · +46.9%
- By 2075
- 10,574,329 · +89.8%
- By 2100
- 12,109,958 · +117.4%
Race, ethnicity, and origin ACS 2023
- Neighborhood character
- Predominantly Black (69%)
- Race & ethnicity
- Black 69% Hispanic / Latino 24% Two or more races 6% Asian 3% White 2%
- Hispanic origin (detail)
- Mexican 17% Puerto Rican 1%
- Foreign-born
- 12% · Canada, Vietnam
- Languages at home
- 76% English-only · Spanish 20% Tagalog/Filipino 2% Vietnamese 1%
Political lean MEDSL · Harris
- 2024 margin
- Lean D (+5.5) · D 52.0% · R 46.4% · Other 1.6%
- 2008→2024 swing
- +3.9pp toward D · 2008: 1.6pp · 2024: 5.5pp
- All cycles
- 2024: D+5.5 2020: D+13.3 2016: D+12.4 2012: D+0.1 2008: D+1.6
Not yet ingested
- Civics
- —
Market trends
- HPI YoY
- ▲ 2.61%
- Current HPI
- 266.4468
- Rent YoY
- ▲ 1.17%
- Metro
- Houston-The Woodlands-Sugar Land, TX
- State GDP YoY
- ▲ 3.95%
- F500 in state
- 110
Industry mix (Fortune 500 HQ in TX)
| Industry | F500 HQs | Revenue |
|---|---|---|
| Energy | 16 | $1,198B |
|
||
| Technology | 5 | $198B |
|
||
| Engineering / Construction | 4 | $72B |
|
||
| Energy Services | 3 | $60B |
|
||
| Utilities | 3 | $41B |
|
||
| Healthcare | 2 | $330B |
|
||
Price history
+16233.3% since first listed13 events — show timeline
- 2026-05-18 Listed $245,000 HARMLS
- 2022-01-14 Price Changed $1,515 RENT.
- 2021-08-03 Sold (Public Records) — Public Records
- 2021-08-02 Sold (MLS) — HARMLS
- 2021-07-24 Pending — HARMLS
- 2021-07-12 Pending — HARMLS
- 2021-07-12 Relisted — HARMLS
- 2021-07-04 Pending — HARMLS
- 2021-06-23 Pending — HARMLS
- 2021-06-17 Listed $209,000 HARMLS
- 2021-04-28 Sold (Public Records) — Public Records
- 2018-08-31 Sold (MLS) — HARMLS
- 2018-08-20 Listed $1,500 HARMLS
Property tax history
+26.8%/yrLatest (2025): $4,550 · -6.7% YoY. Source: county tax records.
Cash-flow waterfall
monthlySold comps — $/sqft
last 12 mo · ≤1 miLoading sold comps…