 Multi-family
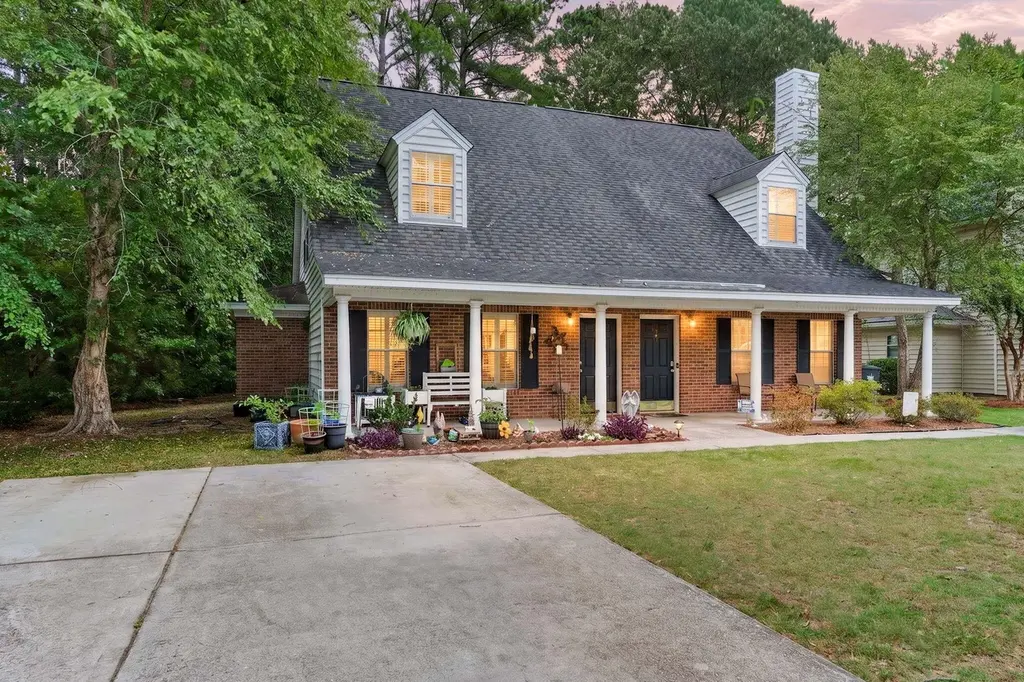
4803 Habersham Ln · North Charleston, SC
Flood risk 1/10 · Minimal
- FEMA flood zone
- X (unshaded)
- Chance of flooding over 30 yrs
- 0.0%
- Est. flood insurance / yr
- $507 – $1,088
Fire risk 1/10 · Minimal
- Est. fire insurance / yr
- $783 – $1,453
Heat risk 9/10 · Severe
- Hot days now (above 107°F)
- 7 days/yr
- Hot days in 30 yrs
- 17 days/yr
Wind risk 8/10 · Major
- Chance of severe wind over 30 yrs
- 98.0%
Air-quality risk 2/10 · Minimal
- Unhealthy air days now
- 2 days/yr
- Unhealthy air days in 30 yrs
- 2 days/yr
Risk factors via First Street. Map © Google.
Why this score? — see what drove the B grade
The composite is a weighted blend of 9 inputs, each scored 0–100. Each bar is that input's sub-score; the figure is the points it added to the 100-point composite (weight × sub-score).
- Cash flow +30.0/30.0
- DSCR +10.0/10.0
- 1% rule +9.7/10.0
- ARV discount +7.5/15.0
- Schools +4.1/10.0
- Rent growth +3.5/5.0
- Livability +3.3/5.0
- Condition / age +2.5/5.0
- Appreciation +0.0/10.0
$275,000
🖨 Deal sheet (PDF) 📄 Offer letter ✓ Due diligence
Multi-family units
County records classify this as Multi-Family (2-4 Unit). Listing-text estimate: 1 unit. estimate disagrees with records
Listing remarks MLS
** Tenant Occupied Unit to be Vacant End of May ** Great Location ** 3/ 2 Brick End Unit ** Extra Parking Pad ** Patio ** Private location yet conveniently located ** One Bedroom and Bath are Downstairs and Two Bedrooms and Bath are Upstairs ** Large Open Eat in Kitchen ** Selling As-Is at this price and won't last long, just needs paint and carpet before new buyer moves in **
Key facts
- Covered front porch
- Stainless appliances
- Concrete patio
Tags
Property features AI
Finance
- HOA & community: Association fee $400 annually; Lawn maintenance included; Community pool; Trash service included; Walk/jog trails
Exterior
- Utilities: Public sewer; Dominion Energy service; Dorchester County water and sewer
- Home design: Residential single-family attached; Two levels; Duplex
- Exterior features: Architectural roof; Wooded lot; Lot under 0.5 acre
Interior
- Kitchen: Dishwasher; Electric range
- Bedrooms: 3 bedrooms; Primary bedroom on the lower level with ceiling fan(s)
- Flooring: Carpet; Vinyl
- Bathrooms: 2 bathrooms
- Heating & cooling: Central air conditioning; Electric heating
- Interior features: Eat-in kitchen; Family room; One fireplace
Neighborhood map
What this means for you Summary
Snapshot
- This is a 3-bed/2.0-bath multifamily listed at $275k.
Deal economics
- At list price, monthly cash flow is $1k ($16k/yr) — positive.
- The deal already cash-flows at list — no discount required.
- Meets the 1% rule at list price ($4k rent vs $275k).
- Cap rate 12.3% vs local median 4.0% in North Charleston — top-decile yield for the area; either an underpriced asset or a hidden risk that comps aren't pricing in. Stress-test before assuming the spread holds.
Location & tenants
- Location reads 66/100 on livability (#122 in SC) — a middle-class / working-renter tenant base. Strengths: housing A+, health & safety A+, cost of living A; Watch: employment C-, crime F, amenities F.
- Dorchester 02 (suburban): math 40% / reading 55% proficiency, ranked #12 of 80 in SC (top 15%) — families likely to look elsewhere, expect single-tenant / working-renter base with shorter leases.
- Zoned schools: Fort Dorchester Elementary (math 48% / reading 57%, grade C-, #143 of 597 statewide, top 24%, 892 students, 52% FRL); Oakbrook Middle (math 25% / reading 39%, grade F, #119 of 229 statewide, top 54%, 1,006 students, 67% FRL); Fort Dorchester High (math 58% / reading 88%, grade B+, #44 of 196 statewide, top 23%, 2,312 students, 62% FRL) — zoned schools average 60% FRL vs 36% district-wide (24 pts higher); higher-poverty schools than district average — tighter screening recommended.
- Market conditions: Rents rising (+3.9%/yr); 691 active listings in the ZIP; 21 comparable units currently listed for rent nearby; rentals at typical pace (median 15d on market — plan ~3-4 weeks tenant-placement turnaround); solid renter incomes; 1,199 units permitted in Dorchester County in 2024 (0 in 5+ unit buildings).
- At $4,054/mo this rent would consume 59% of the median local household income ($83k/yr) (locally 1302% of renters already pay >50% of income on rent) — very limited rent-growth headroom before tenants either downsize or default.
Forward outlook
- Local home prices are declining (-3.0%/yr); year-one equity from $2k of loan paydown is wiped out by about $8k of value loss. Plan a longer hold.
- Dorchester County population projected at +43% by 2050 — long-run rental-demand tailwind backs the buy-and-hold thesis.
- At projected returns (-3.0% appreciation + 3.9% rent growth), your $77k cash investment doubles in ~6 years — after that, you're playing with house money.
Negotiation context
- Only 9 days on market — expect competitive offers; lowballing is unlikely to land.
- 5 sale attempts since 22y ago with the ask held roughly flat each time — persistent listings suggest the price (not the market) is what's stuck; bring a comps-based counter.
Risks & watch-outs
- Climate carrying-cost: severe wind risk, 98% chance of damaging wind over 30y; extreme-heat days projected 7→17/yr by 2055 (HVAC capex compounding) — expect insurance premiums to compound above CPI over the hold.
Questions for the listing agent
- What does the HOA fee cover, when was the last increase, and are there any pending special assessments or reserve-fund shortfalls?
- Is there a deadline driving the sale (1031 exchange, divorce, estate, relocation)? That informs how much negotiation room exists.
- Crime grade is F in this area — have there been break-ins, vandalism, or insurance claims at this property in the last 3 years? What carrier currently insures it and at what premium?
- What's the average days-on-market for RENTAL listings here right now (not sales)? A rising rental-DOM trend means longer vacancies and softer asking-rent achievability than the comps imply.
- What's the recent tenant-quality profile in this submarket — average credit score on applications, eviction rate, late-payment / NSF rate, and stable-employment percentage? A property-management company in the area should have these aggregated.
- How much new apartment / multifamily construction is in the pipeline within 1–3 miles? Heavy new supply (>2% of stock underway) typically softens rents 12–24 months out; light construction supports rent growth.
Investment metrics
- 1% rule
- 1.47% ✓
- Cap rate
- 12.25%
- Cash-on-cash
- 21.28%
- DSCR
- 1.95
- GRM
- 5.7
CMA / ARV
No comps found within radius.
Projected returns pro-forma
-3.0% appreciation · 3.93% rent growth · sell at horizon
- IRR
- 14.8%
- Equity multiple
- 1.60×
- Total profit
- $46,263
- Equity at exit
- $41,003
- IRR
- 24.2%
- Equity multiple
- 3.19×
- Total profit
- $168,378
- Equity at exit
- $23,777
Cash invested: $77,000 (down + closing). Projections, not guarantees.
Landlord ↔ Tenant lean methodology
- Overall (STATE)
- 90 Strongly Landlord-Friendly
- State South Carolina
- 90 Strongly Landlord-Friendly · R+6
- County
- — inherits STATE
- City
- — inherits STATE
ZIP-level market 29485
- Rents YoY
- 3.9%
- Active inventory
- 691
- Price-to-rent
- 18.4×
Monthly cashflow live
- Estimated rent
- $4,054 medium interval (Pro) →
- Mortgage (P&I)
- −$1,442
- Tax from tax record
- −$203 /mo · $2,441/yr
- Insurance
- −$115
- HOA
- −$77
- Vacancy / Maint / Mgmt
- −$851
- Net cashflow
- $1,366
Break-even live
Sensitivity live
| Price | -10% $1,521 | -5% $1,443 | +0% $1,366 | +5% $1,288 | +10% $1,210 |
|---|---|---|---|---|---|
| Rent | -10% $1,045 | -5% $1,205 | +0% $1,366 | +5% $1,526 | +10% $1,686 |
| Rate | -1.0pp $1,504 | -0.5pp $1,436 | base $1,366 | +0.5pp $1,294 | +1.0pp $1,222 |
3-unit breakdown (identical units grouped — click to expand)
| Units | Beds | Baths | Est. rent |
|---|---|---|---|
| 1× unit | 1 | 1 | $1,243 |
| 2× units | 2 | 1 | $2,812 |
| #2 | 2 | 1 | $1,406 |
| #3 | 2 | 1 | $1,406 |
| Total (3 units) | $4,054 | ||
UW: 25.0% down · 7.5% · 30yr · 1.5% tax · 5.0% vac · 8.0% maint · 8.0% mgmt
Financing live
Cash to close
- Down payment
- $68,750
- Closing costs
- $8,250
- Reserves months
- —
- Total cash needed
- —
Loan-product check · same deal, 3 products live
Conventional
25% down · 7.5% · 30yr
- Down + closing
- —
- Monthly P&I
- —
- Monthly cashflow
- —
- DSCR
- —
- Eligible?
- —
Personal DTI + credit; lowest rate.
DSCR
20% down · 8.5% · 30yr
- Down + closing
- —
- Monthly P&I
- —
- Monthly cashflow
- —
- DSCR
- —
- Eligible?
- —
No personal income docs; deal must DSCR.
Hard money
10% down · 12.0% · 12mo
- Down + closing
- —
- Monthly P&I
- —
- Monthly cashflow
- —
- DSCR
- —
- Eligible?
- —
Short-term bridge; refi at stabilization.
Rent comps 21 comps
| Address | Beds | Baths | Sqft | Rent | $/sqft | DOM | Units | Dist |
|---|---|---|---|---|---|---|---|---|
| 4834 Habersham Ln Summerville, SC | 3.0 | 2.0 | 1319 | $1,900 | $1.44 | 24d | 1 | 0.10mi |
| 4841 Habersham Ln Summerville, SC | 3.0 | 2.0 | 1319 | $1,965 | $1.49 | 15d | 1 | 0.11mi |
| 4830 Wescott Blvd Summerville, SC | 2.0 | 2.0 | 1052 | $1,695 | $1.61 | 11d | 1 | 0.15mi |
| 4976 Wescott Blvd Summerville, SC | 1.0–3.0 | 1.0–2.0 | 1055 | $1,990 | $1.89 | 3d | 19 | 0.23mi |
| 4946 Ballantine Dr Summerville, SC | 3.0 | 2.5 | 1476 | $2,100 | $1.42 | 24d | 1 | 0.44mi |
| 9162 Maple Grove Dr Unit 1 Summerville, SC | 4.0 | 2.5 | 1708 | $2,325 | $1.36 | 24d | 1 | 0.63mi |
| 9162 Maple Grove Dr Summerville, SC | 4.0 | 3.0 | 1708 | $2,325 | $1.36 | 19d | 1 | 0.63mi |
| 4821 Oak Leaf Rd Summerville, SC | 4.0 | 2.0 | 1752 | $2,199 | $1.26 | 15d | 1 | 0.63mi |
| 9691 Patriot Blvd Ladson, SC | 3.0 | 1.0–2.5 | 1033 | $2,552 | $2.47 | 3d | 26 | 0.68mi |
| 9648 Brandishing Rd Ladson, SC | 3.0 | 2.0 | 1343 | $2,350 | $1.75 | 15d | 1 | 0.90mi |
| 9570 Eagle Pass Dr Summerville, SC | 2.0–3.0 | 2.5 | 1502 | $2,153 | $1.43 | 11d | 9 | 1.01mi |
| 8968 Cat Tail Pond Rd Summerville, SC | 3.0 | 2.5 | 1677 | $2,450 | $1.46 | 15d | 1 | 1.01mi |
| 9580 Old Glory Ln Summerville, SC | 2.0–3.0 | 1.0–2.0 | 1280 | $1,800 | $1.41 | 3d | 9 | 1.06mi |
| 8988 Cat Tail Pond Rd Summerville, SC | 3.0 | 2.5 | 1790 | $2,300 | $1.28 | 24d | 1 | 1.06mi |
| 8850 Dorchester Rd North Charleston, SC | 1.0–3.0 | 1.0–2.0 | 1287 | $2,143 | $1.67 | 11d | 15 | 1.27mi |
| 8800 Dorchester Rd North Charleston, SC | 3.0 | 2.0–2.5 | 1735 | $2,474 | $1.43 | 24d | 2 | 1.37mi |
| 8800 Dorchester Rd #603 North Charleston, SC | 3.0 | 2.0 | 1644 | $2,700 | $1.64 | 12d | 1 | 1.38mi |
| 614 Knowledge Dr Ladson, SC | 3.0 | 2.5 | 1860 | $2,550 | $1.37 | 12d | 1 | 1.41mi |
| 9155 Parlor Dr Ladson, SC | 3.0 | 2.5 | 1473 | $1,950 | $1.32 | 15d | 1 | 1.45mi |
| 9155 Parlor Dr Ladson, SC | 3.0 | 2.5 | 1473 | $1,950 | $1.32 | 21d | 1 | 1.45mi |
| 8010 Triggerfish Way North Charleston, SC | 3.0 | 2.5 | 1805 | $2,250 | $1.25 | 12d | 1 | 1.47mi |
HOA detail
- Monthly dues
- $77 · $924/yr
Listing history 7 events
-
2026-06-10days on market $275,000 Active 9 DOM
-
2026-06-09days on market $275,000 Active 8 DOM
-
2026-06-08days on market $275,000 Active 7 DOM
-
2026-06-07days on market $275,000 Active 6 DOM
-
2026-06-03days on market $275,000 Active 2 DOM
-
2026-06-02remarks 699-char remark
-
2026-06-02$275,000 Active 1 DOM
ⓘ Source: listings_history table (triggers on properties + properties_extension) + one-shot
backfill from property_details.listing_events for pre-trigger history.
Tax reassessment forecast SC · Resets to sale price
- Current annual tax
- $2,441 · $203/mo
- Projected year-2 tax
- $2,441 · $203/mo
- Expected delta
- $0/yr ($0/mo · 0.0%)
ⓘ Screening estimate from a state-policy table — verify with the county assessor before closing.
Climate risk First Street
- Flood 1/10 Low FEMA zone X (unshaded) · 0% chance over 30 yrs
- Wildfire 1/10 Low
- Heat 9/10 Extreme 7 d/yr ≥107°F today · 17 d/yr by 30 yrs out
- Wind 8/10 Severe 98% chance of damaging wind over 30 yrs
- Air quality 2/10 Low 2 unhealthy d/yr today · 2 by 30 yrs out
Nearby sold comps map
Loading sold comps map…
Walkable amenities ~0.75 mi
Loading nearby amenities…
Taxation est. · year 1
- Rental income
- $48,648
- − Mortgage interest
- −$15,404
- − Property taxes
- −$2,441
- − Insurance
- −$1,375
- − Repairs & maintenance
- −$3,892
- − Management
- −$3,892
- − HOA
- −$924
- − Depreciation
- −$8,000
- Taxable income
- $12,721
- Est. tax owed @ 24.0%
- −$3,053
- After-tax cash flow
- $13,334/yr
For passive investors: Depreciation is non-cash, so a rental often shows a tax loss while cash-flowing — sheltering income. Rental losses are passive: they offset passive income freely, and up to $25,000/yr can offset ordinary (W-2) income if you actively participate and your MAGI is under $100k (phasing out to $0 by $150k); unused losses carry forward. On sale, claimed depreciation is recaptured at up to 25%, and gains may owe capital-gains tax (a 1031 exchange can defer both). Figures are a year-1 estimate at your 24.0% rate — not tax advice; consult a CPA.
Schools (NCES district)
- District
- Dorchester 02
- NCES district ID
- 4502010
- Math proficiency
- 40% ▼ -13.00%
- Reading proficiency
- 55% ▼ -4.00%
- Median HH income
- $57,937
- Composite
- 41.41/100
- National rank
- #3475
- State rank
- #12 of 80 in SC
Livability — North Charleston
- Score
- 66/100
- State rank
- #122
- US rank
- #12222
Category grades
Schools grade is shown separately in the Schools card above.
Census & demographics
- Census place
- North Charleston, SC
- County
- Dorchester County · 182,866 people
- City population
- 108,266
- Metro
- Charleston-North Charleston, SC
- Population (ZIP)
- 58,507
- Household income
- $82,987
- Rent vs Own
- Severe rent burden
- 1302.0
Population outlook (Dorchester County) Hauer SSP2
- Today (2025)
- 186,982 people
- By 2030
- 203,967 · +9.1%
- By 2040
- 237,160 · +26.8%
- By 2050
- 267,479 · +43.1%
- By 2075
- 333,025 · +78.1%
- By 2100
- 366,560 · +96.0%
Race, ethnicity, and origin ACS 2023
- Neighborhood character
- Diverse neighborhood (Simpson 0.57)
- Race & ethnicity
- White 61% Black 23% Hispanic / Latino 7% Two or more races 7% Asian 3% Pacific Islander 2%
- Hispanic origin (detail)
- Mexican 4% Puerto Rican 1%
- Common ancestry
- Slovak 3% Italian 2% Lithuanian 2%
- Foreign-born
- 7% · Canada, China, Vietnam
- Languages at home
- 92% English-only · Spanish 4% Chinese 1% Russian/Polish/Slavic 1%
Political lean MEDSL · Dorchester
- 2024 margin
- R (+14.6) · D 41.8% · R 56.4% · Other 1.9%
- 2008→2024 swing
- +0.9pp no change · 2008: -15.5pp · 2024: -14.6pp
- All cycles
- 2024: R+14.6 2020: R+10.5 2016: R+17.5 2012: R+16.0 2008: R+15.5
Not yet ingested
- Civics
- —
Market trends
- HPI YoY
- ▼ -305.43%
- Current HPI
- 210.8607
- Rent YoY
- ▲ 3.93%
- Metro
- Charleston-North Charleston, SC
- State GDP YoY
- ▲ 4.51%
- F500 in state
- 2
Industry mix (Fortune 500 HQ in SC)
| Industry | F500 HQs | Revenue |
|---|---|---|
| Packaging | 1 | $7B |
|
||
Price history
+103.7% since first listed13 events — show timeline
- 2026-06-01 Listed $275,000 Charleston Trident MLS
- 2022-06-21 Sold (Public Records) $245,000 Public Records
- 2022-06-17 Sold (MLS) $245,000 Charleston Trident MLS
- 2022-05-15 Contingent — Charleston Trident MLS
- 2022-05-05 Price Changed $245,000 Charleston Trident MLS
- 2022-04-28 Relisted — Charleston Trident MLS
- 2022-04-18 Price Changed $250,000 Charleston Trident MLS
- 2022-04-18 Contingent — Charleston Trident MLS
- 2022-04-14 Relisted — Charleston Trident MLS
- 2022-03-29 Pending — Charleston Trident MLS
- 2022-03-26 Listed $245,000 Charleston Trident MLS
- 2005-08-31 Sold (MLS) $133,000 Charleston Trident MLS
- 2004-10-01 Listed $135,000 Charleston Trident MLS
Property tax history
-1.6%/yrLatest (2025): $2,441 · -1.4% YoY. Source: county tax records.
Cash-flow waterfall
monthlySold comps — $/sqft
last 12 mo · ≤1 miLoading sold comps…