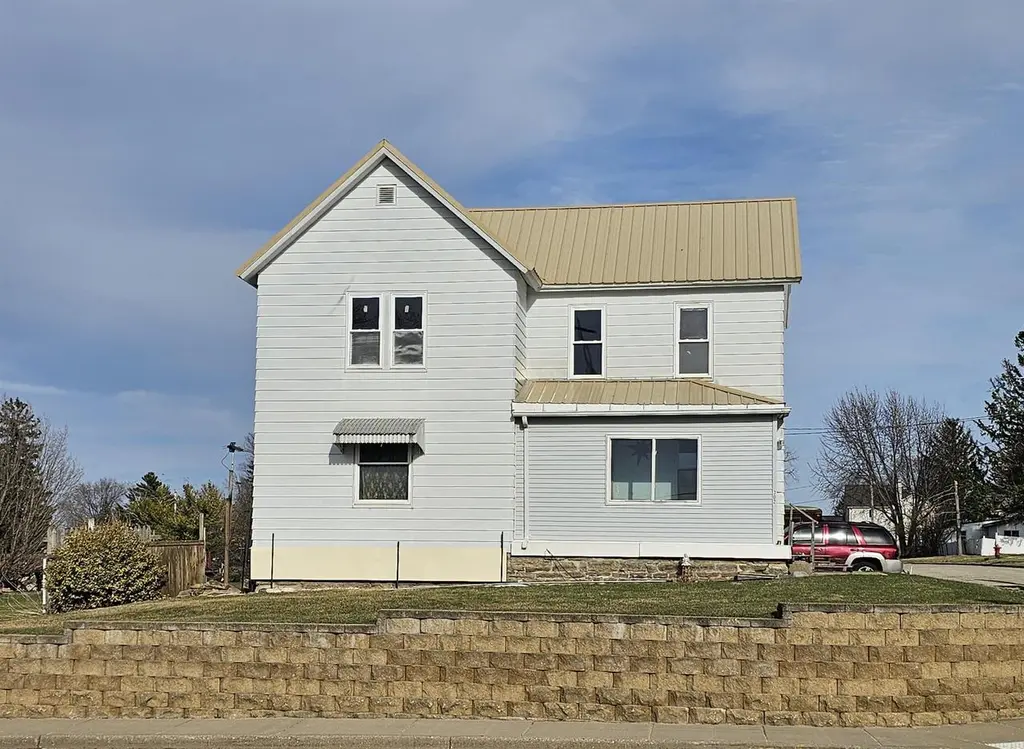
302 Main St · Highland, WI
Flood risk 1/10 · Minimal
- FEMA flood zone
- X (unshaded)
- Chance of flooding over 30 yrs
- 0.0%
- Est. flood insurance / yr
- $473 – $860
Fire risk 3/10 · Minor
- Est. fire insurance / yr
- $636 – $1,182
Heat risk 2/10 · Minimal
- Hot days now (above 98°F)
- 7 days/yr
- Hot days in 30 yrs
- 14 days/yr
Wind risk 2/10 · Minimal
- Chance of severe wind over 30 yrs
- —
Air-quality risk 2/10 · Minimal
- Unhealthy air days now
- 0 days/yr
- Unhealthy air days in 30 yrs
- 1 days/yr
Risk factors via First Street. Map © Google.
Why this score? — see what drove the C grade
The composite is a weighted blend of 9 inputs, each scored 0–100. Each bar is that input's sub-score; the figure is the points it added to the 100-point composite (weight × sub-score).
- ARV discount +15.0/15.0
- Cash flow +14.5/30.0
- Appreciation +8.4/10.0
- DSCR +4.4/10.0
- 1% rule +3.8/10.0
- Livability +3.5/5.0
- Schools +3.1/10.0
- Rent growth +2.5/5.0
- Condition / age +2.5/5.0
$130,000
🖨 Deal sheet 📄 Offer letter ✓ Due diligence
Key facts
- 8,712 sq ft lot
- 2 garage spots
- Listed 75 days
Property features AI
Finance
- Other: Inclusions: stove/oven, refrigerator, microwave, freezer, washer and dryer; Exclusions: personal property
Exterior
- Parking: Detached 2-car garage; 2 garage parking spaces
- Utilities: Municipal water; Municipal sewer
- Home design: Two-story single-family home; Estimated living area 1,501–1,750 sq. ft.; Finished above grade approximately 1,612 sq. ft.
- Construction: Construction materials: vinyl, aluminum/steel, wood; Year built: other (see remarks)
- Exterior features: Vinyl siding; Aluminum/steel siding; Wood elements; Lot approximately 0.2 acres; Zoned residential
Interior
- Kitchen: Range/oven; Refrigerator; Microwave; Freezer; Breakfast bar
- Bedrooms: Master bedroom (Main) — 12 x 12; Bedroom 2 (Upper) — 8 x 12; Bedroom 3 (Upper) — 12 x 12; Bedroom 4 (Upper) — 15 x 13
- Bathrooms: At least one tub; No master bedroom bath; 1 full bath
- Heating & cooling: Forced air heating; Central air conditioning; Natural gas heating fuel
- Interior features: Walk-in closet(s); High-speed internet
- Laundry & utility: Washer; Dryer; Partial basement with outside entry
Neighborhood map
What this means for you Summary
Snapshot
- This is a 4-bed/1.0-bath single-family listed at $130k.
Deal economics
- At list price, monthly cash flow is $29 ($347/yr) — positive.
- The deal already cash-flows at list — no discount required.
- To meet the 1% rule (rent ≥ 1% of price), the offer needs to be $115k (11.5% below list).
- Recommended offer: $115k (11.5% below list) — sets the bar for 1% rule.
Location & tenants
- Location reads 70/100 on livability (#284 in WI) — a middle-class / working-renter tenant base. Strengths: cost of living A+, housing A+, health & safety A+; Watch: amenities F, commute F.
- Highland School District (rural): math 45% / reading 20% proficiency, ranked #353 of 426 in WI (top 83%) — families likely to look elsewhere, expect single-tenant / working-renter base with shorter leases; only 19% free/reduced lunch — higher-income household profile.
- Zoned schools: Highland Community Elementary (math 24% / reading 24%, grade F, #783 of 1,041 statewide, top 79%, 132 students, 34% FRL); Highland Community High (math 50% / reading 50%, grade D, #36 of 483 statewide, top 9%, 105 students, 25% FRL).
- Market conditions: 10 active listings in the ZIP; 1 comparable units currently listed for rent nearby; 72 units permitted in Iowa County in 2024 (0 in 5+ unit buildings).
Forward outlook
- In year one you build about $10k of equity ($899 loan paydown + $9k appreciation (6.9% local appreciation)).
- Iowa County population projected at -14% by 2050 — secular population decline; favor cash flow + early exit over multi-decade hold.
- At projected returns (6.9% appreciation + 3.0% rent growth), your $36k cash investment doubles in ~4 years — after that, you're playing with house money.
- By year 4, paydown + projected appreciation supports a ~$34k cash-out refi (75% LTV) — recoverable capital for the next deal without selling this one.
Negotiation context
- It's been on market 75 days — a 6% lower offer ($122k) is reasonable based on typical stale-listing flexibility.
- Current owner paid $29k; list at $130k implies a 350% gain — meaningful room to come down on a strong offer.
Questions for the listing agent
- It's been on market 75 days. Have you received any prior offers? Is the seller open to a 12% concession, seller financing, or rate buy-down credit?
- Why hasn't it sold? Are there any deal-killer items the seller is aware of (foundation, flood, title, zoning, code violations)?
- Is there a deadline driving the sale (1031 exchange, divorce, estate, relocation)? That informs how much negotiation room exists.
- Schools are D-rated, which usually means shorter tenancies and higher turnover. Who's the typical renter profile here, and what's been the actual vacancy rate?
- What's the average days-on-market for RENTAL listings here right now (not sales)? A rising rental-DOM trend means longer vacancies and softer asking-rent achievability than the comps imply.
- What's the recent tenant-quality profile in this submarket — average credit score on applications, eviction rate, late-payment / NSF rate, and stable-employment percentage? A property-management company in the area should have these aggregated.
- How much new for-sale + rental construction is in the pipeline within 1–3 miles? Heavy new supply typically softens prices + rents 12–24 months out; constrained supply supports both.
Investment metrics
- 1% rule
- 0.88% ✗
- Cap rate
- 6.56%
- Cash-on-cash
- 0.95%
- DSCR
- 1.04
- GRM
- 9.4
CMA / ARV
- ARV (on-the-fly)
- $164,424
- Comps found
- 7
Show comp detail 7 sales within ~0.75 mi
| Address | Dist | Beds/Ba | Sqft | Sold | Price | $/sf | Match |
|---|---|---|---|---|---|---|---|
| 904 Dodgeville St | 0.31mi | 3/2.0 (-1) | 1,665 (+3%) | 4mo | $170,000 | $102 | 68 |
| 342 Grand St | 0.19mi | 4/1.5 | 1,500 (-7%) | 12mo | $262,600 | $175 | 68 |
| 604 Isabell St | 0.29mi | 4/1.5 | 1,504 (-7%) | 11mo | $147,000 | $98 | 64 |
| 744 Main St | 0.37mi | 3/2.0 (-1) | 1,568 (-3%) | 11mo | $260,000 | $166 | 60 |
| 409 Spring St | 0.24mi | 3/2.0 (-1) | 1,400 (-13%) | 3mo | $135,000 | $96 | 55 |
| 1231 Dodgeville St | 0.38mi | 4/1.5 | 1,760 (+9%) | 13mo | $145,000 | $82 | 54 |
| 1370 Dodgeville St | 0.58mi | 3/1.5 (-1) | 1,500 (-7%) | 10mo | $250,000 | $167 | 46 |
Match score weights: distance 35% · size 25% · config 20% · recency 20%. Top-matched comps best support the ARV.
Projected returns pro-forma
6.86% appreciation · 3.0% rent growth · sell at horizon
- IRR
- 18.1%
- Equity multiple
- 2.27×
- Total profit
- $46,108
- Equity at exit
- $88,878
- IRR
- 17.4%
- Equity multiple
- 4.65×
- Total profit
- $132,776
- Equity at exit
- $167,745
Cash invested: $36,400 (down + closing). Projections, not guarantees.
Landlord ↔ Tenant lean methodology
- Overall (STATE)
- 73 Landlord-Friendly
- State Wisconsin
- 73 Landlord-Friendly · R+2
- County
- — inherits STATE
- City
- — inherits STATE
ZIP-level market 53543
- Home prices YoY
- 3.0%
- Active inventory
- 10
- Price-to-rent
- 9.4×
Monthly cashflow live
- Estimated rent
- $1,150 medium interval (Pro) →
- Mortgage (P&I)
- −$682
- Tax from tax record
- −$144 /mo · $1,724/yr
- Insurance
- −$54
- HOA
- −$0
- Vacancy / Maint / Mgmt
- −$242
- Net cashflow
- $29
Break-even live
UW: 25.0% down · 7.5% · 30yr · 1.5% tax · 5.0% vac · 8.0% maint · 8.0% mgmt
Financing live
Cash to close
- Down payment
- $32,500
- Closing costs
- $3,900
- Reserves months
- —
- Total cash needed
- —
Loan-product check · same deal, 3 products live
Conventional
25% down · 7.5% · 30yr
- Down + closing
- —
- Monthly P&I
- —
- Monthly cashflow
- —
- DSCR
- —
- Eligible?
- —
Personal DTI + credit; lowest rate.
DSCR
20% down · 8.5% · 30yr
- Down + closing
- —
- Monthly P&I
- —
- Monthly cashflow
- —
- DSCR
- —
- Eligible?
- —
No personal income docs; deal must DSCR.
Hard money
10% down · 12.0% · 12mo
- Down + closing
- —
- Monthly P&I
- —
- Monthly cashflow
- —
- DSCR
- —
- Eligible?
- —
Short-term bridge; refi at stabilization.
Rent comps 1 comps
| Address | Beds | Baths | Sqft | Rent | $/sqft | DOM | Units | Dist |
|---|---|---|---|---|---|---|---|---|
| 301 Spring St Highland, WI | 3.0 | 1.0 | 1100 | $1,150 | $1.05 | 44d | 1 | 0.28mi |
Listing history 19 events
-
2026-06-18days on market $130,000 Active 75 DOM
-
2026-06-17days on market $130,000 Active 74 DOM
-
2026-06-16days on market $130,000 Active 73 DOM
-
2026-06-15days on market $130,000 Active 72 DOM
-
2026-06-15days on market $130,000 Active 71 DOM
-
2026-06-13days on market $130,000 Active 70 DOM
-
2026-06-12days on market $130,000 Active 69 DOM
-
2026-06-09days on market $130,000 Active 66 DOM
-
2026-06-08days on market $130,000 Active 65 DOM
-
2026-06-08days on market $130,000 Active 64 DOM
-
2026-06-05days on market $130,000 Active 62 DOM
-
2026-06-03pricedays on market $130,000 Active 60 DOM
-
2026-06-02days on market $140,000 Active 59 DOM
-
2026-06-01days on market $140,000 Active 58 DOM
-
2026-05-31days on market $140,000 Active 57 DOM
-
2026-05-13price $140,000
-
2026-04-02$150,000 Active
-
2017-12-13soldstatus $28,900
-
2005-10-07soldstatus $64,000
ⓘ Source: listings_history table (triggers on properties + properties_extension) + one-shot
backfill from property_details.listing_events for pre-trigger history.
Tax reassessment forecast WI · Partial reset (capped growth)
- Current annual tax
- $1,724 · $144/mo
- Projected year-2 tax
- $2,065 · $172/mo
- Expected delta
- +$340/yr (+$28/mo · 19.7%)
ⓘ Screening estimate from a state-policy table — verify with the county assessor before closing.
Climate risk First Street
- Flood 1/10 Low FEMA zone X (unshaded) · 0% chance over 30 yrs
- Wildfire 3/10 Moderate
- Heat 2/10 Low 7 d/yr ≥98°F today · 14 d/yr by 30 yrs out
- Wind 2/10 Low
- Air quality 2/10 Low 0 unhealthy d/yr today · 1 by 30 yrs out
Nearby sold comps map
Loading sold comps map…
Walkable amenities ~0.75 mi
Loading nearby amenities…
Taxation est. · year 1
- Rental income
- $13,800
- − Mortgage interest
- −$7,282
- − Property taxes
- −$1,724
- − Insurance
- −$650
- − Repairs & maintenance
- −$1,104
- − Management
- −$1,104
- − Depreciation
- −$3,782
- Taxable loss
- −$1,846
- Est. tax savings @ 24.0%
- +$443
- After-tax cash flow
- $790/yr
For passive investors: Depreciation is non-cash, so a rental often shows a tax loss while cash-flowing — sheltering income. Rental losses are passive: they offset passive income freely, and up to $25,000/yr can offset ordinary (W-2) income if you actively participate and your MAGI is under $100k (phasing out to $0 by $150k); unused losses carry forward. On sale, claimed depreciation is recaptured at up to 25%, and gains may owe capital-gains tax (a 1031 exchange can defer both). Figures are a year-1 estimate at your 24.0% rate — not tax advice; consult a CPA.
Schools (NCES district)
- District
- Highland School District
- NCES district ID
- 5506420
- Math proficiency
- 45% ▬ 0.00%
- Reading proficiency
- 20% ▼ -10.00%
- Median HH income
- $50,930
- Composite
- 31.15/100
- National rank
- #11282
- State rank
- #353 of 426 in WI
Livability — Highland
- Score
- 70/100
- State rank
- #284
- US rank
- #7416
Category grades
Schools grade is shown separately in the Schools card above.
Census & demographics
- Census place
- Highland, WI
- Population (ZIP)
- 1,787
Population outlook (Iowa County) Hauer SSP2
- Today (2025)
- 23,848 people
- By 2030
- 23,562 · -1.2%
- By 2040
- 22,348 · -6.3%
- By 2050
- 20,438 · -14.3%
- By 2075
- 16,112 · -32.4%
- By 2100
- 11,146 · -53.3%
Race, ethnicity, and origin ACS 2023
- Neighborhood character
- Predominantly White (95%)
- Race & ethnicity
- White 95% Hispanic / Latino 2% Black 2%
- Common ancestry
- Portuguese 7% Lithuanian 3% Iranian 1%
- Foreign-born
- 1% · Canada
- Languages at home
- 99% English-only · Spanish 1%
Political lean MEDSL · Iowa
- 2024 margin
- Lean D (+7.6) · D 52.9% · R 45.3% · Other 1.8%
- 2008→2024 swing
- -27.1pp toward R · 2008: 34.7pp · 2024: 7.6pp
- All cycles
- 2024: D+7.6 2020: D+13.7 2016: D+15.3 2012: D+30.3 2008: D+34.7
Not yet ingested
- Civics
- —
Market trends
- HPI YoY
- ▲ 6.86%
- Current HPI
- 239.019
- Rent YoY
- —
- Metro
- —
- State GDP YoY
- ▲ 2.10%
- F500 in state
- 20
Industry mix (Fortune 500 HQ in WI)
| Industry | F500 HQs | Revenue |
|---|---|---|
| Industrial Machinery | 4 | $23B |
|
||
| Industrial Technology | 2 | $36B |
|
||
| Insurance | 1 | $36B |
|
||
| Professional Services | 1 | $19B |
|
||
| Utilities | 1 | $9B |
|
||
| Consumer Goods | 1 | $3B |
|
||
Price history
+118.8% since first listed4 events — show timeline
- 2026-05-13 Price Changed $140,000 SCWMLS
- 2026-04-02 Listed $150,000 SCWMLS
- 2017-12-13 Sold (Public Records) $28,900 Public Records
- 2005-10-07 Sold (Public Records) $64,000 Public Records
Property tax history
+3.8%/yrLatest (2025): $1,724 · +10.0% YoY. Source: county tax records.
Cash-flow waterfall
monthlySold comps — $/sqft
last 12 mo · ≤1 miLoading sold comps…