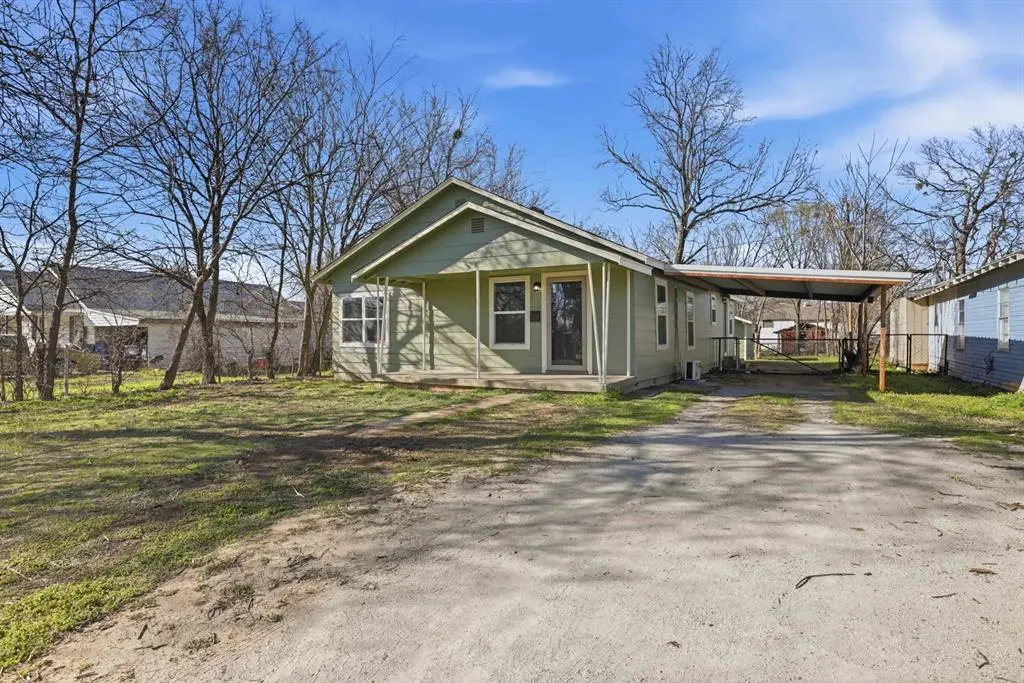
534 W Walnut Ave · Seminole, OK
Flood risk 1/10 · Minimal
- FEMA flood zone
- X (unshaded)
- Chance of flooding over 30 yrs
- 0.0%
- Est. flood insurance / yr
- $507 – $1,088
Fire risk 9/10 · Severe
- Est. fire insurance / yr
- $2,463 – $4,575
Heat risk 6/10 · Moderate
- Hot days now (above 112°F)
- 7 days/yr
- Hot days in 30 yrs
- 19 days/yr
Wind risk 3/10 · Minor
- Chance of severe wind over 30 yrs
- 7.0%
Air-quality risk 2/10 · Minimal
- Unhealthy air days now
- 1 days/yr
- Unhealthy air days in 30 yrs
- 1 days/yr
Risk factors via First Street. Map © Google.
Why this score? — see what drove the C+ grade
The composite is a weighted blend of 9 inputs, each scored 0–100. Each bar is that input's sub-score; the figure is the points it added to the 100-point composite (weight × sub-score).
- Cash flow +23.0/30.0
- Appreciation +10.0/10.0
- ARV discount +9.3/15.0
- DSCR +7.4/10.0
- 1% rule +4.6/10.0
- Livability +3.2/5.0
- Rent growth +2.5/5.0
- Condition / age +2.5/5.0
- Schools +1.6/10.0
$120,000
🖨 Deal sheet (PDF) 📄 Offer letter ✓ Due diligence
Listing remarks
Completely updated and move-in ready, this charming Seminole home offers the perfect blend of modern finishes and everyday functionality. Step inside to an open and inviting living space featuring durable wood-look flooring, fresh neutral tones, and abundant natural light throughout. The beautifully remodeled kitchen is a standout with updated cabinetry, sleek countertops, stainless steel appliances, and ample storage—ideal for both daily living and entertaining. The home features a well-designed layout with multiple bedrooms and updated bathrooms, including a stylish walk-in shower with contemporary finishes. Recent updates include interior finishes, fixtures, and mechanical improvem
Key facts
- Mini-split systems
- Walk-in shower
- Updated cabinetry
Tags
Property features AI
Finance
- Other: Property located in Vernon Heights addition
- Financial info: Loan qualifying allowed; Not assumable
- HOA & community: No mandatory association dues
Exterior
- Parking: 1-car garage
- Utilities: Living area reported as 1,344 (builder source)
- Home design: Single-family residence; One-story; Existing property
- Construction: Brick construction; Wood roof; Conventional foundation; Built — existing (year not provided)
- Exterior features: Open patio; Interior lot
Interior
- Bedrooms: 3 bedrooms (one level)
- Bathrooms: 2 full bathrooms
- Heating & cooling: Electric heating
- Interior features: Open living area; No fireplace
Neighborhood map
What this means for you Summary
Snapshot
- This is a 3-bed/1.0-bath single-family listed at $120k.
Deal economics
- At list price, monthly cash flow is $213 ($3k/yr) — positive.
- The deal already cash-flows at list — no discount required.
- To meet the 1% rule (rent ≥ 1% of price), the offer needs to be $115k (3.8% below list).
- Recommended offer: $115k (3.8% below list) — sets the bar for 1% rule.
- Cap rate 8.4% vs local median 4.8% in Seminole — top-decile yield for the area; either an underpriced asset or a hidden risk that comps aren't pricing in. Stress-test before assuming the spread holds.
Location & tenants
- Location reads 63/100 on livability (#222 in OK) — a middle-class / working-renter tenant base. Strengths: cost of living A+, housing A; Watch: crime D+, amenities F, commute F.
- Seminole (town): math 17% / reading 21% proficiency, ranked #193 of 270 in OK (top 72%) — low school quality limits family demand, transient renter base, plan for 1-2y turnover; 63% free/reduced lunch — lower-income household profile, screen leases tightly.
- Zoned schools: Wilson Es (math 27% / reading 22%, grade F, #354 of 845 statewide, top 47%, 499 students, 0% FRL); Northwood Es (math 19% / reading 21%, grade F, #158 of 345 statewide, top 47%, 301 students, 0% FRL); Seminole Hs (math 17% / reading 27%, grade F, #222 of 447 statewide, top 52%, 451 students, 0% FRL) — zoned schools average 0% FRL vs 63% district-wide (63 pts lower); this property's tenant base skews higher-income than the district average.
- Market conditions: 136 active listings in the ZIP; 93 units permitted in Seminole County in 2024 (43 in 5+ unit buildings).
Forward outlook
- In year one you build about $13k of equity ($830 loan paydown + $12k appreciation (10.0% local appreciation)).
- At projected returns (10.0% appreciation + 3.0% rent growth), your $34k cash investment doubles in ~3 years — after that, you're playing with house money.
- By year 3, paydown + projected appreciation supports a ~$32k cash-out refi (75% LTV) — recoverable capital for the next deal without selling this one.
Negotiation context
- It's been on market 58 days — a 3% lower offer ($116k) is reasonable based on typical stale-listing flexibility.
Risks & watch-outs
- Watch-outs: built in 1930 — expect roof / HVAC / electrical / plumbing capex.
- Climate carrying-cost: severe wildfire risk; extreme-heat days projected 7→19/yr by 2055 (HVAC capex compounding) — expect insurance premiums to compound above CPI over the hold.
Questions for the listing agent
- It's been on market 58 days. Have you received any prior offers? Is the seller open to a 4% concession, seller financing, or rate buy-down credit?
- Built in 1930 — when were the roof, HVAC, electrical panel, plumbing, and water heater last replaced?
- Is there a deadline driving the sale (1031 exchange, divorce, estate, relocation)? That informs how much negotiation room exists.
- Schools are F-rated, which usually means shorter tenancies and higher turnover. Who's the typical renter profile here, and what's been the actual vacancy rate?
- Crime grade is D in this area — have there been break-ins, vandalism, or insurance claims at this property in the last 3 years? What carrier currently insures it and at what premium?
- What's the average days-on-market for RENTAL listings here right now (not sales)? A rising rental-DOM trend means longer vacancies and softer asking-rent achievability than the comps imply.
- What's the recent tenant-quality profile in this submarket — average credit score on applications, eviction rate, late-payment / NSF rate, and stable-employment percentage? A property-management company in the area should have these aggregated.
- How much new for-sale + rental construction is in the pipeline within 1–3 miles? Heavy new supply typically softens prices + rents 12–24 months out; constrained supply supports both.
Investment metrics
- 1% rule
- 0.96% ✗
- Cap rate
- 8.42%
- Cash-on-cash
- 7.59%
- DSCR
- 1.34
- GRM
- 8.7
CMA / ARV
- ARV (on-the-fly)
- $124,992
- Comps found
- 12
Show comp detail 12 sales within ~0.75 mi
| Address | Dist | Beds/Ba | Sqft | Sold | Price | $/sf | Match |
|---|---|---|---|---|---|---|---|
| 903 Jefferson St | 0.09mi | 3/1.0 | 1,235 (-8%) | 2mo | $100,000 | $81 | 81 |
| 219 W Seminole Ave | 0.33mi | 3/1.0 | 1,388 (+3%) | 2mo | $133,355 | $96 | 78 |
| 404 Jefferson St | 0.28mi | 3/1.0 | 1,273 (-5%) | 8mo | $96,000 | $75 | 71 |
| 901 Lincoln St | 0.43mi | 3/1.5 | 1,384 (+3%) | 6mo | $120,000 | $87 | 68 |
| 600 Hoover St | 0.21mi | 3/1.0 | 1,152 (-14%) | 7mo | $17,000 | $15 | 60 |
| 1011 Coolidge St | 0.24mi | 3/1.0 | 1,165 (-13%) | 9mo | $125,000 | $107 | 59 |
| 1222 Gessel St | 0.35mi | 3/1.0 | 1,188 (-12%) | 8mo | $21,000 | $18 | 58 |
| 812 Roosevelt St | 0.22mi | 4/2.0 (+1) | 1,499 (+12%) | 4mo | $192,900 | $129 | 58 |
| 801 Hoover St | 0.25mi | 2/1.0 (-1) | 1,184 (-12%) | 8mo | $18,600 | $16 | 57 |
| 712 Elm St | 0.56mi | 3/2.0 | 1,242 (-8%) | 1mo | $162,500 | $131 | 57 |
| 716 Elm St | 0.56mi | 3/2.0 | 1,242 (-8%) | 3mo | $165,900 | $134 | 55 |
| 1313 Jefferson St | 0.40mi | 3/1.0 | 1,170 (-13%) | 8mo | $109,000 | $93 | 53 |
Match score weights: distance 35% · size 25% · config 20% · recency 20%. Top-matched comps best support the ARV.
Projected returns pro-forma
10.0% appreciation · 3.0% rent growth · sell at horizon
- IRR
- 29.8%
- Equity multiple
- 3.35×
- Total profit
- $78,836
- Equity at exit
- $108,106
- IRR
- 25.8%
- Equity multiple
- 7.59×
- Total profit
- $221,385
- Equity at exit
- $233,134
Cash invested: $33,600 (down + closing). Projections, not guarantees.
Landlord ↔ Tenant lean methodology
- Overall (STATE)
- 83 Strongly Landlord-Friendly
- State Oklahoma
- 83 Strongly Landlord-Friendly · R+20
- County
- — inherits STATE
- City
- — inherits STATE
ZIP-level market 74868
- Home prices YoY
- 6.4%
- Active inventory
- 136
- Price-to-rent
- 8.7×
Monthly cashflow live
- Estimated rent
- $1,154 medium interval (Pro) →
- Mortgage (P&I)
- −$629
- Tax from tax record
- −$20 /mo · $240/yr
- Insurance
- −$50
- HOA
- −$0
- Vacancy / Maint / Mgmt
- −$242
- Net cashflow
- $213
Break-even live
Sensitivity live
| Price | -10% $281 | -5% $247 | +0% $213 | +5% $41 | +10% $0 |
|---|---|---|---|---|---|
| Rent | -10% $121 | -5% $167 | +0% $213 | +5% $258 | +10% $304 |
| Rate | -1.0pp $273 | -0.5pp $243 | base $213 | +0.5pp $182 | +1.0pp $150 |
UW: 25.0% down · 7.5% · 30yr · 1.5% tax · 5.0% vac · 8.0% maint · 8.0% mgmt
Financing live
Cash to close
- Down payment
- $30,000
- Closing costs
- $3,600
- Reserves months
- —
- Total cash needed
- —
Loan-product check · same deal, 3 products live
Conventional
25% down · 7.5% · 30yr
- Down + closing
- —
- Monthly P&I
- —
- Monthly cashflow
- —
- DSCR
- —
- Eligible?
- —
Personal DTI + credit; lowest rate.
DSCR
20% down · 8.5% · 30yr
- Down + closing
- —
- Monthly P&I
- —
- Monthly cashflow
- —
- DSCR
- —
- Eligible?
- —
No personal income docs; deal must DSCR.
Hard money
10% down · 12.0% · 12mo
- Down + closing
- —
- Monthly P&I
- —
- Monthly cashflow
- —
- DSCR
- —
- Eligible?
- —
Short-term bridge; refi at stabilization.
Listing history 3 events
-
2026-05-15status Pending
-
2026-04-14price $120,000
-
2026-03-17$125,000 Active
ⓘ Source: listings_history table (triggers on properties + properties_extension) + one-shot
backfill from property_details.listing_events for pre-trigger history.
Tax reassessment forecast OK · Resets to sale price
- Current annual tax
- $240 · $20/mo
- Projected year-2 tax
- $1,080 · $90/mo
- Expected delta
- +$840/yr (+$70/mo · 350.0%)
ⓘ Screening estimate from a state-policy table — verify with the county assessor before closing.
Climate risk First Street
- Flood 1/10 Low FEMA zone X (unshaded) · 0% chance over 30 yrs
- Wildfire 9/10 Extreme
- Heat 6/10 Major 7 d/yr ≥112°F today · 19 d/yr by 30 yrs out
- Wind 3/10 Moderate 7% chance of damaging wind over 30 yrs
- Air quality 2/10 Low 1 unhealthy d/yr today · 1 by 30 yrs out
Nearby sold comps map
Loading sold comps map…
Walkable amenities ~0.75 mi
Loading nearby amenities…
Taxation est. · year 1
- Rental income
- $13,852
- − Mortgage interest
- −$6,722
- − Property taxes
- −$240
- − Insurance
- −$600
- − Repairs & maintenance
- −$1,108
- − Management
- −$1,108
- − Depreciation
- −$3,491
- Taxable income
- $583
- Est. tax owed @ 24.0%
- −$140
- After-tax cash flow
- $2,412/yr
For passive investors: Depreciation is non-cash, so a rental often shows a tax loss while cash-flowing — sheltering income. Rental losses are passive: they offset passive income freely, and up to $25,000/yr can offset ordinary (W-2) income if you actively participate and your MAGI is under $100k (phasing out to $0 by $150k); unused losses carry forward. On sale, claimed depreciation is recaptured at up to 25%, and gains may owe capital-gains tax (a 1031 exchange can defer both). Figures are a year-1 estimate at your 24.0% rate — not tax advice; consult a CPA.
Schools (NCES district)
- District
- Seminole
- NCES district ID
- 4027300
- Math proficiency
- 17% ▼ -10.00%
- Reading proficiency
- 21% ▼ -5.00%
- Median HH income
- $33,661
- Composite
- 15.51/100
- National rank
- #9304
- State rank
- #193 of 270 in OK
Livability — Seminole
- Score
- 63/100
- State rank
- #222
- US rank
- #15706
Category grades
Schools grade is shown separately in the Schools card above.
Census & demographics
- Census place
- Seminole, OK
- Population (ZIP)
- 12,451
Population outlook (Seminole County) Hauer SSP2
- Today (2025)
- 25,628 people
- By 2030
- 25,617 · +-0.0%
- By 2040
- 25,619 · +-0.0%
- By 2050
- 25,726 · +0.4%
- By 2075
- 26,261 · +2.5%
- By 2100
- 25,844 · +0.8%
Race, ethnicity, and origin ACS 2023
- Neighborhood character
- Diverse neighborhood (Simpson 0.57)
- Race & ethnicity
- White 65% Native American 19% Two or more races 10% Hispanic / Latino 5% Black 4%
- Hispanic origin (detail)
- Mexican 4%
- Common ancestry
- Iranian 1% Italian 1% Slovak 1%
- Foreign-born
- 3% · Canada
- Languages at home
- 96% English-only · Spanish 2%
Political lean MEDSL · Seminole
- 2024 margin
- Solid R (+49.7) · D 24.2% · R 74.0% · Other 1.8%
- 2008→2024 swing
- -19.1pp toward R · 2008: -30.6pp · 2024: -49.7pp
- All cycles
- 2024: R+49.7 2020: R+46.3 2016: R+44.1 2012: R+30.3 2008: R+30.6
Not yet ingested
- Civics
- —
Market trends
- HPI YoY
- ▲ 15.39%
- Current HPI
- 255.6657
- Rent YoY
- —
- Metro
- —
- State GDP YoY
- ▲ 1.55%
- F500 in state
- 6
Industry mix (Fortune 500 HQ in OK)
| Industry | F500 HQs | Revenue |
|---|---|---|
| Energy | 3 | $48B |
|
||
Price history
-4.0% since first listed3 events — show timeline
- 2026-05-15 Pending — MLSOK
- 2026-04-14 Price Changed $120,000 MLSOK
- 2026-03-17 Listed $125,000 MLSOK
Property tax history
+2.1%/yrLatest (2025): $240 · -4.4% YoY. Source: county tax records.
Cash-flow waterfall
monthlySold comps — $/sqft
last 12 mo · ≤1 miLoading sold comps…