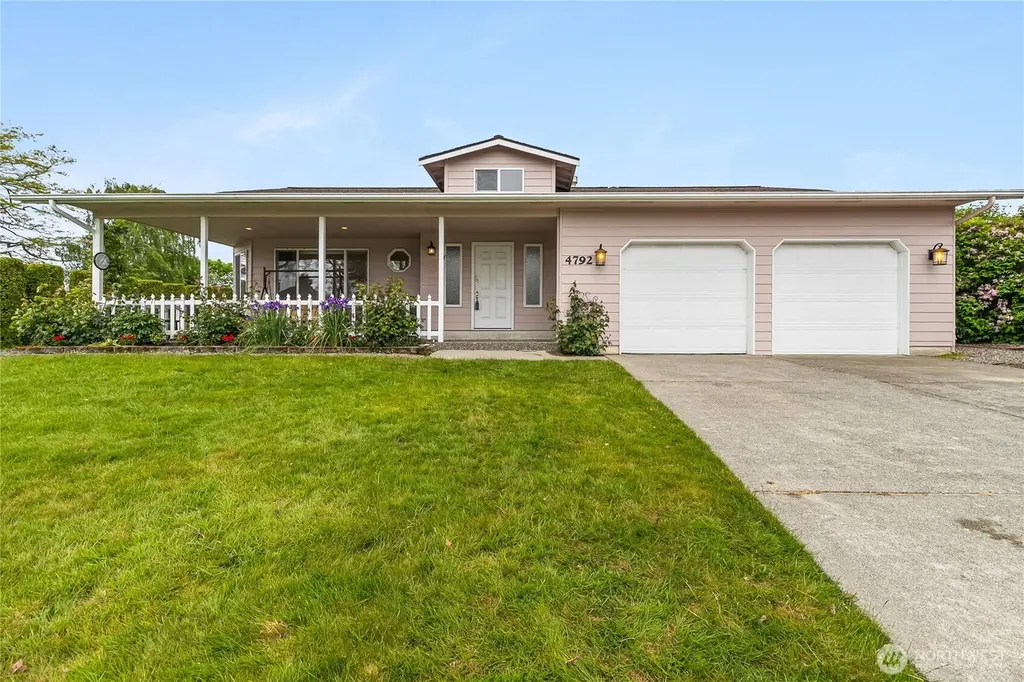
4792 N Golf Course Dr · Birch Bay, WA
Flood risk 1/10 · Minimal
- FEMA flood zone
- X (unshaded)
- Chance of flooding over 30 yrs
- 0.0%
- Est. flood insurance / yr
- $507 – $1,088
Fire risk 1/10 · Minimal
- Est. fire insurance / yr
- $604 – $1,122
Heat risk 3/10 · Minor
- Hot days now (above 81°F)
- 7 days/yr
- Hot days in 30 yrs
- 19 days/yr
Wind risk 1/10 · Minimal
- Chance of severe wind over 30 yrs
- —
Air-quality risk 6/10 · Moderate
- Unhealthy air days now
- 7 days/yr
- Unhealthy air days in 30 yrs
- 10 days/yr
Risk factors via First Street. Map © Google.
Why this score? — see what drove the D- grade
The composite is a weighted blend of 9 inputs, each scored 0–100. Each bar is that input's sub-score; the figure is the points it added to the 100-point composite (weight × sub-score).
- Appreciation +10.0/10.0
- ARV discount +9.4/15.0
- Cash flow +5.2/30.0
- Schools +4.7/10.0
- Rent growth +3.3/5.0
- Livability +3.1/5.0
- Condition / age +2.5/5.0
- 1% rule +0.2/10.0
- DSCR +0.0/10.0
$520,000
🖨 Deal sheet 📄 Offer letter ✓ Due diligence
Listing remarks
Welcome to easy coastal living in the sought-after Sea Links community! This beautifully maintained 3-bedroom, 1.75-bath, single-level home offers 1,600 square feet of comfort and convenience on a desirable corner lot in the heart of Birch Bay. Built in 1993, the home features an open, comfortable layout with great flow between living spaces, LVP flooring and carpet throughout, and a gas fireplace that adds warmth to the living area. A covered front porch provides a welcoming entry, while the private back patio and mature landscaping create a peaceful outdoor retreat. The backyard also offers space for gardening enthusiasts, with room to cultivate flowers, herbs, or a small vegetable garden
Key facts
- Covered front porch
- Gas fireplace
- Sea links community
Tags
Property features AI
Finance
- Other: Property taxes listed (information provided); Living area reported as 1,600 sq ft
- Financial info: Acceptable financing: Cash, Conventional, FHA, VA
- HOA & community: Homeowners association (HOA) with annual fee of $500; HOA covers road maintenance, security, and snow removal; CCRs in community
Exterior
- Parking: Attached garage; Covered parking for 2 vehicles; Garage (~528 sq ft)
- Security: Gated community; Security gate; Security service
- Utilities: Public water; Sewer connected; Electric and natural gas service; Power company: PSE; Internet: Xfinity
- Home design: Single-family residence; One story; Main level entry; South-facing
- Construction: Built on lot; Cement plank construction; Composition roof; Poured concrete foundation; House structure
- Exterior features: Cement plank siding; Corner lot; Paved lot
Interior
- Kitchen: Dishwasher; Garbage disposal; Microwave; Refrigerator; Stove/Range
- Bedrooms: 3 bedrooms (all on the main level)
- Flooring: Vinyl plank; Carpet
- Bathrooms: 1 full bath; 1 three-quarter bath; 2 showers; 1 bathtub
- Heating & cooling: Forced air heating; No central cooling
- Interior features: Ceiling fans; Dining room; Fireplace (gas); Skylights; Vaulted ceilings
- Laundry & utility: Washer; Dryer
Neighborhood map
What this means for you Summary
Snapshot
- This is a 3-bed/2.0-bath single-family listed at $520k.
Deal economics
- At list price, monthly cash flow is $-1k ($-14k/yr) — negative.
- To cash-flow at today's rent, offer at most $313k (39.9% below list).
- To meet the 1% rule (rent ≥ 1% of price), the offer needs to be $269k (48.2% below list).
- Recommended offer: $269k (48.2% below list) — sets the bar for 1% rule.
- Cap rate 3.6% vs local median 2.6% in Birch Bay — top-decile yield for the area; either an underpriced asset or a hidden risk that comps aren't pricing in. Stress-test before assuming the spread holds.
Location & tenants
- Location reads 62/100 on livability (#406 in WA) — a middle-class / working-renter tenant base. Strengths: housing A; Watch: cost of living D+, health & safety D, amenities F.
- Blaine School District (town): math 49% / reading 55% proficiency, ranked #120 of 291 in WA (top 41%) — acceptable for families but not a draw, mixed tenant base, ~2y average lease.
- Zoned schools: Blaine Elementary School (463 students, 54% FRL); Blaine High School (609 students, 46% FRL) — zoned schools average 50% FRL vs 33% district-wide (17 pts higher); higher-poverty schools than district average — tighter screening recommended.
- Market conditions: Rents rising (+3.1%/yr); 454 active listings in the ZIP; solid renter incomes; 1,190 units permitted in Whatcom County in 2024 (327 in 5+ unit buildings).
- This rent runs 37% of the median local income ($87k/yr) — at the standard rent-burdened threshold; future hikes will face affordability resistance.
Forward outlook
- In year one you build about $56k of equity ($4k loan paydown + $52k appreciation (10.0% local appreciation)).
- Whatcom County population projected at +28% by 2050 — long-run rental-demand tailwind backs the buy-and-hold thesis.
- By year 2, paydown + projected appreciation supports a ~$89k cash-out refi (75% LTV) — recoverable capital for the next deal without selling this one.
Negotiation context
- Only 10 days on market — expect competitive offers; lowballing is unlikely to land.
- Current owner paid $148k; list at $520k implies a 251% gain — meaningful room to come down on a strong offer.
Questions for the listing agent
- What do current leases actually rent for vs. the listed asking? Can we see a recent rent roll and the last 12 months of T-12 income?
- What does the HOA fee cover, when was the last increase, and are there any pending special assessments or reserve-fund shortfalls?
- Is there a deadline driving the sale (1031 exchange, divorce, estate, relocation)? That informs how much negotiation room exists.
- Schools are F-rated, which usually means shorter tenancies and higher turnover. Who's the typical renter profile here, and what's been the actual vacancy rate?
- The area grade is low — what's the realistic commute time and amenity access for the typical tenant pool here? Any planned neighborhood developments (good or bad) we should know about?
- What's the average days-on-market for RENTAL listings here right now (not sales)? A rising rental-DOM trend means longer vacancies and softer asking-rent achievability than the comps imply.
- What's the recent tenant-quality profile in this submarket — average credit score on applications, eviction rate, late-payment / NSF rate, and stable-employment percentage? A property-management company in the area should have these aggregated.
- How much new for-sale + rental construction is in the pipeline within 1–3 miles? Heavy new supply typically softens prices + rents 12–24 months out; constrained supply supports both.
Investment metrics
- 1% rule
- 0.52% ✗
- Cap rate
- 3.59%
- Cash-on-cash
- -9.67%
- DSCR
- 0.57
- GRM
- 16.1
CMA / ARV
- ARV (median comp)
- $543,426
- List price
- $520,000
- Delta
- -4.31%
- Verdict
- FAIR
- Comps
- 20 within 1.0 mi
Show comp detail 9 sales within ~0.75 mi
| Address | Dist | Beds/Ba | Sqft | Sold | Price | $/sf | Match |
|---|---|---|---|---|---|---|---|
| 7965 W Golf Course Dr | 0.14mi | 2/3.0 (-1) | 1,612 (+1%) | 9mo | $668,000 | $414 | 76 |
| 4754 N Golf Course Dr | 0.11mi | 3/2.0 | 1,616 (+1%) | 23mo | $615,000 | $381 | 74 |
| 7985 Sawgrass Way | 0.07mi | 3/2.0 | 1,693 (+6%) | 19mo | $599,995 | $354 | 71 |
| 4808 Cedar Ln | 0.64mi | 3/2.0 | 1,604 (+0%) | 1mo | $609,000 | $380 | 69 |
| 7970 W Golf Course Dr | 0.10mi | 3/2.0 | 1,413 (-12%) | 14mo | $695,000 | $492 | 64 |
| 7921 W Golf Course Dr | 0.20mi | 3/2.0 | 1,472 (-8%) | 22mo | $625,000 | $425 | 60 |
| 7935 E Golf Course Dr | 0.22mi | 3/2.0 | 1,400 (-12%) | 19mo | $560,000 | $400 | 53 |
| 4955 Henley St | 0.63mi | 3/2.5 | 1,471 (-8%) | 6mo | $489,000 | $332 | 50 |
| 4924 Henley St | 0.54mi | 4/2.0 (+1) | 1,388 (-13%) | 23mo | $439,900 | $317 | 29 |
Match score weights: distance 35% · size 25% · config 20% · recency 20%. Top-matched comps best support the ARV.
Projected returns pro-forma
10.0% appreciation · 3.1% rent growth · sell at horizon
- IRR
- 17.5%
- Equity multiple
- 2.43×
- Total profit
- $208,608
- Equity at exit
- $468,457
- IRR
- 16.5%
- Equity multiple
- 5.62×
- Total profit
- $673,361
- Equity at exit
- $1,010,246
Cash invested: $145,600 (down + closing). Projections, not guarantees.
Landlord ↔ Tenant lean methodology
- Overall (STATE)
- 28 Tenant-Leaning
- State Washington
- 28 Tenant-Leaning · D+8
- County
- — inherits STATE
- City
- — inherits STATE
ZIP-level market 98230
- Home prices YoY
- 14.0%
- Rents YoY
- 3.1%
- Active inventory
- 454
- Price-to-rent
- 16.1×
Monthly cashflow live
- Estimated rent
- $2,695 medium interval (Pro) →
- Mortgage (P&I)
- −$2,727
- Tax from tax record
- −$317 /mo · $3,800/yr
- Insurance
- −$217
- HOA
- −$42
- Vacancy / Maint / Mgmt
- −$566
- Net cashflow
- $-1,173
Break-even live
UW: 25.0% down · 7.5% · 30yr · 1.5% tax · 5.0% vac · 8.0% maint · 8.0% mgmt
Financing live
Cash to close
- Down payment
- $130,000
- Closing costs
- $15,600
- Reserves months
- —
- Total cash needed
- —
Loan-product check · same deal, 3 products live
Conventional
25% down · 7.5% · 30yr
- Down + closing
- —
- Monthly P&I
- —
- Monthly cashflow
- —
- DSCR
- —
- Eligible?
- —
Personal DTI + credit; lowest rate.
DSCR
20% down · 8.5% · 30yr
- Down + closing
- —
- Monthly P&I
- —
- Monthly cashflow
- —
- DSCR
- —
- Eligible?
- —
No personal income docs; deal must DSCR.
Hard money
10% down · 12.0% · 12mo
- Down + closing
- —
- Monthly P&I
- —
- Monthly cashflow
- —
- DSCR
- —
- Eligible?
- —
Short-term bridge; refi at stabilization.
HOA detail
- Monthly dues
- $42 · $504/yr
- Likely covers
- gaslandscaping
Listing history 5 events
-
2026-05-12$520,000 Active
-
2000-08-15soldstatus $148,250
-
1997-09-19soldstatus $135,000
-
1990-04-05soldstatus $21,500
-
1988-09-27soldstatus $14,243
ⓘ Source: listings_history table (triggers on properties + properties_extension) + one-shot
backfill from property_details.listing_events for pre-trigger history.
Tax reassessment forecast WA · Resets to sale price
- Current annual tax
- $3,800 · $317/mo
- Projected year-2 tax
- $5,096 · $425/mo
- Expected delta
- +$1,296/yr (+$108/mo · 34.1%)
ⓘ Screening estimate from a state-policy table — verify with the county assessor before closing.
Climate risk First Street
- Flood 1/10 Low FEMA zone X (unshaded) · 0% chance over 30 yrs
- Wildfire 1/10 Low
- Heat 3/10 Moderate 7 d/yr ≥81°F today · 19 d/yr by 30 yrs out
- Wind 1/10 Low
- Air quality 6/10 Major 7 unhealthy d/yr today · 10 by 30 yrs out
Nearby sold comps map
Loading sold comps map…
Walkable amenities ~0.75 mi
Loading nearby amenities…
Taxation est. · year 1
- Rental income
- $32,337
- − Mortgage interest
- −$29,128
- − Property taxes
- −$3,800
- − Insurance
- −$2,600
- − Repairs & maintenance
- −$2,587
- − Management
- −$2,587
- − HOA
- −$504
- − Depreciation
- −$15,127
- Taxable loss
- −$23,995
- Est. tax savings @ 24.0%
- +$5,759
- After-tax cash flow
- $-8,321/yr
For passive investors: Depreciation is non-cash, so a rental often shows a tax loss while cash-flowing — sheltering income. Rental losses are passive: they offset passive income freely, and up to $25,000/yr can offset ordinary (W-2) income if you actively participate and your MAGI is under $100k (phasing out to $0 by $150k); unused losses carry forward. On sale, claimed depreciation is recaptured at up to 25%, and gains may owe capital-gains tax (a 1031 exchange can defer both). Figures are a year-1 estimate at your 24.0% rate — not tax advice; consult a CPA.
Schools (NCES district)
- District
- Blaine School District
- NCES district ID
- 5300570
- Math proficiency
- 49% ▼ -1.00%
- Reading proficiency
- 55% ▼ -2.00%
- Median HH income
- $57,085
- Composite
- 47.05/100
- National rank
- #5128
- State rank
- #120 of 291 in WA
Livability — Birch Bay
- Score
- 62/100
- State rank
- #406
- US rank
- #16180
Category grades
Schools grade is shown separately in the Schools card above.
Census & demographics
- Census place
- Birch Bay, WA
- County
- Whatcom County · 209,776 people
- Metro
- Bellingham, WA
- Population (ZIP)
- 18,744
- Household income
- $86,623
- Rent vs Own
- Severe rent burden
- 454.0
Population outlook (Whatcom County) Hauer SSP2
- Today (2025)
- 240,408 people
- By 2030
- 254,667 · +5.9%
- By 2040
- 281,365 · +17.0%
- By 2050
- 307,592 · +27.9%
- By 2075
- 375,576 · +56.2%
- By 2100
- 421,637 · +75.4%
Race, ethnicity, and origin ACS 2023
- Neighborhood character
- Predominantly White (77%)
- Race & ethnicity
- White 77% Two or more races 11% Hispanic / Latino 9% Asian 3% Pacific Islander 2% Black 1%
- Hispanic origin (detail)
- Mexican 5%
- Common ancestry
- Portuguese 6% Iranian 4% Lithuanian 3%
- Foreign-born
- 13% · Canada, China
- Languages at home
- 89% English-only · Spanish 4% Russian/Polish/Slavic 1% Other Indo-European 1%
Political lean MEDSL · Whatcom
- 2024 margin
- Strong D (+24.9) · D 60.8% · R 35.9% · Other 3.3%
- 2008→2024 swing
- +6.9pp toward D · 2008: 18.0pp · 2024: 24.9pp
- All cycles
- 2024: D+24.9 2020: D+23.9 2016: D+17.7 2012: D+12.1 2008: D+18.0
Not yet ingested
- Civics
- —
Market trends
- HPI YoY
- ▲ 106.58%
- Current HPI
- 868.68
- Rent YoY
- ▲ 3.10%
- Metro
- Bellingham, WA
- State GDP YoY
- ▲ 4.65%
- F500 in state
- 22
Industry mix (Fortune 500 HQ in WA)
| Industry | F500 HQs | Revenue |
|---|---|---|
| Retail | 2 | $269B |
|
||
| Technology / Retail | 1 | $638B |
|
||
| Technology | 1 | $245B |
|
||
| Telecommunications | 1 | $38B |
|
||
| Food / Beverage | 1 | $36B |
|
||
| Automotive / Trucks | 1 | $34B |
|
||
Price history
+3550.9% since first listed6 events — show timeline
- 2026-05-22 Pending — NWMLS as Distributed by MLS Grid
- 2026-05-12 Listed $520,000 NWMLS as Distributed by MLS Grid
- 2000-08-15 Sold (Public Records) $148,250 Public Records
- 1997-09-19 Sold (Public Records) $135,000 Public Records
- 1990-04-05 Sold (Public Records) $21,500 Public Records
- 1988-09-27 Sold (Public Records) $14,243 Public Records
Property tax history
+4.3%/yrLatest (2026): $3,800 · +1.8% YoY. Source: county tax records.
Cash-flow waterfall
monthlySold comps — $/sqft
last 12 mo · ≤1 miLoading sold comps…