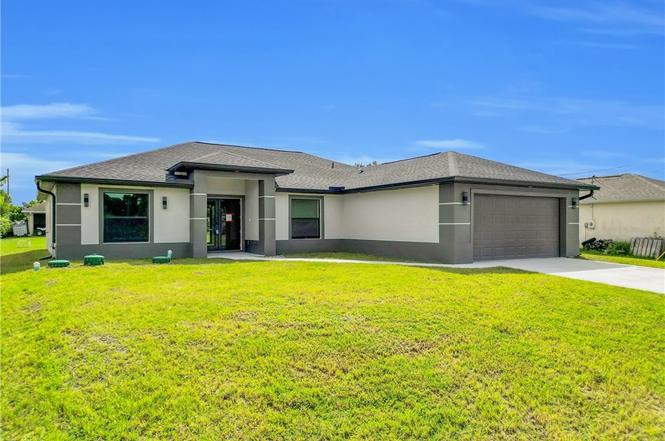
2927 8th St SW · Lehigh Acres, FL
Flood risk 1/10 · Minimal
- FEMA flood zone
- X (unshaded)
- Chance of flooding over 30 yrs
- 0.0%
- Est. flood insurance / yr
- $507 – $1,088
Fire risk 1/10 · Minimal
- Est. fire insurance / yr
- $947 – $1,759
Heat risk 9/10 · Severe
- Hot days now (above 107°F)
- 7 days/yr
- Hot days in 30 yrs
- 25 days/yr
Wind risk 10/10 · Severe
- Chance of severe wind over 30 yrs
- 99.0%
Air-quality risk 2/10 · Minimal
- Unhealthy air days now
- 1 days/yr
- Unhealthy air days in 30 yrs
- 1 days/yr
Risk factors via First Street. Map © Google.
Why this score? — see what drove the D- grade
The composite is a weighted blend of 9 inputs, each scored 0–100. Each bar is that input's sub-score; the figure is the points it added to the 100-point composite (weight × sub-score).
- Appreciation +10.0/10.0
- ARV discount +7.5/15.0
- Cash flow +7.3/30.0
- Schools +4.1/10.0
- Livability +3.0/5.0
- Condition / age +2.5/5.0
- 1% rule +2.1/10.0
- Rent growth +2.1/5.0
- DSCR +1.4/10.0
$300,000
🖨 Deal sheet 📄 Offer letter ✓ Due diligence
Listing remarks
Back on the market! Previous contract fell through due to buyer financing issues—don't miss this second chance to make it yours! The deal won't last long. 3/2 with a den!– Act Fast! Put in your offer today! Brand-new dream home in the highly sought-after Lehigh Acres area! This stunning 3-bedroom, 2-bathroom home includes a spacious den that can serve as an office, study, or formal dining room. With 1,682 sq. ft. of beautifully designed living space and an attached 2-car garage, this home perfectly blends modern elegance with everyday functionality. Inside, enjoy luxury porcelain tile throughout and an open-concept layout connecting the living, dining, and kitchen areas, ideal f
Key facts
- Custom-tiled shower
- Gourmet kitchen
- Spacious den
Tags
Property features AI
Finance
- Financial info: Pets allowed
- HOA & community: Non-gated community; No association fee
Exterior
- Parking: Attached garage with 2 covered spaces; Paved driveway; Garage door opener
- Security: Smoke detector(s)
- Utilities: Septic tank; Well water; Cable available; High-speed internet available; Public maintained paved road
- Home design: Single-story; New construction; North-facing; Entry level 1
- Construction: Block, concrete and stucco construction; Shingle roof; Rectangular lot; Lot dimensions approximately 80 x 136 x 80 x 136; South exposure
- Exterior features: Patio; Security/high impact doors; Smoke detectors
Interior
- Kitchen: Dishwasher; Electric cooktop; Freezer; Disposal; Microwave; Range; Refrigerator; Self-cleaning oven
- Bedrooms: Bedroom on main level; Main level primary
- Flooring: Tile
- Bathrooms: 2 full bathrooms
- Heating & cooling: Central heating (electric); Central air (electric)
- Interior features: Built-in features; Separate/formal dining room; Eat-in kitchen; Kitchen island; Multiple shower heads; Pantry; Cable TV; Vaulted ceilings; Walk-in closets; French doors/atrium doors; Sliding windows; Impact glass; Wheelchair access; Unfurnished
- Laundry & utility: Washer hookup; Dryer hookup
Neighborhood map
What this means for you Summary
Snapshot
- This is a 3-bed/2.0-bath land listed at $300k.
Deal economics
- At list price, monthly cash flow is $-402 ($-5k/yr) — negative.
- To cash-flow at today's rent, offer at most $242k (19.4% below list).
- To meet the 1% rule (rent ≥ 1% of price), the offer needs to be $212k (29.5% below list).
- Recommended offer: $212k (29.5% below list) — sets the bar for 1% rule.
Location & tenants
- Location reads 59/100 on livability (#826 in FL) — a working-class tenant base; expect higher turnover. Strengths: cost of living A+, housing A+; Watch: crime C-, employment D+, schools D-.
- Lee (suburban): math 47% / reading 50% proficiency, ranked #42 of 73 in FL (top 58%) — families likely to look elsewhere, expect single-tenant / working-renter base with shorter leases.
- Market conditions: Rents soft (-1.5%/yr); 786 active listings in the ZIP; 40 comparable units currently listed for rent nearby; rentals at typical pace (median 21d on market — plan ~3-4 weeks tenant-placement turnaround); 15,411 units permitted in Lee County in 2024 (4,686 in 5+ unit buildings).
- This rent runs 35% of the median local income ($73k/yr) — at the standard rent-burdened threshold; future hikes will face affordability resistance.
Forward outlook
- In year one you build about $32k of equity ($2k loan paydown + $30k appreciation (10.0% local appreciation)).
- Lee County population projected at +44% by 2050 — long-run rental-demand tailwind backs the buy-and-hold thesis.
- By year 2, paydown + projected appreciation supports a ~$52k cash-out refi (75% LTV) — recoverable capital for the next deal without selling this one.
Negotiation context
- It's been on market 202 days — a 12% lower offer ($264k) is reasonable based on typical stale-listing flexibility.
- 2 sale attempts; this cycle's ask has dropped $60k (17%) from the opening price — seller is motivated, your offer sets the floor, not the list.
- Current owner paid $43k; list at $300k implies a 598% gain — meaningful room to come down on a strong offer.
Risks & watch-outs
- Climate carrying-cost: severe wind risk, 99% chance of damaging wind over 30y; extreme-heat days projected 7→25/yr by 2055 (HVAC capex compounding) — expect insurance premiums to compound above CPI over the hold.
Questions for the listing agent
- What do current leases actually rent for vs. the listed asking? Can we see a recent rent roll and the last 12 months of T-12 income?
- It's been on market 202 days. Have you received any prior offers? Is the seller open to a 29% concession, seller financing, or rate buy-down credit?
- Why hasn't it sold? Are there any deal-killer items the seller is aware of (foundation, flood, title, zoning, code violations)?
- Is there a deadline driving the sale (1031 exchange, divorce, estate, relocation)? That informs how much negotiation room exists.
- Schools are D-rated, which usually means shorter tenancies and higher turnover. Who's the typical renter profile here, and what's been the actual vacancy rate?
- The area grade is low — what's the realistic commute time and amenity access for the typical tenant pool here? Any planned neighborhood developments (good or bad) we should know about?
- What's the average days-on-market for RENTAL listings here right now (not sales)? A rising rental-DOM trend means longer vacancies and softer asking-rent achievability than the comps imply.
- What's the recent tenant-quality profile in this submarket — average credit score on applications, eviction rate, late-payment / NSF rate, and stable-employment percentage? A property-management company in the area should have these aggregated.
- How much new for-sale + rental construction is in the pipeline within 1–3 miles? Heavy new supply typically softens prices + rents 12–24 months out; constrained supply supports both.
Investment metrics
- 1% rule
- 0.71% ✗
- Cap rate
- 4.69%
- Cash-on-cash
- -5.74%
- DSCR
- 0.74
- GRM
- 11.8
CMA / ARV
No comps found within radius.
Projected returns pro-forma
10.0% appreciation · 0.0% rent growth · sell at horizon
- IRR
- 19.4%
- Equity multiple
- 2.57×
- Total profit
- $131,620
- Equity at exit
- $270,264
- IRR
- 17.3%
- Equity multiple
- 5.72×
- Total profit
- $396,694
- Equity at exit
- $582,834
Cash invested: $84,000 (down + closing). Projections, not guarantees.
Landlord ↔ Tenant lean methodology
- Overall (STATE)
- 87 Strongly Landlord-Friendly
- State Florida
- 87 Strongly Landlord-Friendly · R+3
- County
- — inherits STATE
- City
- — inherits STATE
ZIP-level market 33976
- Home prices YoY
- 6.8%
- Rents YoY
- -1.5%
- Active inventory
- 786
- Price-to-rent
- 11.8×
Monthly cashflow live
- Estimated rent
- $2,116 high interval (Pro) →
- Mortgage (P&I)
- −$1,573
- Tax est. 1.5%
- −$375 /mo · $4,500/yr
- Insurance
- −$125
- HOA
- −$0
- Vacancy / Maint / Mgmt
- −$444
- Net cashflow
- $-402
Break-even live
UW: 25.0% down · 7.5% · 30yr · 1.5% tax · 5.0% vac · 8.0% maint · 8.0% mgmt
Financing live
Cash to close
- Down payment
- $75,000
- Closing costs
- $9,000
- Reserves months
- —
- Total cash needed
- —
Loan-product check · same deal, 3 products live
Conventional
25% down · 7.5% · 30yr
- Down + closing
- —
- Monthly P&I
- —
- Monthly cashflow
- —
- DSCR
- —
- Eligible?
- —
Personal DTI + credit; lowest rate.
DSCR
20% down · 8.5% · 30yr
- Down + closing
- —
- Monthly P&I
- —
- Monthly cashflow
- —
- DSCR
- —
- Eligible?
- —
No personal income docs; deal must DSCR.
Hard money
10% down · 12.0% · 12mo
- Down + closing
- —
- Monthly P&I
- —
- Monthly cashflow
- —
- DSCR
- —
- Eligible?
- —
Short-term bridge; refi at stabilization.
Rent comps 40 comps
| Address | Beds | Baths | Sqft | Rent | $/sqft | DOM | Units | Dist |
|---|---|---|---|---|---|---|---|---|
| 2916 7th St SW Lehigh Acres, FL | 3.0 | 2.0 | 1357 | $1,900 | $1.40 | 23d | 1 | 0.10mi |
| 3103 11th St SW Lehigh Acres, FL | 3.0 | 2.0 | 1212 | $1,800 | $1.49 | 23d | 1 | 0.31mi |
| 2812 4th St SW Lehigh Acres, FL | 3.0 | 2.0 | 1751 | $1,856 | $1.06 | 23d | 1 | 0.37mi |
| 2906 14th St SW Lehigh Acres, FL | 3.0 | 2.0 | 1563 | $2,450 | $1.57 | 23d | 1 | 0.37mi |
| 2909 15th St SW Lehigh Acres, FL | 3.0 | 2.0 | 1291 | $1,800 | $1.39 | 21d | 1 | 0.46mi |
| 3315 7th St SW Lehigh Acres, FL | 3.0 | 2.0 | 1212 | $1,950 | $1.61 | 23d | 1 | 0.62mi |
| 1507 Paula Ave S Lehigh Acres, FL | 3.0 | 2.0 | 1547 | $2,000 | $1.29 | 19d | 1 | 0.62mi |
| 3417 7th St SW Lehigh Acres, FL | 4.0 | 2.0 | 1833 | $1,850 | $1.01 | 10d | 1 | 0.80mi |
| 3408 10th St SW Lehigh Acres, FL | 4.0 | 2.0 | 1385 | $1,850 | $1.34 | 21d | 1 | 0.82mi |
| 3408 10th St SW Lehigh Acres, FL | 4.0 | 2.0 | 1920 | $1,750 | $0.91 | 14d | 1 | 0.82mi |
| 3402 13th St SW Lehigh Acres, FL | 3.0 | 2.0 | 1117 | $1,940 | $1.74 | 3d | 1 | 0.83mi |
| 2805 20th St SW Lehigh Acres, FL | 3.0 | 2.0 | 1151 | $1,699 | $1.48 | 3d | 1 | 0.86mi |
| 3202 21st St SW Lehigh Acres, FL | 3.0 | 2.0 | 1100 | $1,920 | $1.75 | 3d | 1 | 0.89mi |
| 2701 20th St SW Lehigh Acres, FL | 3.0 | 2.0 | 2019 | $1,900 | $0.94 | 19d | 1 | 0.93mi |
| 3303 8th St SW Lehigh Acres, FL | 3.0 | 2.0 | 1400 | $2,250 | $1.61 | 3d | 1 | 0.93mi |
| 3508 3rd St SW Lehigh Acres, FL | 3.0 | 2.0 | 1147 | $1,699 | $1.48 | 3d | 1 | 0.93mi |
| 3209 21st St SW Lehigh Acres, FL | 3.0 | 2.0 | 1418 | $1,699 | $1.20 | 3d | 1 | 0.94mi |
| 3008 23rd St SW Lehigh Acres, FL | 3.0 | 2.0 | 1640 | $2,350 | $1.43 | 23d | 1 | 0.94mi |
| 3405 4th St W Lehigh Acres, FL | 3.0 | 2.0 | 1184 | $1,715 | $1.45 | 14d | 1 | 0.98mi |
| 2902 7th St W Lehigh Acres, FL | 3.0 | 2.0 | 1841 | $2,085 | $1.13 | 2d | 1 | 0.99mi |
| 2902 7th St W Lehigh Acres, FL | 3.0 | 2.0 | 1841 | $2,215 | $1.20 | 14d | 1 | 0.99mi |
| 2709 6th St W Lehigh Acres, FL | 4.0 | 3.0 | 1915 | $2,400 | $1.25 | 19d | 1 | 0.99mi |
| 2709 6th St W Lehigh Acres, FL | 4.0 | 3.0 | 1915 | $2,400 | $1.25 | 21d | 1 | 0.99mi |
| 2914 24th St SW Lehigh Acres, FL | 3.0 | 2.0 | 1537 | $2,250 | $1.46 | 23d | 1 | 1.00mi |
| 3109 8th St SW Lehigh Acres, FL | 3.0 | 2.0 | 1324 | $1,845 | $1.39 | 21d | 1 | 1.02mi |
| 3008 25th St SW Lehigh Acres, FL | 4.0 | 2.0 | 1565 | $1,711 | $1.09 | 21d | 1 | 1.06mi |
| 1511 Terry Ave S Lehigh Acres, FL | 3.0 | 2.0 | 1579 | $1,996 | $1.26 | 23d | 1 | 1.07mi |
| 3201 23rd St SW Lehigh Acres, FL | 3.0 | 2.0 | 1324 | $1,845 | $1.39 | 21d | 1 | 1.07mi |
| 209 Punta Alta Ct Lehigh Acres, FL | 4.0 | 2.0 | 1860 | $1,950 | $1.05 | 19d | 1 | 1.08mi |
| 2916 9th St W Lehigh Acres, FL | 3.0 | 2.0 | 1053 | $1,750 | $1.66 | 23d | 1 | 1.10mi |
| 3615 6th St SW Lehigh Acres, FL | 3.0 | 2.0 | 1378 | $1,825 | $1.32 | 23d | 1 | 1.10mi |
| 2811 25th St SW Unit NA Lehigh Acres, FL | 3.0 | 2.0 | 1430 | $1,990 | $1.39 | 23d | 1 | 1.11mi |
| 3203 24th St SW Lehigh Acres, FL | 3.0 | 2.0 | 1498 | $2,300 | $1.54 | 21d | 1 | 1.13mi |
| 2614 7th St W Lehigh Acres, FL | 3.0 | 2.0 | 1912 | $2,500 | $1.31 | 23d | 1 | 1.13mi |
| 2612 7th St W Lehigh Acres, FL | 3.0 | 2.0 | 1492 | $2,295 | $1.54 | 23d | 1 | 1.14mi |
| 3208 9th St W Lehigh Acres, FL | 3.0 | 2.0 | 1423 | $1,916 | $1.35 | 3d | 1 | 1.14mi |
| 3109 10th St W Lehigh Acres, FL | 3.0 | 2.0 | 1472 | $1,950 | $1.32 | 23d | 1 | 1.14mi |
| 312 Grovewood Ave S Lehigh Acres, FL | 2.0 | 2.0 | 1325 | $1,800 | $1.36 | 23d | 1 | 1.16mi |
| 2602 24th St SW Lehigh Acres, FL | 3.0 | 2.0 | 1358 | $1,800 | $1.33 | 3d | 1 | 1.16mi |
| 3310 9th St W Lehigh Acres, FL | 3.0 | 2.0 | 1488 | $2,300 | $1.55 | 16d | 1 | 1.19mi |
Listing history 18 events
-
2026-06-17days on market $300,000 Active 202 DOM
-
2026-06-16days on market $300,000 Active 201 DOM
-
2026-06-16status $300,000 Active 200 DOM
-
2026-05-03status Pending
-
2026-04-20price $300,000
-
2026-04-02price $315,000
-
2026-03-13price $325,000
-
2026-01-11price $330,000
-
2025-12-02price $345,000
-
2025-10-15$360,000 Active
-
2025-10-09historical
-
2025-08-18price $340,000
-
2025-07-31price $344,000
-
2025-07-07price $349,000
-
2025-06-24price $354,000
-
2025-06-09price $359,000
-
2025-05-16$365,000 Active
-
2005-06-24soldstatus $43,000
ⓘ Source: listings_history table (triggers on properties + properties_extension) + one-shot
backfill from property_details.listing_events for pre-trigger history.
Climate risk First Street
- Flood 1/10 Low FEMA zone X (unshaded) · 0% chance over 30 yrs
- Wildfire 1/10 Low
- Heat 9/10 Extreme 7 d/yr ≥107°F today · 25 d/yr by 30 yrs out
- Wind 10/10 Extreme 99% chance of damaging wind over 30 yrs
- Air quality 2/10 Low 1 unhealthy d/yr today · 1 by 30 yrs out
Nearby sold comps map
Loading sold comps map…
Walkable amenities ~0.75 mi
Loading nearby amenities…
Taxation est. · year 1
- Rental income
- $25,387
- − Mortgage interest
- −$16,805
- − Property taxes
- −$4,500
- − Insurance
- −$1,500
- − Repairs & maintenance
- −$2,031
- − Management
- −$2,031
- − Depreciation
- −$8,727
- Taxable loss
- −$10,207
- Est. tax savings @ 24.0%
- +$2,450
- After-tax cash flow
- $-2,374/yr
For passive investors: Depreciation is non-cash, so a rental often shows a tax loss while cash-flowing — sheltering income. Rental losses are passive: they offset passive income freely, and up to $25,000/yr can offset ordinary (W-2) income if you actively participate and your MAGI is under $100k (phasing out to $0 by $150k); unused losses carry forward. On sale, claimed depreciation is recaptured at up to 25%, and gains may owe capital-gains tax (a 1031 exchange can defer both). Figures are a year-1 estimate at your 24.0% rate — not tax advice; consult a CPA.
Schools (NCES district)
- District
- Lee
- NCES district ID
- 1201080
- Math proficiency
- 47% ▼ -11.00%
- Reading proficiency
- 50% ▼ -4.00%
- Median HH income
- $49,518
- Composite
- 41.49/100
- National rank
- #3458
- State rank
- #42 of 73 in FL
Livability — Lehigh Acres
- Score
- 59/100
- State rank
- #826
- US rank
- #20055
Category grades
Schools grade is shown separately in the Schools card above.
Census & demographics
- Census place
- Lehigh Acres, FL
- County
- Lee County · 788,662 people
- City population
- 130,638
- Metro
- Cape Coral-Fort Myers, FL
- Population (ZIP)
- 20,277
- Household income
- $72,679
- Rent vs Own
- Severe rent burden
- 574.0
Population outlook (Lee County) Hauer SSP2
- Today (2025)
- 871,946 people
- By 2030
- 955,468 · +9.6%
- By 2040
- 1,113,587 · +27.7%
- By 2050
- 1,256,891 · +44.1%
- By 2075
- 1,560,270 · +78.9%
- By 2100
- 1,726,848 · +98.0%
Race, ethnicity, and origin ACS 2023
- Neighborhood character
- Diverse neighborhood (Simpson 0.65)
- Race & ethnicity
- Hispanic / Latino 50% Two or more races 30% White 24% Black 20% Asian 3%
- Hispanic origin (detail)
- Mexican 8% Puerto Rican 8% Cuban 18% Dominican 4%
- Common ancestry
- Hispanic 8% Slovak 1% Lithuanian 1%
- Foreign-born
- 35% · Canada, Jamaica, Vietnam
- Languages at home
- 46% English-only · Spanish 43% French/Haitian/Cajun 8% Vietnamese 1%
Political lean MEDSL · Lee
- 2024 margin
- Strong R (+28.4) · D 35.5% · R 63.9%
- 2008→2024 swing
- -18.0pp toward R · 2008: -10.4pp · 2024: -28.4pp
- All cycles
- 2024: R+28.4 2020: R+19.2 2016: R+20.4 2012: R+16.6 2008: R+10.4
Not yet ingested
- Civics
- —
Market trends
- HPI YoY
- ▲ 21.77%
- Current HPI
- 340.4255
- Rent YoY
- ▼ -1.54%
- Metro
- Cape Coral-Fort Myers, FL
- State GDP YoY
- ▲ 3.28%
- F500 in state
- 36
Industry mix (Fortune 500 HQ in FL)
| Industry | F500 HQs | Revenue |
|---|---|---|
| Industrial Technology | 2 | $29B |
|
||
| Insurance | 2 | $17B |
|
||
| Retail | 1 | $60B |
|
||
| Technology Distribution | 1 | $58B |
|
||
| Homebuilding | 1 | $35B |
|
||
| Technology Manufacturing | 1 | $35B |
|
||
Price history
+597.7% since first listed15 events — show timeline
- 2026-05-03 Pending — FORTMLS
- 2026-04-20 Price Changed $300,000 FORTMLS
- 2026-04-02 Price Changed $315,000 FORTMLS
- 2026-03-13 Price Changed $325,000 FORTMLS
- 2026-01-11 Price Changed $330,000 FORTMLS
- 2025-12-02 Price Changed $345,000 FORTMLS
- 2025-10-15 Listed $360,000 FORTMLS
- 2025-10-09 Listing Removed — NAPLESMLS
- 2025-08-18 Price Changed $340,000 NAPLESMLS
- 2025-07-31 Price Changed $344,000 NAPLESMLS
- 2025-07-07 Price Changed $349,000 NAPLESMLS
- 2025-06-24 Price Changed $354,000 NAPLESMLS
- 2025-06-09 Price Changed $359,000 NAPLESMLS
- 2025-05-16 Listed $365,000 NAPLESMLS
- 2005-06-24 Sold (Public Records) $43,000 Public Records
Property tax history
+18.1%/yrLatest (2025): $434 · +12.4% YoY. Source: county tax records.
Cash-flow waterfall
monthlySold comps — $/sqft
last 12 mo · ≤1 miLoading sold comps…