1316 Susan Ln · Poplar Bluff, MO
Flood risk 1/10 · Minimal
- FEMA flood zone
- X (unshaded)
- Chance of flooding over 30 yrs
- 0.0%
- Est. flood insurance / yr
- $507 – $1,088
Fire risk 3/10 · Minor
- Est. fire insurance / yr
- $1,054 – $1,958
Heat risk 5/10 · Moderate
- Hot days now (above 108°F)
- 7 days/yr
- Hot days in 30 yrs
- 20 days/yr
Wind risk 3/10 · Minor
- Chance of severe wind over 30 yrs
- 4.0%
Air-quality risk 2/10 · Minimal
- Unhealthy air days now
- 0 days/yr
- Unhealthy air days in 30 yrs
- 2 days/yr
Risk factors via First Street. Map © Google.
Why this score? — see what drove the D grade
The composite is a weighted blend of 9 inputs, each scored 0–100. Each bar is that input's sub-score; the figure is the points it added to the 100-point composite (weight × sub-score).
- Cash flow +16.0/30.0
- ARV discount +7.5/15.0
- DSCR +5.0/10.0
- Schools +3.5/10.0
- Livability +3.5/5.0
- 1% rule +3.3/10.0
- Rent growth +2.5/5.0
- Condition / age +2.5/5.0
- Appreciation +0.0/10.0
$150,000
🖨 Deal sheet (PDF) 📄 Offer letter ✓ Due diligence
Listing remarks
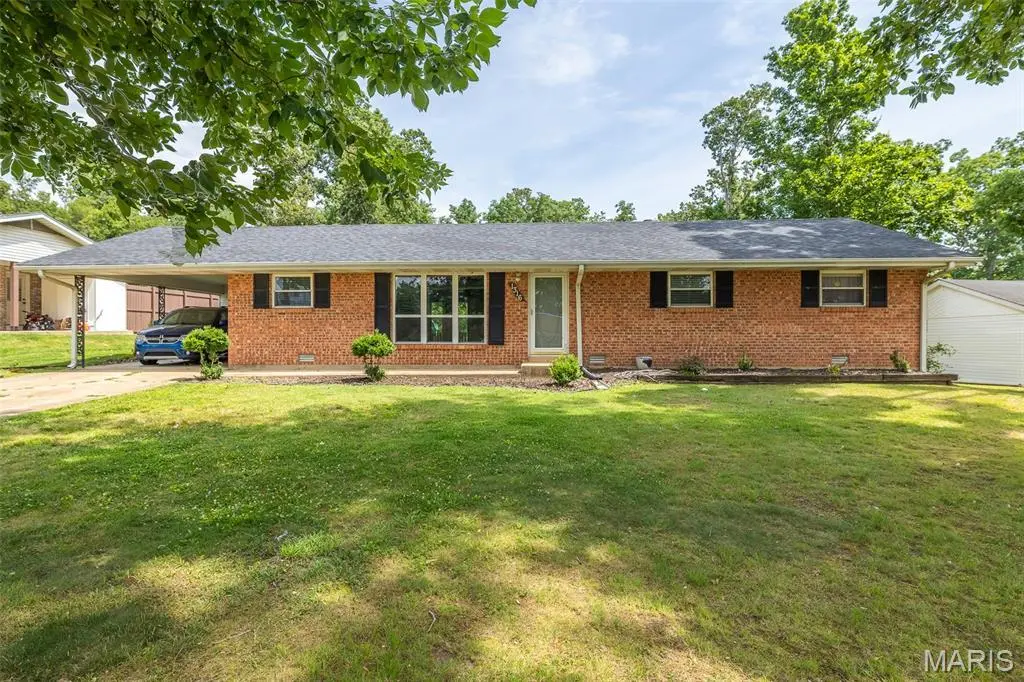
Welcome home to this charming 3-bedroom, 2-bath all-brick residence offering timeless appeal and outstanding curb appeal from the moment you arrive. Inside, you’ll find a comfortable and functional layout perfect for everyday living and entertaining. Step outside and enjoy the spacious covered back porch—an ideal spot for relaxing with your morning coffee, hosting family gatherings, or unwinding after a long day. The backyard provides plenty of space for outdoor activities, while the detached garage located at the rear of the property offers convenient parking, storage, or workshop potential. With its attractive brick exterior, inviting presence, and desirable outdoor amenities,
Key facts
- Spacious backyard
- Covered back porch
- Detached garage
Tags
Property features AI
Exterior
- Parking: 2 parking spaces total; 1-car garage; 1-car carport
- Utilities: Public water; Public sewer; Electricity connected (220 volts); Natural gas connected
- Home design: Single family residence; One level
- Construction: Brick construction
- Exterior features: Front yard; Back yard; Garage(s) on property
Interior
- Kitchen: Electric cooktop; Built-in electric oven; Range; Dishwasher; Refrigerator
- Bedrooms: 3 bedrooms (all on the main level)
- Bathrooms: 2 full bathrooms (on the main level)
- Interior features: Electric cooktop; Built-in electric oven; Range; Dishwasher; Refrigerator; Central air; Forced air heating; Natural gas heating
Neighborhood map
What this means for you Summary
Snapshot
- This is a 3-bed/2.0-bath other listed at $150k.
Deal economics
- At list price, monthly cash flow is $75 ($898/yr) — positive.
- The deal already cash-flows at list — no discount required.
- To meet the 1% rule (rent ≥ 1% of price), the offer needs to be $125k (16.6% below list).
- Recommended offer: $125k (16.6% below list) — sets the bar for 1% rule.
- Cap rate 6.9% vs local median 4.4% in Poplar Bluff — top-decile yield for the area; either an underpriced asset or a hidden risk that comps aren't pricing in. Stress-test before assuming the spread holds.
Location & tenants
- Location reads 70/100 on livability (#143 in MO) — a middle-class / working-renter tenant base. Strengths: crime A+, cost of living A+, housing A+; Watch: amenities F, commute F, employment F.
- Poplar Bluff R-I (town): math 38% / reading 47% proficiency, ranked #127 of 324 in MO (top 39%) — families likely to look elsewhere, expect single-tenant / working-renter base with shorter leases.
- Zoned schools: O'Neal Elem. (math 52% / reading 52%, grade C-, #231 of 1,115 statewide, top 24%, 325 students, 99% FRL); Poplar Bluff Middle School (math 36% / reading 39%, grade F, #215 of 391 statewide, top 56%, 1,018 students, 74% FRL); Poplar Bluff High (math 22% / reading 42%, grade F, #356 of 521 statewide, top 71%, 1,504 students, 56% FRL) — zoned schools average 76% FRL vs 56% district-wide (20 pts higher); higher-poverty schools than district average — tighter screening recommended.
- Market conditions: 277 active listings in the ZIP; 63 units permitted in Butler County in 2024 (48 in 5+ unit buildings).
Forward outlook
- Local home prices are declining (-3.0%/yr); year-one equity from $1k of loan paydown is wiped out by about $4k of value loss. Plan a longer hold.
- Butler County population projected to shrink 6% by 2050 — rents likely to lag national; underwrite the cash flow, not the appreciation.
Negotiation context
- Only 13 days on market — expect competitive offers; lowballing is unlikely to land.
Risks & watch-outs
- Climate carrying-cost: extreme-heat days projected 7→20/yr by 2055 (HVAC capex compounding) — expect insurance premiums to compound above CPI over the hold.
Questions for the listing agent
- Built in 1970 — when were the roof, HVAC, electrical panel, plumbing, and water heater last replaced?
- Is there a deadline driving the sale (1031 exchange, divorce, estate, relocation)? That informs how much negotiation room exists.
- The area grade is low — what's the realistic commute time and amenity access for the typical tenant pool here? Any planned neighborhood developments (good or bad) we should know about?
- What's the average days-on-market for RENTAL listings here right now (not sales)? A rising rental-DOM trend means longer vacancies and softer asking-rent achievability than the comps imply.
- What's the recent tenant-quality profile in this submarket — average credit score on applications, eviction rate, late-payment / NSF rate, and stable-employment percentage? A property-management company in the area should have these aggregated.
- How much new for-sale + rental construction is in the pipeline within 1–3 miles? Heavy new supply typically softens prices + rents 12–24 months out; constrained supply supports both.
Investment metrics
- 1% rule
- 0.83% ✗
- Cap rate
- 6.89%
- Cash-on-cash
- 2.14%
- DSCR
- 1.10
- GRM
- 10.0
CMA / ARV
No comps found within radius.
Projected returns pro-forma
-3.0% appreciation · 3.0% rent growth · sell at horizon
- IRR
- -13.0%
- Equity multiple
- 0.53×
- Total profit
- $-19,597
- Equity at exit
- $22,365
- IRR
- -4.0%
- Equity multiple
- 0.73×
- Total profit
- $-11,157
- Equity at exit
- $12,969
Cash invested: $42,000 (down + closing). Projections, not guarantees.
Landlord ↔ Tenant lean methodology
- Overall (STATE)
- 81 Strongly Landlord-Friendly
- State Missouri
- 81 Strongly Landlord-Friendly · R+10
- County
- — inherits STATE
- City
- — inherits STATE
ZIP-level market 63901
- Home prices YoY
- -22.4%
- Active inventory
- 277
- Price-to-rent
- 10.0×
Monthly cashflow live
- Estimated rent
- $1,252 medium interval (Pro) →
- Mortgage (P&I)
- −$787
- Tax from tax record
- −$65 /mo · $779/yr
- Insurance
- −$62
- HOA
- −$0
- Vacancy / Maint / Mgmt
- −$263
- Net cashflow
- $75
Break-even live
Sensitivity live
| Price | -10% $160 | -5% $117 | +0% $75 | +5% $32 | +10% $-10 |
|---|---|---|---|---|---|
| Rent | -10% $-24 | -5% $25 | +0% $75 | +5% $124 | +10% $174 |
| Rate | -1.0pp $150 | -0.5pp $113 | base $75 | +0.5pp $36 | +1.0pp $-4 |
UW: 25.0% down · 7.5% · 30yr · 1.5% tax · 5.0% vac · 8.0% maint · 8.0% mgmt
Financing live
Cash to close
- Down payment
- $37,500
- Closing costs
- $4,500
- Reserves months
- —
- Total cash needed
- —
Loan-product check · same deal, 3 products live
Conventional
25% down · 7.5% · 30yr
- Down + closing
- —
- Monthly P&I
- —
- Monthly cashflow
- —
- DSCR
- —
- Eligible?
- —
Personal DTI + credit; lowest rate.
DSCR
20% down · 8.5% · 30yr
- Down + closing
- —
- Monthly P&I
- —
- Monthly cashflow
- —
- DSCR
- —
- Eligible?
- —
No personal income docs; deal must DSCR.
Hard money
10% down · 12.0% · 12mo
- Down + closing
- —
- Monthly P&I
- —
- Monthly cashflow
- —
- DSCR
- —
- Eligible?
- —
Short-term bridge; refi at stabilization.
Listing history 10 events
-
2026-06-21days on market $150,000 Active 13 DOM
-
2026-06-21days on market $150,000 Active 12 DOM
-
2026-06-18days on market $150,000 Active 10 DOM
-
2026-06-17days on market $150,000 Active 9 DOM
-
2026-06-16days on market $150,000 Active 8 DOM
-
2026-06-15days on market $150,000 Active 7 DOM
-
2026-06-13days on market $150,000 Active 5 DOM
-
2026-06-12days on market $150,000 Active 4 DOM
-
2026-06-09remarks 687-char remark
-
2026-06-09$150,000 Active 1 DOM
ⓘ Source: listings_history table (triggers on properties + properties_extension) + one-shot
backfill from property_details.listing_events for pre-trigger history.
Tax reassessment forecast MO · Resets to sale price
- Current annual tax
- $779 · $65/mo
- Projected year-2 tax
- $1,455 · $121/mo
- Expected delta
- +$676/yr (+$56/mo · 86.8%)
ⓘ Screening estimate from a state-policy table — verify with the county assessor before closing.
Climate risk First Street
- Flood 1/10 Low FEMA zone X (unshaded) · 0% chance over 30 yrs
- Wildfire 3/10 Moderate
- Heat 5/10 Major 7 d/yr ≥108°F today · 20 d/yr by 30 yrs out
- Wind 3/10 Moderate 4% chance of damaging wind over 30 yrs
- Air quality 2/10 Low 0 unhealthy d/yr today · 2 by 30 yrs out
Nearby sold comps map
Loading sold comps map…
Walkable amenities ~0.75 mi
Loading nearby amenities…
Taxation est. · year 1
- Rental income
- $15,021
- − Mortgage interest
- −$8,402
- − Property taxes
- −$779
- − Insurance
- −$750
- − Repairs & maintenance
- −$1,202
- − Management
- −$1,202
- − Depreciation
- −$4,364
- Taxable loss
- −$1,678
- Est. tax savings @ 24.0%
- +$403
- After-tax cash flow
- $1,301/yr
For passive investors: Depreciation is non-cash, so a rental often shows a tax loss while cash-flowing — sheltering income. Rental losses are passive: they offset passive income freely, and up to $25,000/yr can offset ordinary (W-2) income if you actively participate and your MAGI is under $100k (phasing out to $0 by $150k); unused losses carry forward. On sale, claimed depreciation is recaptured at up to 25%, and gains may owe capital-gains tax (a 1031 exchange can defer both). Figures are a year-1 estimate at your 24.0% rate — not tax advice; consult a CPA.
Schools (NCES district)
- District
- Poplar Bluff R-I
- NCES district ID
- 2925450
- Math proficiency
- 38% ▼ -4.00%
- Reading proficiency
- 47% ▼ -3.00%
- Median HH income
- $35,761
- Composite
- 35.17/100
- National rank
- #5001
- State rank
- #127 of 324 in MO
Livability — Poplar Bluff
- Score
- 70/100
- State rank
- #143
- US rank
- #8135
Category grades
Schools grade is shown separately in the Schools card above.
Census & demographics
- Census place
- Poplar Bluff, MO
- City population
- 34,920
- Population (ZIP)
- 34,920
Population outlook (Butler County) Hauer SSP2
- Today (2025)
- 42,648 people
- By 2030
- 42,329 · -0.7%
- By 2040
- 41,498 · -2.7%
- By 2050
- 40,308 · -5.5%
- By 2075
- 36,168 · -15.2%
- By 2100
- 28,893 · -32.3%
Race, ethnicity, and origin ACS 2023
- Neighborhood character
- Predominantly White (85%)
- Race & ethnicity
- White 85% Two or more races 6% Black 5% Hispanic / Latino 2%
- Common ancestry
- Slovak 2% Lithuanian 1% Romanian 1%
- Foreign-born
- 1% · Canada
- Languages at home
- 98% English-only · Spanish 1%
Political lean MEDSL · Butler
- 2024 margin
- Solid R (+63.8) · D 17.7% · R 81.5%
- 2008→2024 swing
- -26.4pp toward R · 2008: -37.4pp · 2024: -63.8pp
- All cycles
- 2024: R+63.8 2020: R+62.3 2016: R+61.6 2012: R+46.7 2008: R+37.4
Not yet ingested
- Civics
- —
Market trends
- HPI YoY
- ▼ -50.64%
- Current HPI
- 175.3008
- Rent YoY
- —
- Metro
- —
- State GDP YoY
- ▲ 1.84%
- F500 in state
- 20
Industry mix (Fortune 500 HQ in MO)
| Industry | F500 HQs | Revenue |
|---|---|---|
| Healthcare | 1 | $163B |
|
||
| Insurance | 1 | $21B |
|
||
| Industrial Technology | 1 | $17B |
|
||
| Retail | 1 | $16B |
|
||
| Industrial Distribution | 1 | $10B |
|
||
| Utilities | 1 | $9B |
|
||
Price history
2 events — show timeline
- 2026-06-08 Listed $150,000 MARIS as Distributed by MLS Grid
- 2014-07-31 Sold (Public Records) — Public Records
Property tax history
+2.0%/yrLatest (2025): $779 · +4.6% YoY. Source: county tax records.
Cash-flow waterfall
monthlySold comps — $/sqft
last 12 mo · ≤1 miLoading sold comps…