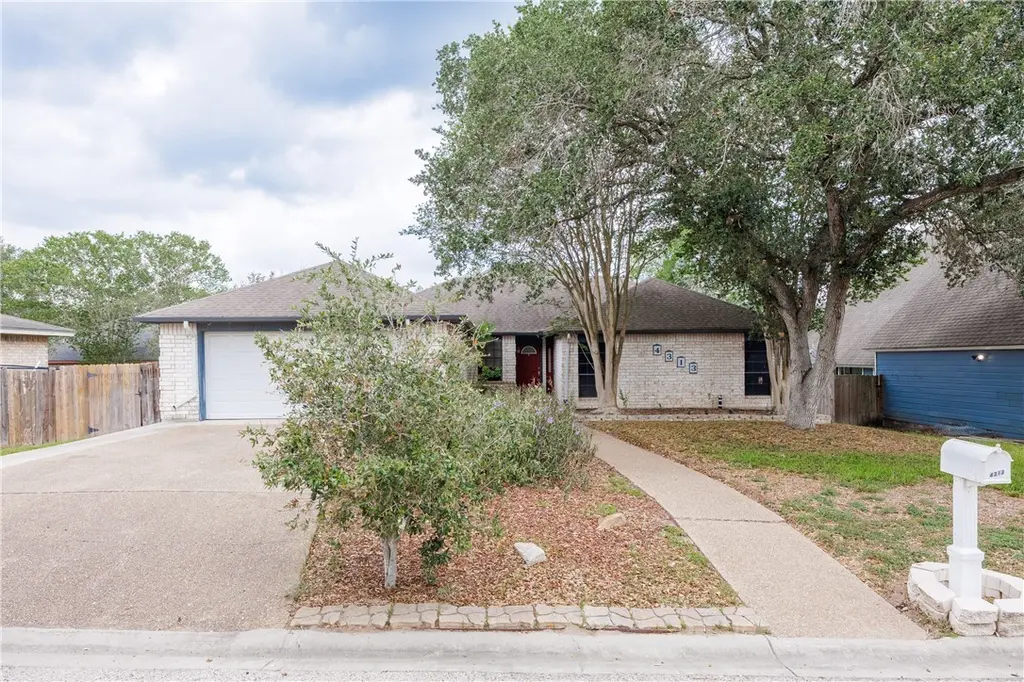
4313 Wolf Creek Ct · Corpus Christi, TX
Flood risk 1/10 · Minimal
- FEMA flood zone
- X (unshaded)
- Chance of flooding over 30 yrs
- 0.0%
- Est. flood insurance / yr
- $507 – $1,088
Fire risk 4/10 · Minor
- Est. fire insurance / yr
- $1,222 – $2,270
Heat risk 9/10 · Severe
- Hot days now (above 110°F)
- 7 days/yr
- Hot days in 30 yrs
- 23 days/yr
Wind risk 9/10 · Severe
- Chance of severe wind over 30 yrs
- 99.0%
Air-quality risk 1/10 · Minimal
- Unhealthy air days now
- 0 days/yr
- Unhealthy air days in 30 yrs
- 0 days/yr
Risk factors via First Street. Map © Google.
Why this score? — see what drove the D grade
The composite is a weighted blend of 9 inputs, each scored 0–100. Each bar is that input's sub-score; the figure is the points it added to the 100-point composite (weight × sub-score).
- ARV discount +10.5/15.0
- Cash flow +10.0/30.0
- Schools +3.9/10.0
- Livability +3.9/5.0
- 1% rule +3.6/10.0
- Rent growth +3.0/5.0
- DSCR +2.9/10.0
- Condition / age +2.5/5.0
- Appreciation +0.0/10.0
$275,000
🖨 Deal sheet 📄 Offer letter ✓ Due diligence
Listing remarks MLS
Lovely Wood River home has unique multi-level floor plan, 3 large bedrooms, 2 dining areas and a large living area. The home has fresh interior paint, pretty landscaping, and a nice size fenced back yard.
Key facts
- 7,701 sq ft lot
- 2 garage spots
- Built 1982
Property features AI
Finance
- HOA & community: Homeowners association with an annual fee of $500 covering common areas
Exterior
- Parking: Attached front-entry garage; 2 covered garage spaces
- Security: Smoke detector(s)
- Utilities: Public water; Public sewer
- Home design: Single-story; Shingle roof; Brick construction; Slab foundation
- Construction: Brick exterior; Shingle roof; Slab foundation; Built with one story
- Exterior features: Open patio; Wood fencing; Subdivided lot
Interior
- Kitchen: Dishwasher; Electric oven; Electric range; Free-standing range; Garbage disposal
- Flooring: Carpet; Vinyl
- Bathrooms: 2 full bathrooms
- Heating & cooling: Central heating (electric); Central air conditioning
- Interior features: Wood-burning fireplace; Smoke detector(s)
- Laundry & utility: Washer hookup; Dryer hookup
Neighborhood map
What this means for you Summary
Snapshot
- This is a 3-bed/2.0-bath single-family listed at $275k.
Deal economics
- At list price, monthly cash flow is $-165 ($-2k/yr) — negative.
- To cash-flow at today's rent, offer at most $246k (10.6% below list).
- To meet the 1% rule (rent ≥ 1% of price), the offer needs to be $238k (13.6% below list).
- Recommended offer: $238k (13.6% below list) — sets the bar for 1% rule.
- Cap rate 5.6% vs local median 3.6% in Corpus Christi — top-decile yield for the area; either an underpriced asset or a hidden risk that comps aren't pricing in. Stress-test before assuming the spread holds.
Location & tenants
- Location reads 78/100 on livability (#66 in TX, #2,404 nationally) — a middle-class / working-renter tenant base. Strengths: commute A+, cost of living A+, housing A+; Watch: crime F.
- Calallen ISD (urban): math 42% / reading 44% proficiency, ranked #249 of 826 in TX (top 30%) — families likely to look elsewhere, expect single-tenant / working-renter base with shorter leases.
- Market conditions: Rents rising (+2.0%/yr); 316 active listings in the ZIP; 3 comparable units currently listed for rent nearby; rentals at typical pace (median 14d on market — plan ~3-4 weeks tenant-placement turnaround); solid renter incomes; 1,397 units permitted in Nueces County in 2024 (47 in 5+ unit buildings).
- This rent runs 36% of the median local income ($79k/yr) — at the standard rent-burdened threshold; future hikes will face affordability resistance.
Forward outlook
- Local home prices are declining (-3.0%/yr); year-one equity from $2k of loan paydown is wiped out by about $8k of value loss. Plan a longer hold.
- Nueces County population projected at +36% by 2050 — long-run rental-demand tailwind backs the buy-and-hold thesis.
Negotiation context
- It's been on market 38 days — a 3% lower offer ($267k) is reasonable based on typical stale-listing flexibility.
- 7 sale attempts since 31y ago with the ask held roughly flat each time — persistent listings suggest the price (not the market) is what's stuck; bring a comps-based counter.
- Current owner paid $100k; list at $275k implies a 175% gain — meaningful room to come down on a strong offer.
Risks & watch-outs
- Climate carrying-cost: severe wind risk, 99% chance of damaging wind over 30y; extreme-heat days projected 7→23/yr by 2055 (HVAC capex compounding) — expect insurance premiums to compound above CPI over the hold.
Questions for the listing agent
- What do current leases actually rent for vs. the listed asking? Can we see a recent rent roll and the last 12 months of T-12 income?
- It's been on market 38 days. Have you received any prior offers? Is the seller open to a 14% concession, seller financing, or rate buy-down credit?
- What does the HOA fee cover, when was the last increase, and are there any pending special assessments or reserve-fund shortfalls?
- Is there a deadline driving the sale (1031 exchange, divorce, estate, relocation)? That informs how much negotiation room exists.
- Crime grade is F in this area — have there been break-ins, vandalism, or insurance claims at this property in the last 3 years? What carrier currently insures it and at what premium?
- The area grade is low — what's the realistic commute time and amenity access for the typical tenant pool here? Any planned neighborhood developments (good or bad) we should know about?
- What's the average days-on-market for RENTAL listings here right now (not sales)? A rising rental-DOM trend means longer vacancies and softer asking-rent achievability than the comps imply.
- What's the recent tenant-quality profile in this submarket — average credit score on applications, eviction rate, late-payment / NSF rate, and stable-employment percentage? A property-management company in the area should have these aggregated.
- How much new for-sale + rental construction is in the pipeline within 1–3 miles? Heavy new supply typically softens prices + rents 12–24 months out; constrained supply supports both.
Investment metrics
- 1% rule
- 0.86% ✗
- Cap rate
- 5.57%
- Cash-on-cash
- -2.57%
- DSCR
- 0.89
- GRM
- 9.6
CMA / ARV
- ARV (median comp)
- $294,801
- List price
- $275,000
- Delta
- -6.72%
- Verdict
- FAIR
- Comps
- 20 within 1.0 mi
Show comp detail 12 sales within ~0.75 mi
| Address | Dist | Beds/Ba | Sqft | Sold | Price | $/sf | Match |
|---|---|---|---|---|---|---|---|
| 15406 Big Cyprus | 0.40mi | 3/2.0 | 1,720 (-3%) | 0mo | $289,500 | $168 | 76 |
| 14905 Red River Dr | 0.17mi | 3/2.5 | 1,938 (+10%) | 2mo | $334,000 | $172 | 72 |
| 4401 Wood River Dr | 0.19mi | 3/2.0 | 1,957 (+11%) | 2mo | $319,000 | $163 | 72 |
| 4326 Clear Fork Ct | 0.06mi | 3/2.0 | 2,028 (+15%) | 2mo | $264,000 | $130 | 71 |
| 14929 Red River Dr | 0.20mi | 4/2.0 (+1) | 1,889 (+7%) | 4mo | $249,900 | $132 | 71 |
| 4318 Pecan Bayou Ct | 0.12mi | 4/2.0 (+1) | 1,965 (+11%) | 6mo | $275,000 | $140 | 66 |
| 4417 Ballad Tree Dr | 0.49mi | 4/2.0 (+1) | 1,703 (-4%) | 2mo | $274,500 | $161 | 64 |
| 4129 Wood River Dr | 0.29mi | 3/2.0 | 1,982 (+12%) | 3mo | $305,000 | $154 | 64 |
| 14729 Powell Dr | 0.37mi | 4/2.0 (+1) | 1,634 (-8%) | 1mo | $269,500 | $165 | 64 |
| 4125 Rapids Dr | 0.35mi | 3/3.0 | 1,913 (+8%) | 5mo | $215,000 | $112 | 62 |
| 15418 Big Cyprus | 0.42mi | 3/2.0 | 1,576 (-11%) | 5mo | $267,500 | $170 | 58 |
| 4146 Cross River Dr | 0.66mi | 3/2.0 | 1,953 (+10%) | 2mo | $342,000 | $175 | 50 |
Match score weights: distance 35% · size 25% · config 20% · recency 20%. Top-matched comps best support the ARV.
Projected returns pro-forma
-3.0% appreciation · 1.98% rent growth · sell at horizon
- IRR
- -21.8%
- Equity multiple
- 0.25×
- Total profit
- $-57,373
- Equity at exit
- $41,003
- IRR
- -18.3%
- Equity multiple
- 0.06×
- Total profit
- $-72,710
- Equity at exit
- $23,777
Cash invested: $77,000 (down + closing). Projections, not guarantees.
Landlord ↔ Tenant lean methodology
- Overall (STATE)
- 87 Strongly Landlord-Friendly
- State Texas
- 87 Strongly Landlord-Friendly · R+5
- County
- — inherits STATE
- City
- — inherits STATE
ZIP-level market 78410
- Rents YoY
- 2.0%
- Active inventory
- 316
- Price-to-rent
- 9.6×
Monthly cashflow live
- Estimated rent
- $2,375 medium interval (Pro) →
- Mortgage (P&I)
- −$1,442
- Tax from tax record
- −$443 /mo · $5,315/yr
- Insurance
- −$115
- HOA
- −$42
- Vacancy / Maint / Mgmt
- −$499
- Net cashflow
- $-165
Break-even live
UW: 25.0% down · 7.5% · 30yr · 1.5% tax · 5.0% vac · 8.0% maint · 8.0% mgmt
Financing live
Cash to close
- Down payment
- $68,750
- Closing costs
- $8,250
- Reserves months
- —
- Total cash needed
- —
Loan-product check · same deal, 3 products live
Conventional
25% down · 7.5% · 30yr
- Down + closing
- —
- Monthly P&I
- —
- Monthly cashflow
- —
- DSCR
- —
- Eligible?
- —
Personal DTI + credit; lowest rate.
DSCR
20% down · 8.5% · 30yr
- Down + closing
- —
- Monthly P&I
- —
- Monthly cashflow
- —
- DSCR
- —
- Eligible?
- —
No personal income docs; deal must DSCR.
Hard money
10% down · 12.0% · 12mo
- Down + closing
- —
- Monthly P&I
- —
- Monthly cashflow
- —
- DSCR
- —
- Eligible?
- —
Short-term bridge; refi at stabilization.
Rent comps 3 comps
| Address | Beds | Baths | Sqft | Rent | $/sqft | DOM | Units | Dist |
|---|---|---|---|---|---|---|---|---|
| 4510 Thoreau Cir Corpus Christi, TX | 3.0 | 2.5 | 2577 | $3,345 | $1.30 | 44d | 1 | 0.25mi |
| 4022 Wood River Dr Unit 2C Corpus Christi, TX | 2.0 | 2.0 | 1307 | $1,700 | $1.30 | 14d | 1 | 0.45mi |
| 4301 Catfish Dr Corpus Christi, TX | 3.0 | 2.0 | 1822 | $2,050 | $1.13 | 14d | 1 | 1.36mi |
HOA detail
- Monthly dues
- $42 · $504/yr
- Likely covers
- landscaping
Listing history 29 events
-
2026-06-18days on market $275,000 Active 38 DOM
-
2026-06-17days on market $275,000 Active 37 DOM
-
2026-06-16days on market $275,000 Active 36 DOM
-
2026-06-15days on market $275,000 Active 35 DOM
-
2026-06-14days on market $275,000 Active 33 DOM
-
2026-06-13days on market $275,000 Active 32 DOM
-
2026-06-10days on market $275,000 Active 30 DOM
-
2026-06-09days on market $275,000 Active 29 DOM
-
2026-06-08days on market $275,000 Active 28 DOM
-
2026-06-07days on market $275,000 Active 27 DOM
-
2026-06-03days on market $275,000 Active 23 DOM
-
2026-06-02days on market $275,000 Active 22 DOM
-
2026-06-01days on market $275,000 Active 21 DOM
-
2026-05-31days on market $275,000 Active 20 DOM
-
2026-05-30days on market $275,000 Active 19 DOM
-
2026-05-11$275,000 Active 673-char remark
-
2014-09-30soldstatus
-
2014-09-29soldstatus 204-char remark
Show marketing remark (204 chars)
Lovely Wood River home has unique multi-level floor plan, 3 large bedrooms, 2 dining areas and a large living area. The home has fresh interior paint, pretty landscaping, and a nice size fenced back yard.
-
2014-05-13$159,900 204-char remark
Show marketing remark (204 chars)
Lovely Wood River home has unique multi-level floor plan, 3 large bedrooms, 2 dining areas and a large living area. The home has fresh interior paint, pretty landscaping, and a nice size fenced back yard.
-
2011-08-30soldstatus
-
2011-07-27soldstatus
Show marketing remark (206 chars)
LOVELY, IMMACULATE , HOME NESTLED IN THE COMMUNITY OF WOOD RIVER SUBD ON QUIET CUL-DE-SAC READY TO MOVE INTO. CALALLEN SCHOOLS AND ACCESS TO ASSOCIATION AMENITIES; POOL, PLAYGROUND, GOLF & CLUBHOUSE.
-
2011-01-28$139,900
Show marketing remark (206 chars)
LOVELY, IMMACULATE , HOME NESTLED IN THE COMMUNITY OF WOOD RIVER SUBD ON QUIET CUL-DE-SAC READY TO MOVE INTO. CALALLEN SCHOOLS AND ACCESS TO ASSOCIATION AMENITIES; POOL, PLAYGROUND, GOLF & CLUBHOUSE.
-
2000-02-29soldstatus
-
2000-02-29soldstatus $100,000
-
2000-01-04$103,900
-
1999-01-23$115,500
-
1997-01-07$119,900
-
1995-08-18soldstatus
-
1995-05-02$109,900
ⓘ Source: listings_history table (triggers on properties + properties_extension) + one-shot
backfill from property_details.listing_events for pre-trigger history.
Tax reassessment forecast TX · Resets to sale price
- Current annual tax
- $5,315 · $443/mo
- Projected year-2 tax
- $5,315 · $443/mo
- Expected delta
- $0/yr ($0/mo · 0.0%)
ⓘ Screening estimate from a state-policy table — verify with the county assessor before closing.
Climate risk First Street
- Flood 1/10 Low FEMA zone X (unshaded) · 0% chance over 30 yrs
- Wildfire 4/10 Moderate
- Heat 9/10 Extreme 7 d/yr ≥110°F today · 23 d/yr by 30 yrs out
- Wind 9/10 Extreme 99% chance of damaging wind over 30 yrs
- Air quality 1/10 Low 0 unhealthy d/yr today · 0 by 30 yrs out
Nearby sold comps map
Loading sold comps map…
Walkable amenities ~0.75 mi
Loading nearby amenities…
Taxation est. · year 1
- Rental income
- $28,503
- − Mortgage interest
- −$15,404
- − Property taxes
- −$5,315
- − Insurance
- −$1,375
- − Repairs & maintenance
- −$2,280
- − Management
- −$2,280
- − HOA
- −$504
- − Depreciation
- −$8,000
- Taxable loss
- −$6,656
- Est. tax savings @ 24.0%
- +$1,597
- After-tax cash flow
- $-385/yr
For passive investors: Depreciation is non-cash, so a rental often shows a tax loss while cash-flowing — sheltering income. Rental losses are passive: they offset passive income freely, and up to $25,000/yr can offset ordinary (W-2) income if you actively participate and your MAGI is under $100k (phasing out to $0 by $150k); unused losses carry forward. On sale, claimed depreciation is recaptured at up to 25%, and gains may owe capital-gains tax (a 1031 exchange can defer both). Figures are a year-1 estimate at your 24.0% rate — not tax advice; consult a CPA.
Schools (NCES district)
- District
- Calallen ISD
- NCES district ID
- 4812420
- Math proficiency
- 42% ▼ -15.00%
- Reading proficiency
- 44% ▼ -9.00%
- Median HH income
- $73,780
- Composite
- 39.25/100
- National rank
- #4004
- State rank
- #249 of 826 in TX
Livability — Corpus Christi
- Score
- 78/100
- State rank
- #66
- US rank
- #2404
Category grades
Schools grade is shown separately in the Schools card above.
Census & demographics
- Census place
- Corpus Christi, TX
- County
- Nueces County · 296,836 people
- City population
- 296,836
- Metro
- Corpus Christi, TX
- Population (ZIP)
- 29,040
- Household income
- $79,308
- Rent vs Own
- Severe rent burden
- 324.0
Population outlook (Nueces County) Hauer SSP2
- Today (2025)
- 418,037 people
- By 2030
- 447,123 · +7.0%
- By 2040
- 505,911 · +21.0%
- By 2050
- 567,522 · +35.8%
- By 2075
- 729,686 · +74.6%
- By 2100
- 847,087 · +102.6%
Race, ethnicity, and origin ACS 2023
- Neighborhood character
- Majority Hispanic (59%)
- Race & ethnicity
- Hispanic / Latino 59% White 38% Two or more races 35% Black 1%
- Hispanic origin (detail)
- Mexican 54% Puerto Rican 2%
- Common ancestry
- Slovak 1% Lithuanian 1% Iranian 1%
- Foreign-born
- 6% · Canada
- Languages at home
- 71% English-only · Spanish 28%
Political lean MEDSL · Nueces
- 2024 margin
- R (+11.5) · D 43.8% · R 55.3%
- 2008→2024 swing
- -7.1pp toward R · 2008: -4.4pp · 2024: -11.5pp
- All cycles
- 2024: R+11.5 2020: R+2.9 2016: R+1.5 2012: R+3.2 2008: R+4.4
Not yet ingested
- Civics
- —
Market trends
- HPI YoY
- ▼ -145.45%
- Current HPI
- 174.0462
- Rent YoY
- ▲ 1.98%
- Metro
- Corpus Christi, TX
- State GDP YoY
- ▲ 3.95%
- F500 in state
- 110
Industry mix (Fortune 500 HQ in TX)
| Industry | F500 HQs | Revenue |
|---|---|---|
| Energy | 16 | $1,198B |
|
||
| Technology | 5 | $198B |
|
||
| Engineering / Construction | 4 | $72B |
|
||
| Energy Services | 3 | $60B |
|
||
| Utilities | 3 | $41B |
|
||
| Healthcare | 2 | $330B |
|
||
Price history
+150.2% since first listed14 events — show timeline
- 2026-05-11 Listed $275,000 CBMLS
- 2014-09-30 Sold (Public Records) — Public Records
- 2014-09-29 Sold (MLS) — CBMLS
- 2014-05-13 Listed $159,900 CBMLS
- 2011-08-30 Sold (Public Records) — Public Records
- 2011-07-27 Sold (MLS) — CBMLS
- 2011-01-28 Listed $139,900 CBMLS
- 2000-02-29 Sold (Public Records) $100,000 Public Records
- 2000-02-29 Sold (MLS) — CBMLS
- 2000-01-04 Listed $103,900 CBMLS
- 1999-01-23 Listed $115,500 CBMLS
- 1997-01-07 Listed $119,900 CBMLS
- 1995-08-18 Sold (MLS) — CBMLS
- 1995-05-02 Listed $109,900 CBMLS
Property tax history
+1.9%/yrLatest (2025): $5,315 · -3.7% YoY. Source: county tax records.
Cash-flow waterfall
monthlySold comps — $/sqft
last 12 mo · ≤1 miLoading sold comps…