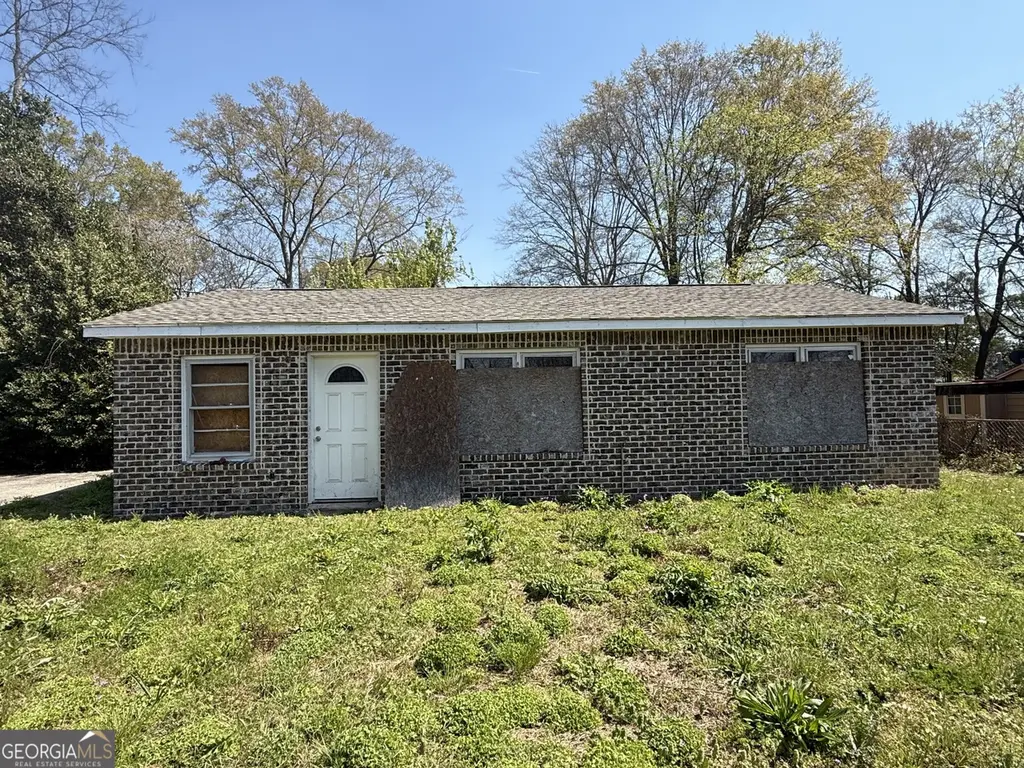
5760 Frederica Pl · Macon-Bibb County, GA
Flood risk 1/10 · Minimal
- FEMA flood zone
- X (unshaded)
- Chance of flooding over 30 yrs
- 0.0%
- Est. flood insurance / yr
- $507 – $1,088
Fire risk 3/10 · Minor
- Est. fire insurance / yr
- $963 – $1,789
Heat risk 7/10 · Major
- Hot days now (above 109°F)
- 7 days/yr
- Hot days in 30 yrs
- 18 days/yr
Wind risk 6/10 · Moderate
- Chance of severe wind over 30 yrs
- 66.0%
Air-quality risk 3/10 · Minor
- Unhealthy air days now
- 3 days/yr
- Unhealthy air days in 30 yrs
- 4 days/yr
Risk factors via First Street. Map © Google.
Why this score? — see what drove the C grade
The composite is a weighted blend of 9 inputs, each scored 0–100. Each bar is that input's sub-score; the figure is the points it added to the 100-point composite (weight × sub-score).
- Cash flow +30.0/30.0
- 1% rule +10.0/10.0
- DSCR +10.0/10.0
- Rent growth +3.8/5.0
- Livability +2.5/5.0
- Condition / age +2.5/5.0
- Schools +1.2/10.0
- ARV discount +0.0/15.0
- Appreciation +0.0/10.0
$70,000
🖨 Deal sheet 📄 Offer letter ✓ Due diligence
Listing remarks MLS
Feel like taking on something with tons of potential? Some of the challenging parts have already been done for you. New roofing, windows, built out, wired, just needs to be finished. Pictures are true to form so you can see exactly where it is in the rehab process. This is ready for the person willing to bring the vision together. This house is for someone who knows how to bring a house to life.
Key facts
- 8,276 sq ft lot
- Built 1959
- Listed 76 days
Neighborhood map
What this means for you Summary
Snapshot
- This is a 3-bed/1.0-bath single-family listed at $70k.
Deal economics
- At list price, monthly cash flow is $559 ($7k/yr) — positive.
- The deal already cash-flows at list — no discount required.
- Meets the 1% rule at list price ($1k rent vs $70k).
- Recommended offer: $66k (6.0% below list) — sets the bar for market timing.
- Cap rate 15.9% vs local median 5.4% in Macon-Bibb County — top-decile yield for the area; either an underpriced asset or a hidden risk that comps aren't pricing in. Stress-test before assuming the spread holds.
Location & tenants
- Location reads: area grade C — affects rentability + tenant quality, not the cash-flow math above.
- Bibb County (urban): math 11% / reading 18% proficiency, ranked #161 of 174 in GA (top 92%) — low school quality limits family demand, transient renter base, plan for 1-2y turnover; 75% free/reduced lunch — lower-income household profile, screen leases tightly.
- Market conditions: Rents rising fast (+5.0%/yr); 207 active listings in the ZIP; 17 comparable units currently listed for rent nearby; rentals lingering (median 44d on market — plan ~5-8 weeks vacancy on turnover, expect pricing pressure); 65% of comp listings sitting > 30 days — soft ceiling on asking rent; lower-income renter base — watch delinquency; 154 units permitted in Bibb County in 2024 (0 in 5+ unit buildings).
- At $1,231/mo this rent would consume 49% of the median local household income ($30k/yr) (locally 1335% of renters already pay >50% of income on rent) — very limited rent-growth headroom before tenants either downsize or default.
Forward outlook
- Local home prices are declining (-3.0%/yr); year-one equity from $484 of loan paydown is wiped out by about $2k of value loss. Plan a longer hold.
- Bibb County population projected at -12% by 2050 — secular population decline; favor cash flow + early exit over multi-decade hold.
- At projected returns (-3.0% appreciation + 5.0% rent growth), your $20k cash investment doubles in ~4 years — after that, you're playing with house money.
Negotiation context
- It's been on market 77 days — a 6% lower offer ($66k) is reasonable based on typical stale-listing flexibility.
- 3 sale attempts with the ask held roughly flat each time — persistent listings suggest the price (not the market) is what's stuck; bring a comps-based counter.
Risks & watch-outs
- Watch-outs: built in 1959 — expect roof / HVAC / electrical / plumbing capex.
- Climate carrying-cost: major wind risk, 66% chance of damaging wind over 30y; extreme-heat days projected 7→18/yr by 2055 (HVAC capex compounding) — expect insurance premiums to compound above CPI over the hold.
Questions for the listing agent
- It's been on market 77 days. Have you received any prior offers? Is the seller open to a 6% concession, seller financing, or rate buy-down credit?
- Built in 1959 — when were the roof, HVAC, electrical panel, plumbing, and water heater last replaced?
- Why hasn't it sold? Are there any deal-killer items the seller is aware of (foundation, flood, title, zoning, code violations)?
- Is there a deadline driving the sale (1031 exchange, divorce, estate, relocation)? That informs how much negotiation room exists.
- What's the average days-on-market for RENTAL listings here right now (not sales)? A rising rental-DOM trend means longer vacancies and softer asking-rent achievability than the comps imply.
- What's the recent tenant-quality profile in this submarket — average credit score on applications, eviction rate, late-payment / NSF rate, and stable-employment percentage? A property-management company in the area should have these aggregated.
- How much new for-sale + rental construction is in the pipeline within 1–3 miles? Heavy new supply typically softens prices + rents 12–24 months out; constrained supply supports both.
Investment metrics
- 1% rule
- 1.76% ✓
- Cap rate
- 15.87%
- Cash-on-cash
- 34.22%
- DSCR
- 2.52
- GRM
- 4.7
CMA / ARV
- ARV (median comp)
- $59,434
- List price
- $70,000
- Delta
- 17.78%
- Verdict
- OVERPRICED
- Comps
- 20 within 1.0 mi
Show comp detail 12 sales within ~0.75 mi
| Address | Dist | Beds/Ba | Sqft | Sold | Price | $/sf | Match |
|---|---|---|---|---|---|---|---|
| 5771 Satterfield Dr | 0.04mi | 3/1.0 | 888 (-3%) | 5mo | $65,000 | $73 | 89 |
| 5746 Sterling Pl | 0.11mi | 3/1.0 | 864 (-5%) | 5mo | $20,000 | $23 | 82 |
| 5756 Satterfield Dr | 0.05mi | 3/1.0 | 828 (-9%) | 3mo | $25,000 | $30 | 80 |
| 5711 Sterling Pl | 0.16mi | 3/2.0 | 864 (-5%) | 2mo | $120,000 | $139 | 78 |
| 5909 W Leone Dr | 0.37mi | 3/1.0 | 900 (-1%) | 4mo | $27,500 | $31 | 77 |
| 5770 Satterfield Dr | 0.06mi | 2/1.0 (-1) | 828 (-9%) | 5mo | $75,000 | $91 | 73 |
| 5756 Edwina Dr | 0.16mi | 3/1.5 | 1,000 (+10%) | 5mo | $132,000 | $132 | 70 |
| 2642 Reynolds Dr | 0.18mi | 3/1.5 | 986 (+8%) | 9mo | $130,000 | $132 | 69 |
| 2844 Shamrock Ln | 0.30mi | 3/1.0 | 1,000 (+10%) | 2mo | $47,000 | $47 | 68 |
| 2970 Emerson Cir | 0.70mi | 3/1.0 | 900 (-1%) | 1mo | $110,000 | $122 | 64 |
| 5885 Leone Dr W | 0.37mi | 3/1.0 | 1,000 (+10%) | 4mo | $35,000 | $35 | 64 |
| 2704 Reynolds Dr | 0.20mi | 3/1.0 | 1,036 (+14%) | 7mo | $70,000 | $68 | 62 |
Match score weights: distance 35% · size 25% · config 20% · recency 20%. Top-matched comps best support the ARV.
Projected returns pro-forma
-3.0% appreciation · 5.03% rent growth · sell at horizon
- IRR
- 31.7%
- Equity multiple
- 2.37×
- Total profit
- $26,795
- Equity at exit
- $10,437
- IRR
- 39.9%
- Equity multiple
- 5.08×
- Total profit
- $80,045
- Equity at exit
- $6,052
Cash invested: $19,600 (down + closing). Projections, not guarantees.
Landlord ↔ Tenant lean methodology
- Overall (STATE)
- 90 Strongly Landlord-Friendly
- State Georgia
- 90 Strongly Landlord-Friendly · R+3
- County
- — inherits STATE
- City
- — inherits STATE
ZIP-level market 31206
- Rents YoY
- 5.0%
- Active inventory
- 207
- Price-to-rent
- 4.7×
Monthly cashflow live
- Estimated rent
- $1,231 high interval (Pro) →
- Mortgage (P&I)
- −$367
- Tax from tax record
- −$18 /mo · $212/yr
- Insurance
- −$29
- HOA
- −$0
- Vacancy / Maint / Mgmt
- −$259
- Net cashflow
- $559
Break-even live
UW: 25.0% down · 7.5% · 30yr · 1.5% tax · 5.0% vac · 8.0% maint · 8.0% mgmt
Financing live
Cash to close
- Down payment
- $17,500
- Closing costs
- $2,100
- Reserves months
- —
- Total cash needed
- —
Loan-product check · same deal, 3 products live
Conventional
25% down · 7.5% · 30yr
- Down + closing
- —
- Monthly P&I
- —
- Monthly cashflow
- —
- DSCR
- —
- Eligible?
- —
Personal DTI + credit; lowest rate.
DSCR
20% down · 8.5% · 30yr
- Down + closing
- —
- Monthly P&I
- —
- Monthly cashflow
- —
- DSCR
- —
- Eligible?
- —
No personal income docs; deal must DSCR.
Hard money
10% down · 12.0% · 12mo
- Down + closing
- —
- Monthly P&I
- —
- Monthly cashflow
- —
- DSCR
- —
- Eligible?
- —
Short-term bridge; refi at stabilization.
Rent comps 17 comps
| Address | Beds | Baths | Sqft | Rent | $/sqft | DOM | Units | Dist |
|---|---|---|---|---|---|---|---|---|
| 5771 Satterfield Dr Macon, GA | 3.0 | 1.0 | 888 | $1,250 | $1.41 | 43d | 1 | 0.07mi |
| 2641 Leone Dr N Macon, GA | 3.0 | 1.0 | 864 | $1,100 | $1.27 | 43d | 1 | 0.09mi |
| 5711 Sterling Pl Macon, GA | 3.0 | 1.0 | 864 | $1,500 | $1.74 | 21d | 1 | 0.13mi |
| 2665 Chatsworth Ct Macon, GA | 3.0 | 1.5 | 1056 | $1,175 | $1.11 | 43d | 1 | 0.14mi |
| 5708 Edwina Dr Macon, GA | 3.0 | 1.0 | 925 | $1,275 | $1.38 | 43d | 1 | 0.15mi |
| 4386 Thrasher Cir Macon, GA | 3.0 | 2.0 | 1120 | $1,400 | $1.25 | 43d | 1 | 0.30mi |
| 4331 Ashland Dr Macon, GA | 3.0 | 1.0 | 864 | $1,025 | $1.19 | 43d | 1 | 0.35mi |
| 2961 Deeb Dr Macon, GA | 3.0 | 1.0 | 1000 | $1,000 | $1.00 | 43d | 1 | 0.39mi |
| 5487 Bloomfield Rd Macon, GA | 3.0 | 2.0 | 1050 | $1,200 | $1.14 | 21d | 1 | 0.42mi |
| 2477 Thrasher Ave Macon, GA | 3.0 | 1.0 | 960 | $825 | $0.86 | 13d | 1 | 0.47mi |
| 2459 Vivian Dr Macon, GA | 3.0 | 1.0 | 792 | $850 | $1.07 | 13d | 1 | 0.53mi |
| 2423 Thrasher Ave Macon, GA | 3.0 | 1.0 | 1056 | $725 | $0.69 | 43d | 1 | 0.60mi |
| 2427 Vivian Dr Macon, GA | 4.0 | 1.0 | 1056 | $1,150 | $1.09 | 43d | 1 | 0.62mi |
| 4278 Vinson Ave Macon, GA | 4.0 | 2.0 | 1104 | $1,550 | $1.40 | 21d | 1 | 0.67mi |
| 4069 Blair Ct Macon, GA | 3.0 | 1.0 | 864 | $850 | $0.98 | 43d | 1 | 0.96mi |
| 5161 Nisbet Dr Macon, GA | 2.0 | 1.5 | 1040 | $975 | $0.94 | 43d | 1 | 1.03mi |
| 4995 Bloomfield Rd Macon, GA | 2.0 | 1.5 | 900 | $997 | $1.11 | 21d | 1 | 1.36mi |
Listing history 19 events
-
2026-06-19days on market $70,000 Active 77 DOM
-
2026-06-18days on market $70,000 Active 76 DOM
-
2026-06-17days on market $70,000 Active 75 DOM
-
2026-06-16days on market $70,000 Active 74 DOM
-
2026-06-15days on market $70,000 Active 73 DOM
-
2026-06-14days on market $70,000 Active 71 DOM
-
2026-06-13days on market $70,000 Active 70 DOM
-
2026-06-10days on market $70,000 Active 68 DOM
-
2026-06-09days on market $70,000 Active 67 DOM
-
2026-06-09days on market $70,000 Active 66 DOM
-
2026-06-07days on market $70,000 Active 65 DOM
-
2026-06-03days on market $70,000 Active 61 DOM
-
2026-06-02days on market $70,000 Active 60 DOM
-
2026-06-01days on market $70,000 Active 59 DOM
-
2026-05-31days on market $70,000 Active 58 DOM
-
2026-05-30days on market $70,000 Active 57 DOM
-
2026-04-02$70,000 Active 398-char remark
Show marketing remark (398 chars)
Feel like taking on something with tons of potential? Some of the challenging parts have already been done for you. New roofing, windows, built out, wired, just needs to be finished. Pictures are true to form so you can see exactly where it is in the rehab process. This is ready for the person willing to bring the vision together. This house is for someone who knows how to bring a house to life.
-
2026-04-01$70,000 New
ⓘ Source: listings_history table (triggers on properties + properties_extension) + one-shot
backfill from property_details.listing_events for pre-trigger history.
Tax reassessment forecast GA · Resets to sale price
- Current annual tax
- $212 · $18/mo
- Projected year-2 tax
- $644 · $54/mo
- Expected delta
- +$432/yr (+$36/mo · 203.7%)
ⓘ Screening estimate from a state-policy table — verify with the county assessor before closing.
Climate risk First Street
- Flood 1/10 Low FEMA zone X (unshaded) · 0% chance over 30 yrs
- Wildfire 3/10 Moderate
- Heat 7/10 Severe 7 d/yr ≥109°F today · 18 d/yr by 30 yrs out
- Wind 6/10 Major 66% chance of damaging wind over 30 yrs
- Air quality 3/10 Moderate 3 unhealthy d/yr today · 4 by 30 yrs out
Nearby sold comps map
Loading sold comps map…
Walkable amenities ~0.75 mi
Loading nearby amenities…
Taxation est. · year 1
- Rental income
- $14,777
- − Mortgage interest
- −$3,921
- − Property taxes
- −$212
- − Insurance
- −$350
- − Repairs & maintenance
- −$1,182
- − Management
- −$1,182
- − Depreciation
- −$2,036
- Taxable income
- $5,893
- Est. tax owed @ 24.0%
- −$1,414
- After-tax cash flow
- $5,292/yr
For passive investors: Depreciation is non-cash, so a rental often shows a tax loss while cash-flowing — sheltering income. Rental losses are passive: they offset passive income freely, and up to $25,000/yr can offset ordinary (W-2) income if you actively participate and your MAGI is under $100k (phasing out to $0 by $150k); unused losses carry forward. On sale, claimed depreciation is recaptured at up to 25%, and gains may owe capital-gains tax (a 1031 exchange can defer both). Figures are a year-1 estimate at your 24.0% rate — not tax advice; consult a CPA.
Schools (NCES district)
- District
- Bibb County
- NCES district ID
- 1300420
- Math proficiency
- 11% ▼ -14.00%
- Reading proficiency
- 18% ▼ -11.00%
- Median HH income
- $37,426
- Composite
- 12.13/100
- National rank
- #9654
- State rank
- #161 of 174 in GA
Livability — Macon-Bibb County
No livability data for this city. (Only ~50 U.S. cities are tracked.)
Census & demographics
- Census place
- Macon-Bibb County, GA
- County
- Bibb County · 164,332 people
- City population
- 143,186
- Metro
- Macon-Bibb County, GA
- Population (ZIP)
- 24,310
- Household income
- $30,042
- Rent vs Own
- Severe rent burden
- 1335.0
Population outlook (Bibb County) Hauer SSP2
- Today (2025)
- 148,772 people
- By 2030
- 145,904 · -1.9%
- By 2040
- 139,404 · -6.3%
- By 2050
- 131,603 · -11.5%
- By 2075
- 111,050 · -25.4%
- By 2100
- 83,346 · -44.0%
Race, ethnicity, and origin ACS 2023
- Neighborhood character
- Predominantly Black (76%)
- Race & ethnicity
- Black 76% White 12% Hispanic / Latino 8% Two or more races 4%
- Hispanic origin (detail)
- Mexican 5% Puerto Rican 1%
- Common ancestry
- Lithuanian 1% Italian 1%
- Foreign-born
- 4% · Canada
- Languages at home
- 91% English-only · Spanish 8%
Political lean MEDSL · Bibb
- 2024 margin
- Strong D (+22.4) · D 61.0% · R 38.5%
- 2008→2024 swing
- +4.4pp toward D · 2008: 18.0pp · 2024: 22.4pp
- All cycles
- 2024: D+22.4 2020: D+23.8 2016: D+20.2 2012: D+20.0 2008: D+18.0
Not yet ingested
- Civics
- —
Market trends
- HPI YoY
- ▼ -80.17%
- Current HPI
- 148.6765
- Rent YoY
- ▲ 5.03%
- Metro
- Macon-Bibb County, GA
- State GDP YoY
- ▲ 2.66%
- F500 in state
- 28
Industry mix (Fortune 500 HQ in GA)
| Industry | F500 HQs | Revenue |
|---|---|---|
| Paper / Packaging | 2 | $29B |
|
||
| Retail | 1 | $160B |
|
||
| Transportation / Logistics | 1 | $91B |
|
||
| Airlines | 1 | $62B |
|
||
| Consumer Goods | 1 | $47B |
|
||
| Utilities | 1 | $25B |
|
||
Price history
+0.0% since first listed3 events — show timeline
- 2026-04-02 Listed $70,000 CGMLS
- 2026-04-02 Listed $70,000 MGMLS
- 2026-04-01 Listed $70,000 GAMLS
Property tax history
+7.0%/yrLatest (2025): $212 · -1.3% YoY. Source: county tax records.
Cash-flow waterfall
monthlySold comps — $/sqft
last 12 mo · ≤1 miLoading sold comps…