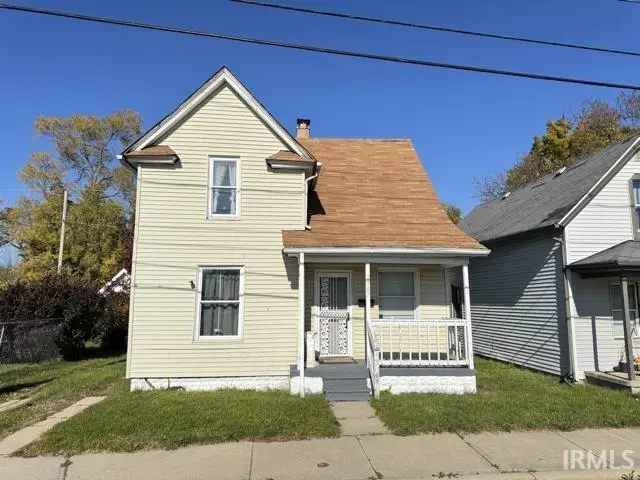
2307 Linden Ave · South Bend, IN
Flood risk 1/10 · Minimal
- FEMA flood zone
- X (unshaded)
- Chance of flooding over 30 yrs
- 0.0%
- Est. flood insurance / yr
- $473 – $860
Fire risk 1/10 · Minimal
- Est. fire insurance / yr
- $717 – $1,331
Heat risk 3/10 · Minor
- Hot days now (above 99°F)
- 7 days/yr
- Hot days in 30 yrs
- 16 days/yr
Wind risk 2/10 · Minimal
- Chance of severe wind over 30 yrs
- —
Air-quality risk 3/10 · Minor
- Unhealthy air days now
- 3 days/yr
- Unhealthy air days in 30 yrs
- 3 days/yr
Risk factors via First Street. Map © Google.
Why this score? — see what drove the C+ grade
The composite is a weighted blend of 9 inputs, each scored 0–100. Each bar is that input's sub-score; the figure is the points it added to the 100-point composite (weight × sub-score).
- Cash flow +30.0/30.0
- 1% rule +10.0/10.0
- DSCR +10.0/10.0
- Rent growth +4.2/5.0
- Livability +3.2/5.0
- Condition / age +2.5/5.0
- Schools +1.4/10.0
- ARV discount +0.9/15.0
- Appreciation +0.0/10.0
$80,000
🖨 Deal sheet 📄 Offer letter ✓ Due diligence
Listing remarks MLS
Welcome home to this charming property at 2307 Linden Ave! Conveniently located in the heart of South Bend, this home offers easy access to shopping, dining, and local amenities. Featuring four generously sized bedrooms and a main-floor bathroom, the layout provides both comfort and functionality. With minor updates, this home presents a great opportunity to personalize and make it your own. The spacious backyard is ideal for entertaining, outdoor activities, or simply relaxing. Don’t miss this great opportunity with plenty of potential!
Key facts
- Spacious backyard
- Local amenities
- 3,485 sq ft lot
Tags
Neighborhood map
What this means for you Summary
Snapshot
- This is a 4-bed/1.0-bath single-family listed at $80k.
Deal economics
- At list price, monthly cash flow is $650 ($8k/yr) — positive.
- The deal already cash-flows at list — no discount required.
- Meets the 1% rule at list price ($1k rent vs $80k).
- Recommended offer: $70k (12.0% below list) — sets the bar for market timing.
- Cap rate 16.0% vs local median 4.4% in South Bend — top-decile yield for the area; either an underpriced asset or a hidden risk that comps aren't pricing in. Stress-test before assuming the spread holds.
Location & tenants
- Location reads 64/100 on livability (#365 in IN) — a middle-class / working-renter tenant base. Strengths: cost of living A+, housing A+, health & safety A+; Watch: amenities D, employment D, schools F.
- South Bend Community School Corporation (urban): math 12% / reading 21% proficiency, ranked #284 of 301 in IN (top 94%) — low school quality limits family demand, transient renter base, plan for 1-2y turnover; 66% free/reduced lunch — lower-income household profile, screen leases tightly.
- Market conditions: Rents rising fast (+6.8%/yr); 424 active listings in the ZIP; 25 comparable units currently listed for rent nearby; rentals at typical pace (median 22d on market — plan ~3-4 weeks tenant-placement turnaround); 754 units permitted in St. Joseph County in 2024 (460 in 5+ unit buildings).
Forward outlook
- Local home prices are declining (-3.0%/yr); year-one equity from $553 of loan paydown is wiped out by about $2k of value loss. Plan a longer hold.
- At projected returns (-3.0% appreciation + 6.8% rent growth), your $22k cash investment doubles in ~4 years — after that, you're playing with house money.
Negotiation context
- It's been on market 129 days — a 12% lower offer ($70k) is reasonable based on typical stale-listing flexibility.
- 3 sale attempts with the ask held roughly flat each time — persistent listings suggest the price (not the market) is what's stuck; bring a comps-based counter.
Risks & watch-outs
- Watch-outs: built in 1897 — expect roof / HVAC / electrical / plumbing capex.
Questions for the listing agent
- It's been on market 129 days. Have you received any prior offers? Is the seller open to a 12% concession, seller financing, or rate buy-down credit?
- Built in 1897 — when were the roof, HVAC, electrical panel, plumbing, and water heater last replaced?
- Why hasn't it sold? Are there any deal-killer items the seller is aware of (foundation, flood, title, zoning, code violations)?
- Is there a deadline driving the sale (1031 exchange, divorce, estate, relocation)? That informs how much negotiation room exists.
- Schools are F-rated, which usually means shorter tenancies and higher turnover. Who's the typical renter profile here, and what's been the actual vacancy rate?
- Crime grade is F in this area — have there been break-ins, vandalism, or insurance claims at this property in the last 3 years? What carrier currently insures it and at what premium?
- What's the average days-on-market for RENTAL listings here right now (not sales)? A rising rental-DOM trend means longer vacancies and softer asking-rent achievability than the comps imply.
- What's the recent tenant-quality profile in this submarket — average credit score on applications, eviction rate, late-payment / NSF rate, and stable-employment percentage? A property-management company in the area should have these aggregated.
- How much new for-sale + rental construction is in the pipeline within 1–3 miles? Heavy new supply typically softens prices + rents 12–24 months out; constrained supply supports both.
Investment metrics
- 1% rule
- 1.82% ✓
- Cap rate
- 16.04%
- Cash-on-cash
- 34.80%
- DSCR
- 2.55
- GRM
- 4.6
CMA / ARV
- ARV (median comp)
- $69,716
- List price
- $80,000
- Delta
- 14.75%
- Verdict
- OVERPRICED
- Comps
- 20 within 1.0 mi
Show comp detail 12 sales within ~0.75 mi
| Address | Dist | Beds/Ba | Sqft | Sold | Price | $/sf | Match |
|---|---|---|---|---|---|---|---|
| 201 College St | 0.33mi | 4/1.5 | 1,541 (+3%) | 5mo | $169,900 | $110 | 74 |
| 2510 Fredrickson St | 0.44mi | 3/1.0 (-1) | 1,540 (+3%) | 1mo | $76,000 | $49 | 69 |
| 2205 Kenwood Ave | 0.10mi | 4/2.5 | 1,700 (+13%) | 2mo | $49,000 | $29 | 66 |
| 2205 Fredrickson St | 0.42mi | 3/2.0 (-1) | 1,548 (+3%) | 5mo | $105,000 | $68 | 62 |
| 106 N Adams St | 0.44mi | 4/1.5 | 1,620 (+8%) | 5mo | $60,000 | $37 | 60 |
| 121 S Meade St | 0.37mi | 3/1.5 (-1) | 1,664 (+11%) | 1mo | $167,500 | $101 | 57 |
| 525 Carlisle St | 0.70mi | 3/1.0 (-1) | 1,526 (+2%) | 4mo | $153,000 | $100 | 56 |
| 1052 Obrien St | 0.67mi | 3/1.0 (-1) | 1,625 (+8%) | 6mo | $70,000 | $43 | 44 |
| 1054 Huey St | 0.67mi | 4/1.5 | 1,288 (-14%) | 2mo | $85,251 | $66 | 41 |
| 644 N Walnut Ave | 0.71mi | 4/1.0 | 1,284 (-14%) | 4mo | $38,000 | $30 | 39 |
| 429 S Albert St | 0.72mi | 3/1.0 (-1) | 1,682 (+12%) | 5mo | $155,000 | $92 | 37 |
| 1115 Johnson St | 0.73mi | 3/1.0 (-1) | 1,300 (-13%) | 4mo | $88,000 | $68 | 35 |
Match score weights: distance 35% · size 25% · config 20% · recency 20%. Top-matched comps best support the ARV.
Projected returns pro-forma
-3.0% appreciation · 6.78% rent growth · sell at horizon
- IRR
- 34.3%
- Equity multiple
- 2.52×
- Total profit
- $34,149
- Equity at exit
- $11,928
- IRR
- 43.1%
- Equity multiple
- 5.84×
- Total profit
- $108,465
- Equity at exit
- $6,917
Cash invested: $22,400 (down + closing). Projections, not guarantees.
Landlord ↔ Tenant lean methodology
- Overall (STATE)
- 90 Strongly Landlord-Friendly
- State Indiana
- 90 Strongly Landlord-Friendly · R+11
- County
- — inherits STATE
- City
- — inherits STATE
ZIP-level market 46628
- Rents YoY
- 6.8%
- Active inventory
- 424
- Price-to-rent
- 4.6×
Monthly cashflow live
- Estimated rent
- $1,456 high interval (Pro) →
- Mortgage (P&I)
- −$420
- Tax from tax record
- −$47 /mo · $569/yr
- Insurance
- −$33
- HOA
- −$0
- Vacancy / Maint / Mgmt
- −$306
- Net cashflow
- $650
Break-even live
UW: 25.0% down · 7.5% · 30yr · 1.5% tax · 5.0% vac · 8.0% maint · 8.0% mgmt
Financing live
Cash to close
- Down payment
- $20,000
- Closing costs
- $2,400
- Reserves months
- —
- Total cash needed
- —
Loan-product check · same deal, 3 products live
Conventional
25% down · 7.5% · 30yr
- Down + closing
- —
- Monthly P&I
- —
- Monthly cashflow
- —
- DSCR
- —
- Eligible?
- —
Personal DTI + credit; lowest rate.
DSCR
20% down · 8.5% · 30yr
- Down + closing
- —
- Monthly P&I
- —
- Monthly cashflow
- —
- DSCR
- —
- Eligible?
- —
No personal income docs; deal must DSCR.
Hard money
10% down · 12.0% · 12mo
- Down + closing
- —
- Monthly P&I
- —
- Monthly cashflow
- —
- DSCR
- —
- Eligible?
- —
Short-term bridge; refi at stabilization.
Rent comps 25 comps
| Address | Beds | Baths | Sqft | Rent | $/sqft | DOM | Units | Dist |
|---|---|---|---|---|---|---|---|---|
| 2203 Smith St South Bend, IN | 3.0 | 1.0 | 1248 | $1,215 | $0.97 | 14d | 1 | 0.08mi |
| 2010 Lincoln Way W Unit 2 South Bend, IN | 3.0 | 1.0 | 1150 | $1,325 | $1.15 | 21d | 1 | 0.55mi |
| 2530 Bonds Ave South Bend, IN | 5.0 | 1.5 | 1866 | $2,000 | $1.07 | 44d | 1 | 0.61mi |
| 1008 O Brien St Unit O South Bend, IN | 3.0 | 1.0 | 1634 | $800 | $0.49 | 21d | 1 | 0.61mi |
| 2205 Lincoln Way W South Bend, IN | 4.0 | 2.0 | 1440 | $1,565 | $1.09 | 14d | 1 | 0.62mi |
| 1054 Huey St South Bend, IN | 4.0 | 2.0 | 1288 | $1,550 | $1.20 | 14d | 1 | 0.70mi |
| 736 Lawndale Ave Unit 1 South Bend, IN | 3.0 | 1.0 | 1072 | $1,200 | $1.12 | 14d | 1 | 0.71mi |
| 2502 Ford St South Bend, IN | 3.0 | 1.0 | 1176 | $1,175 | $1.00 | 44d | 1 | 0.76mi |
| 752 Diamond Ave South Bend, IN | 3.0 | 1.5 | 1248 | $1,400 | $1.12 | 44d | 1 | 0.79mi |
| 1206 Johnson St South Bend, IN | 3.0 | 1.5 | 1320 | $1,400 | $1.06 | 44d | 1 | 0.85mi |
| 1210 Johnson St South Bend, IN | 3.0 | 2.0 | 1568 | $1,250 | $0.80 | 21d | 1 | 0.86mi |
| 1118 Van Buren St South Bend, IN | 3.0 | 1.0 | 1394 | $1,375 | $0.99 | 21d | 1 | 0.91mi |
| 910 Allen St South Bend, IN | 3.0 | 1.0 | 1100 | $1,350 | $1.23 | 21d | 1 | 1.01mi |
| 1317 Poland St South Bend, IN | 3.0 | 1.0 | 1100 | $1,300 | $1.18 | 21d | 1 | 1.01mi |
| 1032 Allen St South Bend, IN | 3.0 | 2.0 | 1580 | $1,200 | $0.76 | 44d | 1 | 1.07mi |
| 1505 N Adams St South Bend, IN | 3.0 | 1.0 | 1200 | $1,350 | $1.12 | 14d | 1 | 1.15mi |
| 1243 Portage Ave South Bend, IN | 3.0 | 1.0 | 1570 | $1,500 | $0.96 | 44d | 1 | 1.17mi |
| 609 N Scott St South Bend, IN | 5.0 | 1.5 | 1951 | $1,450 | $0.74 | 44d | 1 | 1.17mi |
| 1630 Obrien St South Bend, IN | 3.0 | 1.0 | 1120 | $1,400 | $1.25 | 14d | 1 | 1.22mi |
| 1642 Johnson St South Bend, IN | 3.0 | 1.0 | 1375 | $1,400 | $1.02 | 14d | 1 | 1.25mi |
| 164 S Gladstone Ave South Bend, IN | 4.0 | 1.0 | 1440 | $1,365 | $0.95 | 44d | 1 | 1.28mi |
| 504 W Navarre St South Bend, IN | 3.0 | 1.5 | 1520 | $1,350 | $0.89 | 14d | 1 | 1.31mi |
| 221 S Taylor St South Bend, IN | 3.0 | 2.0 | 1178 | $2,599 | $2.21 | 14d | 1 | 1.32mi |
| 1214 Queen St South Bend, IN | 3.0 | 1.0 | 1056 | $1,300 | $1.23 | 14d | 1 | 1.38mi |
| 513 S Edison Ave South Bend, IN | 3.0 | 1.0 | 1152 | $1,195 | $1.04 | 21d | 1 | 1.40mi |
Listing history 21 events
-
2026-06-18days on market $80,000 Active 129 DOM
-
2026-06-17days on market $80,000 Active 128 DOM
-
2026-06-16days on market $80,000 Active 127 DOM
-
2026-06-15days on market $80,000 Active 126 DOM
-
2026-06-14days on market $80,000 Active 124 DOM
-
2026-06-13days on market $80,000 Active 123 DOM
-
2026-06-10days on market $80,000 Active 121 DOM
-
2026-06-09days on market $80,000 Active 120 DOM
-
2026-06-08days on market $80,000 Active 119 DOM
-
2026-06-07days on market $80,000 Active 118 DOM
-
2026-06-03days on market $80,000 Active 114 DOM
-
2026-06-02days on market $80,000 Active 113 DOM
-
2026-06-01days on market $80,000 Active 112 DOM
-
2026-05-31days on market $80,000 Active 111 DOM
-
2026-01-14$80,000 Active 549-char remark
Show marketing remark (549 chars)
Welcome home to this charming property at 2307 Linden Ave! Conveniently located in the heart of South Bend, this home offers easy access to shopping, dining, and local amenities. Featuring four generously sized bedrooms and a main-floor bathroom, the layout provides both comfort and functionality. With minor updates, this home presents a great opportunity to personalize and make it your own. The spacious backyard is ideal for entertaining, outdoor activities, or simply relaxing. Don’t miss this great opportunity with plenty of potential!
-
2025-12-09status Active
-
2025-11-14status Pending
-
2025-11-08price $85,000
-
2025-09-30price $99,000
-
2025-06-28price $115,000
-
2025-06-21$125,000 Active
ⓘ Source: listings_history table (triggers on properties + properties_extension) + one-shot
backfill from property_details.listing_events for pre-trigger history.
Tax reassessment forecast IN · Partial reset (capped growth)
- Current annual tax
- $569 · $47/mo
- Projected year-2 tax
- $625 · $52/mo
- Expected delta
- +$55/yr (+$5/mo · 9.7%)
ⓘ Screening estimate from a state-policy table — verify with the county assessor before closing.
Climate risk First Street
- Flood 1/10 Low FEMA zone X (unshaded) · 0% chance over 30 yrs
- Wildfire 1/10 Low
- Heat 3/10 Moderate 7 d/yr ≥99°F today · 16 d/yr by 30 yrs out
- Wind 2/10 Low
- Air quality 3/10 Moderate 3 unhealthy d/yr today · 3 by 30 yrs out
Nearby sold comps map
Loading sold comps map…
Walkable amenities ~0.75 mi
Loading nearby amenities…
Taxation est. · year 1
- Rental income
- $17,468
- − Mortgage interest
- −$4,481
- − Property taxes
- −$569
- − Insurance
- −$400
- − Repairs & maintenance
- −$1,397
- − Management
- −$1,397
- − Depreciation
- −$2,327
- Taxable income
- $6,895
- Est. tax owed @ 24.0%
- −$1,655
- After-tax cash flow
- $6,141/yr
For passive investors: Depreciation is non-cash, so a rental often shows a tax loss while cash-flowing — sheltering income. Rental losses are passive: they offset passive income freely, and up to $25,000/yr can offset ordinary (W-2) income if you actively participate and your MAGI is under $100k (phasing out to $0 by $150k); unused losses carry forward. On sale, claimed depreciation is recaptured at up to 25%, and gains may owe capital-gains tax (a 1031 exchange can defer both). Figures are a year-1 estimate at your 24.0% rate — not tax advice; consult a CPA.
Schools (NCES district)
- District
- South Bend Community School Corporation
- NCES district ID
- 1810290
- Math proficiency
- 12% ▼ -10.00%
- Reading proficiency
- 21% ▼ -6.00%
- Median HH income
- $41,935
- Composite
- 14.21/100
- National rank
- #9452
- State rank
- #284 of 301 in IN
Livability — South Bend
- Score
- 64/100
- State rank
- #365
- US rank
- #13730
Category grades
Schools grade is shown separately in the Schools card above.
Census & demographics
- Census place
- South Bend, IN
- County
- Saint Joseph County · 189,048 people
- City population
- 99,767
- Metro
- South Bend-Mishawaka, IN-MI
- Population (ZIP)
- 27,685
- Household income
- $61,759
- Rent vs Own
- Severe rent burden
- 1024.0
Population outlook (St. Joseph County) Hauer SSP2
- Today (2025)
- 273,186 people
- By 2030
- 273,594 · +0.1%
- By 2040
- 271,641 · -0.6%
- By 2050
- 269,187 · -1.5%
- By 2075
- 263,136 · -3.7%
- By 2100
- 245,659 · -10.1%
Race, ethnicity, and origin ACS 2023
- Neighborhood character
- Diverse neighborhood (Simpson 0.60)
- Race & ethnicity
- White 55% Black 30% Hispanic / Latino 10% Two or more races 8%
- Hispanic origin (detail)
- Mexican 8%
- Common ancestry
- Romanian 12% Lithuanian 1% Slovak 1%
- Foreign-born
- 7% · Canada, China
- Languages at home
- 89% English-only · Spanish 7% Russian/Polish/Slavic 1%
Political lean MEDSL · St. Joseph
- 2024 margin
- Toss-up / Even · D 50.0% · R 48.5% · Other 1.5%
- 2008→2024 swing
- -15.6pp toward R · 2008: 17.1pp · 2024: 1.5pp
- All cycles
- 2024: D+1.5 2020: D+5.8 2016: D+0.2 2012: D+3.5 2008: D+17.1
Not yet ingested
- Civics
- —
Market trends
- HPI YoY
- ▼ -130.47%
- Current HPI
- 202.112
- Rent YoY
- ▲ 6.78%
- Metro
- South Bend-Mishawaka, IN-MI
- State GDP YoY
- ▲ 2.90%
- F500 in state
- 18
Industry mix (Fortune 500 HQ in IN)
| Industry | F500 HQs | Revenue |
|---|---|---|
| Industrial Machinery | 2 | $37B |
|
||
| Healthcare | 1 | $177B |
|
||
| Pharmaceuticals | 1 | $45B |
|
||
| Metals / Steel | 1 | $18B |
|
||
| Agriculture | 1 | $17B |
|
||
| Packaging | 1 | $12B |
|
||
Price history
-36.0% since first listed7 events — show timeline
- 2026-01-14 Listed $80,000 IRMLS
- 2025-12-09 Relisted — IRMLS
- 2025-11-14 Pending — IRMLS
- 2025-11-08 Price Changed $85,000 IRMLS
- 2025-09-30 Price Changed $99,000 IRMLS
- 2025-06-28 Price Changed $115,000 IRMLS
- 2025-06-21 Listed $125,000 IRMLS
Property tax history
+7.2%/yrLatest (2023): $569 · +8.3% YoY. Source: county tax records.
Cash-flow waterfall
monthlySold comps — $/sqft
last 12 mo · ≤1 miLoading sold comps…