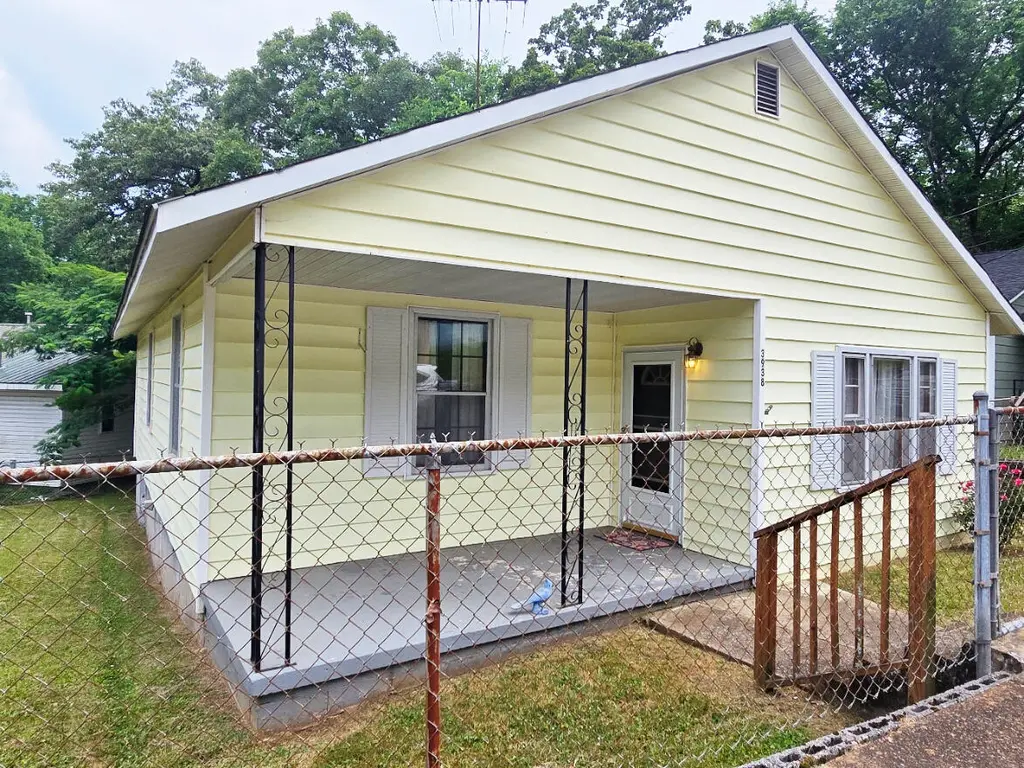
3938 Arkwright St · Chattanooga, TN
Flood risk 9/10 · Severe
- FEMA flood zone
- X (unshaded)
- Chance of flooding over 30 yrs
- 0.99%
- Est. flood insurance / yr
- $507 – $1,088
Fire risk 3/10 · Minor
- Est. fire insurance / yr
- $949 – $1,763
Heat risk 6/10 · Moderate
- Hot days now (above 105°F)
- 7 days/yr
- Hot days in 30 yrs
- 20 days/yr
Wind risk 4/10 · Minor
- Chance of severe wind over 30 yrs
- 9.0%
Air-quality risk 4/10 · Minor
- Unhealthy air days now
- 3 days/yr
- Unhealthy air days in 30 yrs
- 4 days/yr
Risk factors via First Street. Map © Google.
Why this score? — see what drove the B+ grade
The composite is a weighted blend of 9 inputs, each scored 0–100. Each bar is that input's sub-score; the figure is the points it added to the 100-point composite (weight × sub-score).
- Cash flow +28.4/30.0
- ARV discount +15.0/15.0
- DSCR +10.0/10.0
- Appreciation +8.0/10.0
- 1% rule +6.8/10.0
- Livability +3.9/5.0
- Schools +2.7/10.0
- Rent growth +2.5/5.0
- Condition / age +2.5/5.0
$176,000
🖨 Deal sheet 📄 Offer letter ✓ Due diligence
Listing remarks
This Lupton City ranch home with rocking chair front porch at 3938 Arkwright is in live in condition but could use a good bit of updating. This is a great starter home or addition to a portfolio. Check it out and get it nailed down.
Key facts
- 3,484 sq ft lot
- Built 1930
- Listed 29 days
Property features AI
Finance
- Other: Located in the Lupton City subdivision
Exterior
- Parking: On-street parking
- Utilities: Public water; Public sewer; Electricity connected; Natural gas available; Cable connected; Phone connected; Water connected
- Home design: Single-family house
- Construction: Vinyl siding; Block and pier (pillar/post/pier) foundation
- Exterior features: Covered porch; Porch; Full chain-link fence; Level lot; Lot dimensions approximately 58 x 77.2 feet; Lot about 0.08 acres
Interior
- Kitchen: Free-standing electric range; Water heater (located in kitchen area or utility)
- Bathrooms: One full bathroom
- Heating & cooling: Window air conditioning units; Heating noted in remarks
- Interior features: Decorative fireplace; Six total rooms
Neighborhood map
What this means for you Summary
Snapshot
- This is a 3-bed/1.0-bath single-family listed at $176k.
Deal economics
- At list price, monthly cash flow is $500 ($6k/yr) — positive.
- The deal already cash-flows at list — no discount required.
- Meets the 1% rule at list price ($2k rent vs $176k).
- Recommended offer: $173k (1.5% below list) — sets the bar for market timing.
- Cap rate 10.2% vs local median 3.4% in Chattanooga — top-decile yield for the area; either an underpriced asset or a hidden risk that comps aren't pricing in. Stress-test before assuming the spread holds.
Location & tenants
- Location reads 78/100 on livability (#3 in TN, #2,582 nationally) — a middle-class / working-renter tenant base. Strengths: amenities A+, commute A+, cost of living A+; Watch: employment D+, crime F.
- Hamilton County (urban): math 31% / reading 31% proficiency, ranked #42 of 139 in TN (top 30%) — families likely to look elsewhere, expect single-tenant / working-renter base with shorter leases.
- Zoned schools: Rivermont Elementary (math 22% / reading 42%, grade F, #369 of 952 statewide, top 42%, 379 students, 0% FRL); Red Bank Middle School (math 14% / reading 13%, grade F, #236 of 333 statewide, top 71%, 535 students, 0% FRL); Red Bank High School (math 8% / reading 37%, grade F, #156 of 332 statewide, top 49%, 824 students, 0% FRL) — zoned schools average 0% FRL vs 52% district-wide (52 pts lower); this property's tenant base skews higher-income than the district average.
- Market conditions: 5 active listings in the ZIP; 5 comparable units currently listed for rent nearby; rentals at typical pace (median 24d on market — plan ~3-4 weeks tenant-placement turnaround); 2,133 units permitted in Hamilton County in 2024 (405 in 5+ unit buildings).
Forward outlook
- In year one you build about $12k of equity ($1k loan paydown + $10k appreciation (6.0% local appreciation)).
- Hamilton County population projected at +23% by 2050 — long-run rental-demand tailwind backs the buy-and-hold thesis.
- At projected returns (6.0% appreciation + 3.0% rent growth), your $49k cash investment doubles in ~3 years — after that, you're playing with house money.
- By year 4, paydown + projected appreciation supports a ~$40k cash-out refi (75% LTV) — recoverable capital for the next deal without selling this one.
Negotiation context
- It's been on market 29 days — a 2% lower offer ($173k) is reasonable based on typical stale-listing flexibility.
- Current owner paid $150k; 17% above their basis — modest negotiation headroom, anchor on the comps not their cost.
Risks & watch-outs
- Watch-outs: flood insurance adds $66/mo; built in 1930 — expect roof / HVAC / electrical / plumbing capex.
- Climate carrying-cost: severe flood risk; extreme-heat days projected 7→20/yr by 2055 (HVAC capex compounding) — expect insurance premiums to compound above CPI over the hold.
Questions for the listing agent
- Built in 1930 — when were the roof, HVAC, electrical panel, plumbing, and water heater last replaced?
- What's the actual annual flood-insurance premium (NFIP or private), and is the property in a SFHA with mandatory coverage?
- Is there a deadline driving the sale (1031 exchange, divorce, estate, relocation)? That informs how much negotiation room exists.
- Schools are F-rated, which usually means shorter tenancies and higher turnover. Who's the typical renter profile here, and what's been the actual vacancy rate?
- Crime grade is F in this area — have there been break-ins, vandalism, or insurance claims at this property in the last 3 years? What carrier currently insures it and at what premium?
- What's the average days-on-market for RENTAL listings here right now (not sales)? A rising rental-DOM trend means longer vacancies and softer asking-rent achievability than the comps imply.
- What's the recent tenant-quality profile in this submarket — average credit score on applications, eviction rate, late-payment / NSF rate, and stable-employment percentage? A property-management company in the area should have these aggregated.
- How much new for-sale + rental construction is in the pipeline within 1–3 miles? Heavy new supply typically softens prices + rents 12–24 months out; constrained supply supports both.
Investment metrics
- 1% rule
- 1.18% ✓
- Cap rate
- 10.16%
- Cash-on-cash
- 13.80%
- DSCR
- 1.61
- GRM
- 7.1
CMA / ARV
- ARV (on-the-fly)
- $318,420
- Comps found
- 8
Show comp detail 8 sales within ~0.75 mi
| Address | Dist | Beds/Ba | Sqft | Sold | Price | $/sf | Match |
|---|---|---|---|---|---|---|---|
| 3860 Fairfax Dr | 0.26mi | 2/2.0 (-1) | 1,300 (-0%) | 17mo | $264,600 | $204 | 64 |
| 1265 Johnston Ter | 0.28mi | 3/2.0 | 1,400 (+7%) | 11mo | $280,000 | $200 | 62 |
| 3364 Crompton St | 0.43mi | 2/2.0 (-1) | 1,342 (+3%) | 7mo | $315,000 | $235 | 60 |
| 3879 Azalean Dr | 0.27mi | 3/1.0 | 1,216 (-7%) | 23mo | $305,000 | $251 | 57 |
| 3434 Whitney St | 0.32mi | 2/2.0 (-1) | 1,224 (-6%) | 12mo | $299,000 | $244 | 56 |
| 3363 Crompton St | 0.46mi | 2/2.0 (-1) | 1,350 (+3%) | 15mo | $355,000 | $263 | 51 |
| 3902 Azalean Dr | 0.31mi | 3/1.5 | 1,468 (+12%) | 14mo | $268,000 | $183 | 51 |
| 3908 Forest Highland Cir | 0.73mi | 3/2.0 | 1,247 (-4%) | 13mo | $345,000 | $277 | 44 |
Match score weights: distance 35% · size 25% · config 20% · recency 20%. Top-matched comps best support the ARV.
Projected returns pro-forma
5.95% appreciation · 3.0% rent growth · sell at horizon
- IRR
- 25.4%
- Equity multiple
- 2.67×
- Total profit
- $82,130
- Equity at exit
- $110,072
- IRR
- 23.9%
- Equity multiple
- 5.40×
- Total profit
- $216,733
- Equity at exit
- $199,121
Cash invested: $49,280 (down + closing). Projections, not guarantees.
Landlord ↔ Tenant lean methodology
- Overall (STATE)
- 87 Strongly Landlord-Friendly
- State Tennessee
- 87 Strongly Landlord-Friendly · R+13
- County
- — inherits STATE
- City
- — inherits STATE
ZIP-level market 37351
- Home prices YoY
- 1.4%
- Active inventory
- 5
- Price-to-rent
- 7.1×
Monthly cashflow live
- Estimated rent
- $2,074 high interval (Pro) →
- Mortgage (P&I)
- −$923
- Tax from tax record
- −$75 /mo · $903/yr
- Insurance
- −$73
- Flood insurance flood zone
- −$66 /mo · $798/yr
- HOA
- −$0
- Vacancy / Maint / Mgmt
- −$436
- Net cashflow
- $500
Break-even live
UW: 25.0% down · 7.5% · 30yr · 1.5% tax · 5.0% vac · 8.0% maint · 8.0% mgmt
Financing live
Cash to close
- Down payment
- $44,000
- Closing costs
- $5,280
- Reserves months
- —
- Total cash needed
- —
Loan-product check · same deal, 3 products live
Conventional
25% down · 7.5% · 30yr
- Down + closing
- —
- Monthly P&I
- —
- Monthly cashflow
- —
- DSCR
- —
- Eligible?
- —
Personal DTI + credit; lowest rate.
DSCR
20% down · 8.5% · 30yr
- Down + closing
- —
- Monthly P&I
- —
- Monthly cashflow
- —
- DSCR
- —
- Eligible?
- —
No personal income docs; deal must DSCR.
Hard money
10% down · 12.0% · 12mo
- Down + closing
- —
- Monthly P&I
- —
- Monthly cashflow
- —
- DSCR
- —
- Eligible?
- —
Short-term bridge; refi at stabilization.
Rent comps 5 comps
| Address | Beds | Baths | Sqft | Rent | $/sqft | DOM | Units | Dist |
|---|---|---|---|---|---|---|---|---|
| 1438 Ely Rd Hixson, TN | 3.0 | 2.5 | 1600 | $2,500 | $1.56 | 23d | 1 | 1.25mi |
| 1206 Cranbrook Dr Hixson, TN | 3.0 | 1.5 | 1045 | $1,973 | $1.89 | 23d | 1 | 1.31mi |
| 945 Brynwood Ter Chattanooga, TN | 3.0 | 2.0 | 1184 | $2,000 | $1.69 | 23d | 1 | 1.35mi |
| 3230 Social Cir Chattanooga, TN | 3.0 | 2.5 | 1852 | $2,250 | $1.21 | 23d | 1 | 1.40mi |
| 801 Ely Rd Hixson, TN | 3.0 | 2.0 | 1323 | $1,700 | $1.28 | 21d | 1 | 1.44mi |
Listing history 20 events
-
2026-06-18days on market $176,000 Active 29 DOM
-
2026-06-18price $176,000 Active 28 DOM
-
2026-06-17days on market $181,000 Active 28 DOM
-
2026-06-16days on market $181,000 Active 27 DOM
-
2026-06-15days on market $181,000 Active 26 DOM
-
2026-06-14days on market $181,000 Active 24 DOM
-
2026-06-10days on market $181,000 Active 21 DOM
-
2026-06-09days on market $181,000 Active 20 DOM
-
2026-06-08days on market $181,000 Active 19 DOM
-
2026-06-07days on market $181,000 Active 18 DOM
-
2026-06-05days on market $181,000 Active 15 DOM
-
2026-06-03days on market $181,000 Active 14 DOM
-
2026-06-03price $181,000 Active 13 DOM
-
2026-06-02days on market $189,000 Active 13 DOM
-
2026-06-01days on market $189,000 Active 12 DOM
-
2026-05-31days on market $189,000 Active 11 DOM
-
2026-05-30days on market $189,000 Active 10 DOM
-
2026-05-19$189,000 Active
-
2026-04-28soldstatus $150,000
-
2023-10-11soldstatus $48,958
ⓘ Source: listings_history table (triggers on properties + properties_extension) + one-shot
backfill from property_details.listing_events for pre-trigger history.
Tax reassessment forecast TN · Resets to sale price
- Current annual tax
- $903 · $75/mo
- Projected year-2 tax
- $1,250 · $104/mo
- Expected delta
- +$346/yr (+$29/mo · 38.3%)
ⓘ Screening estimate from a state-policy table — verify with the county assessor before closing.
Climate risk First Street
- Flood 9/10 Extreme FEMA zone X (unshaded) · 99% chance over 30 yrs
- Wildfire 3/10 Moderate
- Heat 6/10 Major 7 d/yr ≥105°F today · 20 d/yr by 30 yrs out
- Wind 4/10 Moderate 9% chance of damaging wind over 30 yrs
- Air quality 4/10 Moderate 3 unhealthy d/yr today · 4 by 30 yrs out
Nearby sold comps map
Loading sold comps map…
Walkable amenities ~0.75 mi
Loading nearby amenities…
Taxation est. · year 1
- Rental income
- $24,886
- − Mortgage interest
- −$9,859
- − Property taxes
- −$903
- − Insurance
- −$1,678
- − Repairs & maintenance
- −$1,991
- − Management
- −$1,991
- − Depreciation
- −$5,120
- Taxable income
- $3,345
- Est. tax owed @ 24.0%
- −$803
- After-tax cash flow
- $5,201/yr
For passive investors: Depreciation is non-cash, so a rental often shows a tax loss while cash-flowing — sheltering income. Rental losses are passive: they offset passive income freely, and up to $25,000/yr can offset ordinary (W-2) income if you actively participate and your MAGI is under $100k (phasing out to $0 by $150k); unused losses carry forward. On sale, claimed depreciation is recaptured at up to 25%, and gains may owe capital-gains tax (a 1031 exchange can defer both). Figures are a year-1 estimate at your 24.0% rate — not tax advice; consult a CPA.
Schools (NCES district)
- District
- Hamilton County
- NCES district ID
- 4701590
- Math proficiency
- 31% ▼ -10.00%
- Reading proficiency
- 31% ▼ -3.00%
- Median HH income
- $47,456
- Composite
- 26.8/100
- National rank
- #7122
- State rank
- #42 of 139 in TN
Livability — Chattanooga
- Score
- 78/100
- State rank
- #3
- US rank
- #2582
Category grades
Schools grade is shown separately in the Schools card above.
Census & demographics
- Census place
- Chattanooga, TN
- City population
- 131,999
- Population (ZIP)
- 295
Population outlook (Hamilton County) Hauer SSP2
- Today (2025)
- 393,784 people
- By 2030
- 412,983 · +4.9%
- By 2040
- 449,502 · +14.1%
- By 2050
- 484,341 · +23.0%
- By 2075
- 565,746 · +43.7%
- By 2100
- 618,394 · +57.0%
Race, ethnicity, and origin ACS 2023
- Neighborhood character
- Predominantly White (82%)
- Race & ethnicity
- White 82% Asian 7% Native American 6% Hispanic / Latino 4%
- Common ancestry
- Romanian 22% American 3%
- Foreign-born
- 7% · China
- Languages at home
- 91% English-only · Spanish 9%
Political lean MEDSL · Hamilton
- 2024 margin
- R (+13.1) · D 42.7% · R 55.7% · Other 1.6%
- 2008→2024 swing
- -1.2pp toward R · 2008: -11.8pp · 2024: -13.1pp
- All cycles
- 2024: R+13.1 2020: R+9.7 2016: R+16.6 2012: R+14.8 2008: R+11.8
Not yet ingested
- Civics
- —
Market trends
- HPI YoY
- ▲ 5.95%
- Current HPI
- 444.0612
- Rent YoY
- —
- Metro
- —
- State GDP YoY
- ▲ 2.78%
- F500 in state
- 22
Industry mix (Fortune 500 HQ in TN)
| Industry | F500 HQs | Revenue |
|---|---|---|
| Healthcare | 3 | $91B |
|
||
| Retail | 3 | $72B |
|
||
| Transportation / Logistics | 1 | $88B |
|
||
| Paper / Packaging | 1 | $19B |
|
||
| Insurance | 1 | $13B |
|
||
| Energy | 1 | $12B |
|
||
Price history
+286.0% since first listed3 events — show timeline
- 2026-05-19 Listed $189,000 GCAR
- 2026-04-28 Sold (Public Records) $150,000 Public Records
- 2023-10-11 Sold (Public Records) $48,958 Public Records
Property tax history
+5.9%/yrLatest (2025): $903 · +74.2% YoY. Source: county tax records.
Cash-flow waterfall
monthlySold comps — $/sqft
last 12 mo · ≤1 miLoading sold comps…