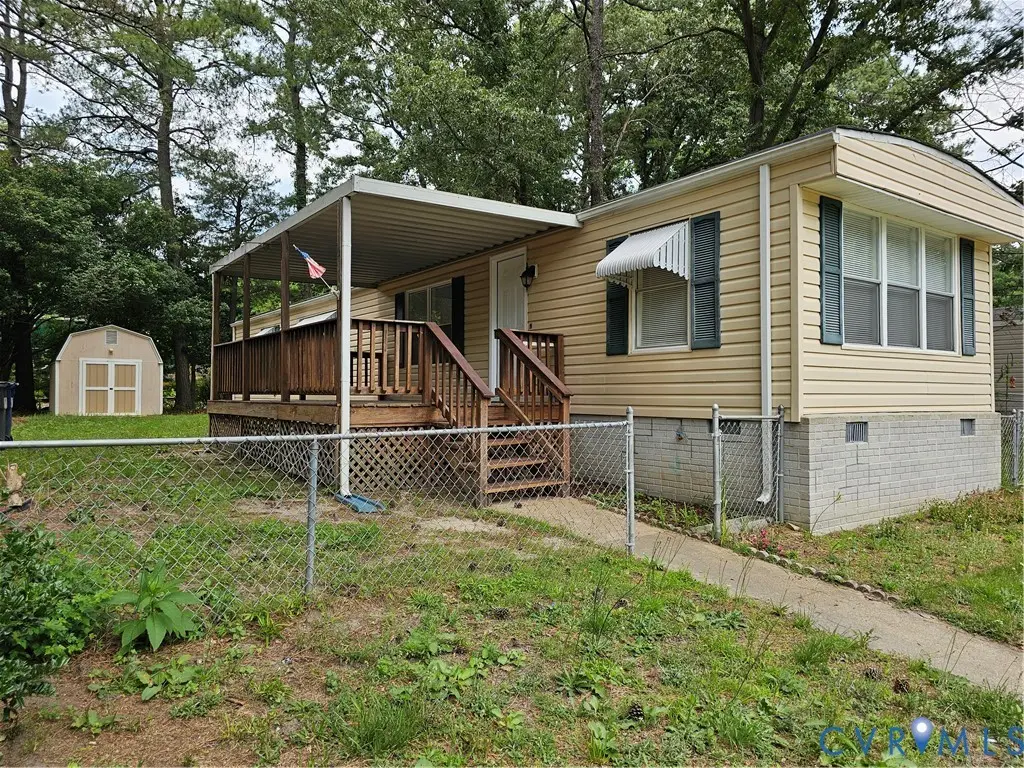
17100 Lansmill Dr · Colonial Heights, VA
Flood risk 1/10 · Minimal
- FEMA flood zone
- X (unshaded)
- Chance of flooding over 30 yrs
- 0.0%
- Est. flood insurance / yr
- $507 – $1,088
Fire risk 2/10 · Minimal
- Est. fire insurance / yr
- $666 – $1,236
Heat risk 7/10 · Major
- Hot days now (above 108°F)
- 7 days/yr
- Hot days in 30 yrs
- 15 days/yr
Wind risk 6/10 · Moderate
- Chance of severe wind over 30 yrs
- 38.0%
Air-quality risk 2/10 · Minimal
- Unhealthy air days now
- 0 days/yr
- Unhealthy air days in 30 yrs
- 1 days/yr
Risk factors via First Street. Map © Google.
Why this score? — see what drove the C- grade
The composite is a weighted blend of 9 inputs, each scored 0–100. Each bar is that input's sub-score; the figure is the points it added to the 100-point composite (weight × sub-score).
- Cash flow +18.2/30.0
- ARV discount +7.5/15.0
- DSCR +5.7/10.0
- Schools +5.2/10.0
- Rent growth +4.4/5.0
- 1% rule +4.0/10.0
- Livability +3.7/5.0
- Condition / age +2.5/5.0
- Appreciation +0.0/10.0
$159,000
🖨 Deal sheet 📄 Offer letter ✓ Due diligence
Listing remarks MLS
Ready to downsize into an affordable Chesterfield County home? This may be the one for you. Quiet community close to everything! Split bedroom plan with two bedrooms and two full baths. Living room, kitchen and Florida room. Perfect little covered front porch for sitting. Yard is fenced and there is a detached storage shed for mower and equipment. Paved parking area in the front. Must see to appreciate.
Key facts
- 8,799 sq ft lot
- Parking
- Built 1986
Property features AI
Exterior
- Parking: Paved, oversized driveway
- Security: Smoke detectors
- Utilities: Public water; Public sewer; Electric service
- Home design: Single-story home; Resale property; Composition shingle roof; Zoned MH2
- Construction: Frame construction with drywall; Vinyl and wood siding; Crawl space foundation; Built (actual year recorded)
- Exterior features: Storage shed; Paved driveway; Front porch; Side porch; Partially fenced yard
Interior
- Kitchen: Updated cabinetry; Smooth cooktop; Electric cooking / range; Range hood; Dishwasher; Eat-in layout
- Bedrooms: Bedroom 3 (First floor) — LVP flooring, fresh paint, 13 x 11; Bedroom 2 (First floor) — LVP flooring with a 4 x 6 nook suitable for a dresser or desk, 12 x 7; Additional bedroom (First floor) — LVP flooring, large bath with shower, 10 x 13
- Flooring: Vinyl (LVP)
- Bathrooms: 2 full bathrooms; Full bath with shower (First floor)
- Heating & cooling: Heat pump; Electric forced air heating; Electric cooling
- Interior features: Thermal windows; Eat-in kitchen; High speed internet; Laminate counters; Primary bedroom with private bath; Wired for data
- Laundry & utility: Washer hookup; Dryer hookup; Electric water heater
Neighborhood map
What this means for you Summary
Snapshot
- This is a 2-bed/1.5-bath manufactured listed at $159k.
Deal economics
- At list price, monthly cash flow is $143 ($2k/yr) — positive.
- The deal already cash-flows at list — no discount required.
- To meet the 1% rule (rent ≥ 1% of price), the offer needs to be $143k (10.1% below list).
- Recommended offer: $143k (10.1% below list) — sets the bar for 1% rule.
- Cap rate 7.4% vs local median 4.2% in Colonial Heights — top-decile yield for the area; either an underpriced asset or a hidden risk that comps aren't pricing in. Stress-test before assuming the spread holds.
Location & tenants
- Location reads 74/100 on livability (#146 in VA, #4,726 nationally) — a middle-class / working-renter tenant base. Strengths: cost of living A+, housing A+, health & safety A+; Watch: employment C-, amenities D, crime F.
- Chesterfield County Public School District (suburban): math 52% / reading 64% proficiency, ranked #57 of 131 in VA (top 44%) — acceptable for families but not a draw, mixed tenant base, ~2y average lease.
- Market conditions: Rents rising fast (+7.5%/yr); 124 active listings in the ZIP; 2 comparable units currently listed for rent nearby; solid renter incomes; 2,307 units permitted in Chesterfield County in 2024 (462 in 5+ unit buildings).
Forward outlook
- Local home prices are declining (-3.0%/yr); year-one equity from $1k of loan paydown is wiped out by about $5k of value loss. Plan a longer hold.
- Chesterfield County population projected at +20% by 2050 — long-run rental-demand tailwind backs the buy-and-hold thesis.
- At projected returns (-3.0% appreciation + 7.5% rent growth), your $45k cash investment doubles in ~10 years — after that, you're playing with house money.
Negotiation context
- Only 3 days on market — expect competitive offers; lowballing is unlikely to land.
- 7 sale attempts since 19y ago; this cycle's ask is 303% above the opening price — seller raised mid-cycle; expect resistance to lowballs.
- Current owner paid $40k; list at $159k implies a 298% gain — meaningful room to come down on a strong offer.
Risks & watch-outs
- Climate carrying-cost: major wind risk, 38% chance of damaging wind over 30y; extreme-heat days projected 7→15/yr by 2055 (HVAC capex compounding) — expect insurance premiums to compound above CPI over the hold.
Questions for the listing agent
- Is there a deadline driving the sale (1031 exchange, divorce, estate, relocation)? That informs how much negotiation room exists.
- Schools are A-rated — typically a magnet for longer-tenancy family renters. What's the average tenant stay here, and is there a school-zone premium baked into asking?
- Crime grade is F in this area — have there been break-ins, vandalism, or insurance claims at this property in the last 3 years? What carrier currently insures it and at what premium?
- What's the average days-on-market for RENTAL listings here right now (not sales)? A rising rental-DOM trend means longer vacancies and softer asking-rent achievability than the comps imply.
- What's the recent tenant-quality profile in this submarket — average credit score on applications, eviction rate, late-payment / NSF rate, and stable-employment percentage? A property-management company in the area should have these aggregated.
- How much new for-sale + rental construction is in the pipeline within 1–3 miles? Heavy new supply typically softens prices + rents 12–24 months out; constrained supply supports both.
Investment metrics
- 1% rule
- 0.90% ✗
- Cap rate
- 7.37%
- Cash-on-cash
- 3.86%
- DSCR
- 1.17
- GRM
- 9.3
CMA / ARV
No comps found within radius.
Projected returns pro-forma
-3.0% appreciation · 7.5% rent growth · sell at horizon
- IRR
- -5.8%
- Equity multiple
- 0.78×
- Total profit
- $-9,919
- Equity at exit
- $23,707
- IRR
- 8.3%
- Equity multiple
- 1.75×
- Total profit
- $33,390
- Equity at exit
- $13,747
Cash invested: $44,520 (down + closing). Projections, not guarantees.
Landlord ↔ Tenant lean methodology
- Overall (STATE)
- 55 Moderately Landlord-Leaning
- State Virginia
- 55 Moderately Landlord-Leaning · D+2
- County
- — inherits STATE
- City
- — inherits STATE
ZIP-level market 23834
- Rents YoY
- 7.5%
- Active inventory
- 124
- Price-to-rent
- 9.3×
Monthly cashflow live
- Estimated rent
- $1,429 medium interval (Pro) →
- Mortgage (P&I)
- −$834
- Tax from tax record
- −$86 /mo · $1,029/yr
- Insurance
- −$66
- HOA
- −$0
- Vacancy / Maint / Mgmt
- −$300
- Net cashflow
- $143
Break-even live
UW: 25.0% down · 7.5% · 30yr · 1.5% tax · 5.0% vac · 8.0% maint · 8.0% mgmt
Financing live
Cash to close
- Down payment
- $39,750
- Closing costs
- $4,770
- Reserves months
- —
- Total cash needed
- —
Loan-product check · same deal, 3 products live
Conventional
25% down · 7.5% · 30yr
- Down + closing
- —
- Monthly P&I
- —
- Monthly cashflow
- —
- DSCR
- —
- Eligible?
- —
Personal DTI + credit; lowest rate.
DSCR
20% down · 8.5% · 30yr
- Down + closing
- —
- Monthly P&I
- —
- Monthly cashflow
- —
- DSCR
- —
- Eligible?
- —
No personal income docs; deal must DSCR.
Hard money
10% down · 12.0% · 12mo
- Down + closing
- —
- Monthly P&I
- —
- Monthly cashflow
- —
- DSCR
- —
- Eligible?
- —
Short-term bridge; refi at stabilization.
Rent comps 2 comps
| Address | Beds | Baths | Sqft | Rent | $/sqft | DOM | Units | Dist |
|---|---|---|---|---|---|---|---|---|
| 100 Clearfield Cir Colonial Heights, VA | 2.0–3.0 | 2.0 | 1048 | $1,403 | $1.34 | 1d | 7 | 1.24mi |
| 15801 Meridian Ave Chester, VA | 2.0 | 1.0 | 870 | $1,450 | $1.67 | 20d | 1 | 1.50mi |
Listing history 5 events
-
2026-06-15status $159,000 Pending 3 DOM
-
2026-06-13days on market $159,000 Active 3 DOM
-
2026-06-13statusdays on market $159,000 Active 2 DOM
-
2026-06-08remarks 699-char remark
-
2026-06-08$159,000 Coming Soon 1 DOM
ⓘ Source: listings_history table (triggers on properties + properties_extension) + one-shot
backfill from property_details.listing_events for pre-trigger history.
Tax reassessment forecast VA · Resets to sale price
- Current annual tax
- $1,029 · $86/mo
- Projected year-2 tax
- $1,304 · $109/mo
- Expected delta
- +$275/yr (+$23/mo · 26.7%)
ⓘ Screening estimate from a state-policy table — verify with the county assessor before closing.
Climate risk First Street
- Flood 1/10 Low FEMA zone X (unshaded) · 0% chance over 30 yrs
- Wildfire 2/10 Low
- Heat 7/10 Severe 7 d/yr ≥108°F today · 15 d/yr by 30 yrs out
- Wind 6/10 Major 38% chance of damaging wind over 30 yrs
- Air quality 2/10 Low 0 unhealthy d/yr today · 1 by 30 yrs out
Nearby sold comps map
Loading sold comps map…
Walkable amenities ~0.75 mi
Loading nearby amenities…
Taxation est. · year 1
- Rental income
- $17,151
- − Mortgage interest
- −$8,906
- − Property taxes
- −$1,029
- − Insurance
- −$795
- − Repairs & maintenance
- −$1,372
- − Management
- −$1,372
- − Depreciation
- −$4,625
- Taxable loss
- −$949
- Est. tax savings @ 24.0%
- +$228
- After-tax cash flow
- $1,948/yr
For passive investors: Depreciation is non-cash, so a rental often shows a tax loss while cash-flowing — sheltering income. Rental losses are passive: they offset passive income freely, and up to $25,000/yr can offset ordinary (W-2) income if you actively participate and your MAGI is under $100k (phasing out to $0 by $150k); unused losses carry forward. On sale, claimed depreciation is recaptured at up to 25%, and gains may owe capital-gains tax (a 1031 exchange can defer both). Figures are a year-1 estimate at your 24.0% rate — not tax advice; consult a CPA.
Schools (NCES district)
- District
- Chesterfield County Public School District
- NCES district ID
- 5100840
- Math proficiency
- 52% ▼ -30.00%
- Reading proficiency
- 64% ▼ -15.00%
- Median HH income
- $72,821
- Composite
- 51.56/100
- National rank
- #1712
- State rank
- #57 of 131 in VA
Livability — Colonial Heights
- Score
- 74/100
- State rank
- #146
- US rank
- #4726
Category grades
Schools grade is shown separately in the Schools card above.
Census & demographics
- County
- Chesterfield County · 406,988 people
- City population
- 26,628
- Metro
- Richmond, VA
- Population (ZIP)
- 26,628
- Household income
- $84,338
- Rent vs Own
- Severe rent burden
- 814.0
Population outlook (Chesterfield County) Hauer SSP2
- Today (2025)
- 377,190 people
- By 2030
- 395,710 · +4.9%
- By 2040
- 427,694 · +13.4%
- By 2050
- 452,706 · +20.0%
- By 2075
- 505,533 · +34.0%
- By 2100
- 521,282 · +38.2%
Race, ethnicity, and origin ACS 2023
- Neighborhood character
- Majority White (63%)
- Race & ethnicity
- White 63% Black 22% Hispanic / Latino 8% Two or more races 5% Asian 3%
- Hispanic origin (detail)
- Mexican 3% Puerto Rican 3%
- Common ancestry
- Serbian 2% Slovak 2% Lithuanian 2%
- Foreign-born
- 7% · Canada, China, South Korea
- Languages at home
- 91% English-only · Spanish 5% Other Indo-European 2% Korean 1%
Political lean MEDSL · Chesterfield
- 2024 margin
- Lean D (+9.0) · D 53.8% · R 44.8% · Other 1.4%
- 2008→2024 swing
- +16.4pp toward D · 2008: -7.5pp · 2024: 9.0pp
- All cycles
- 2024: D+9.0 2020: D+6.7 2016: R+2.2 2012: R+7.1 2008: R+7.5
Not yet ingested
- Civics
- —
Market trends
- HPI YoY
- ▼ -212.28%
- Current HPI
- 294.4478
- Rent YoY
- ▲ 7.50%
- Metro
- Richmond, VA
- State GDP YoY
- ▲ 2.40%
- F500 in state
- 50
Industry mix (Fortune 500 HQ in VA)
| Industry | F500 HQs | Revenue |
|---|---|---|
| Aerospace / Defense | 4 | $236B |
|
||
| Technology / Defense | 3 | $32B |
|
||
| Financial Services | 2 | $176B |
|
||
| Utilities | 2 | $27B |
|
||
| Insurance | 2 | $25B |
|
||
| Technology | 2 | $15B |
|
||
Price history
+245.7% since first listed18 events — show timeline
- 2026-06-08 Coming Soon $159,000 CVRMLS
- 2015-08-20 Sold (MLS) $40,000 CVRMLS
- 2015-07-21 Pending — CVRMLS
- 2015-06-24 Listed $39,500 CVRMLS
- 2014-10-25 Listing Removed — CVRMLS
- 2014-06-02 Listed $70,000 CVRMLS
- 2014-05-14 Listing Removed — CVRMLS
- 2013-11-01 Listed $70,000 CVRMLS
- 2008-04-17 Sold (MLS) $95,000 CVRMLS
- 2008-04-17 Sold (MLS) $95,000 CVRMLS
- 2008-03-02 Listed $95,000 CVRMLS
- 2008-03-02 Listed $95,000 CVRMLS
- 2007-05-22 Sold (Public Records) $82,500 Public Records
- 2007-05-21 Sold (MLS) $82,500 CVRMLS
- 2007-05-21 Sold (MLS) $82,500 CVRMLS
- 2007-02-26 Listed $85,000 CVRMLS
- 2007-02-26 Listed $85,000 CVRMLS
- 1986-06-09 Sold (Public Records) $46,000 Public Records
Property tax history
+3.7%/yrLatest (2025): $1,029 · +16.8% YoY. Source: county tax records.
Cash-flow waterfall
monthlySold comps — $/sqft
last 12 mo · ≤1 miLoading sold comps…