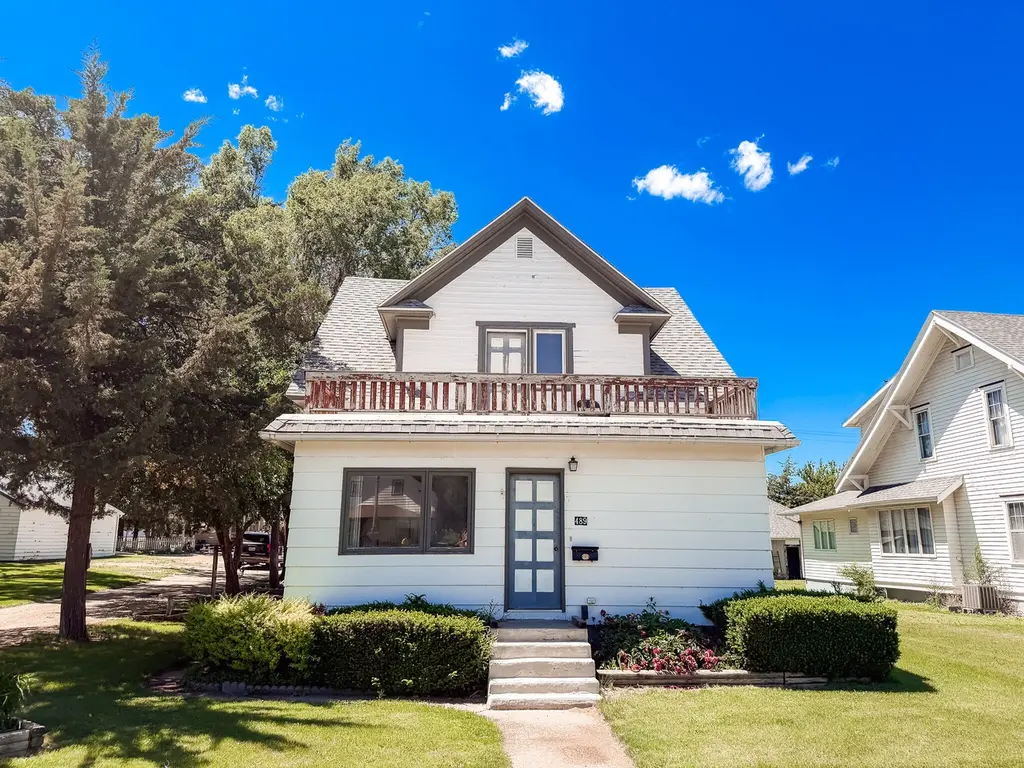
489 Commercial Ave · Wolsey, SD
Flood risk 1/10 · Minimal
- FEMA flood zone
- X (unshaded)
- Chance of flooding over 30 yrs
- 0.0%
- Est. flood insurance / yr
- $473 – $860
Fire risk 3/10 · Minor
- Est. fire insurance / yr
- $1,342 – $2,492
Heat risk 3/10 · Minor
- Hot days now (above 101°F)
- 7 days/yr
- Hot days in 30 yrs
- 14 days/yr
Wind risk 2/10 · Minimal
- Chance of severe wind over 30 yrs
- —
Air-quality risk 2/10 · Minimal
- Unhealthy air days now
- 1 days/yr
- Unhealthy air days in 30 yrs
- 1 days/yr
Risk factors via First Street. Map © Google.
Why this score? — see what drove the B- grade
The composite is a weighted blend of 9 inputs, each scored 0–100. Each bar is that input's sub-score; the figure is the points it added to the 100-point composite (weight × sub-score).
- Cash flow +26.5/30.0
- DSCR +9.0/10.0
- ARV discount +7.5/15.0
- 1% rule +5.9/10.0
- Appreciation +5.0/10.0
- Schools +3.1/10.0
- Livability +3.1/5.0
- Rent growth +2.5/5.0
- Condition / age +2.5/5.0
$113,000
🖨 Deal sheet 📄 Offer letter ✓ Due diligence
Key facts
- Private balcony
- Major updates
- Fully furnished
Tags
Property features AI
Exterior
- Parking: Attached or detached 2-car garage with garage door opener
- Home design: Residential property
- Exterior features: Paved road access; Lot dimensions roughly 50 x 140, 35 x 140 and 50 x 100; Zoned R-1
Interior
- Kitchen: Dishwasher; Microwave; Refrigerator; Freezer
- Bathrooms: One three-quarter bathroom
- Heating & cooling: Central cooling
- Interior features: Dishwasher; Dryer; Freezer; Microwave; Refrigerator; Washer; Has cooling
- Laundry & utility: Washer; Dryer
Neighborhood map
What this means for you Summary
Snapshot
- This is a 3-bed/1.0-bath single-family listed at $113k.
Deal economics
- At list price, monthly cash flow is $298 ($4k/yr) — positive.
- The deal already cash-flows at list — no discount required.
- Meets the 1% rule at list price ($1k rent vs $113k).
Location & tenants
- Location reads 61/100 on livability (#234 in SD) — a middle-class / working-renter tenant base. Strengths: cost of living A+, housing B; Watch: employment C-, health & safety C-, schools D.
- Wolsey Wessington School District 02-6 (rural): math 30% / reading 35% proficiency, ranked #128 of 148 in SD (top 86%) — families likely to look elsewhere, expect single-tenant / working-renter base with shorter leases.
- Market conditions: 5 active listings in the ZIP; 30 units permitted in Beadle County in 2024 (6 in 5+ unit buildings).
Forward outlook
- In year one you build about $4k of equity ($781 loan paydown + $3k appreciation (3.0% local appreciation)).
- Beadle County population projected at +39% by 2050 — long-run rental-demand tailwind backs the buy-and-hold thesis.
- At projected returns (3.0% appreciation + 3.0% rent growth), your $32k cash investment doubles in ~4 years — after that, you're playing with house money.
- By year 8, paydown + projected appreciation supports a ~$31k cash-out refi (75% LTV) — recoverable capital for the next deal without selling this one.
Negotiation context
- Only 7 days on market — expect competitive offers; lowballing is unlikely to land.
Risks & watch-outs
- Watch-outs: built in 1908 — expect roof / HVAC / electrical / plumbing capex.
Questions for the listing agent
- Built in 1908 — when were the roof, HVAC, electrical panel, plumbing, and water heater last replaced?
- Is there a deadline driving the sale (1031 exchange, divorce, estate, relocation)? That informs how much negotiation room exists.
- Schools are D-rated, which usually means shorter tenancies and higher turnover. Who's the typical renter profile here, and what's been the actual vacancy rate?
- Crime grade is D in this area — have there been break-ins, vandalism, or insurance claims at this property in the last 3 years? What carrier currently insures it and at what premium?
- What's the average days-on-market for RENTAL listings here right now (not sales)? A rising rental-DOM trend means longer vacancies and softer asking-rent achievability than the comps imply.
- What's the recent tenant-quality profile in this submarket — average credit score on applications, eviction rate, late-payment / NSF rate, and stable-employment percentage? A property-management company in the area should have these aggregated.
- How much new for-sale + rental construction is in the pipeline within 1–3 miles? Heavy new supply typically softens prices + rents 12–24 months out; constrained supply supports both.
Investment metrics
- 1% rule
- 1.09% ✓
- Cap rate
- 9.46%
- Cash-on-cash
- 11.31%
- DSCR
- 1.50
- GRM
- 7.7
CMA / ARV
No comps found within radius.
Projected returns pro-forma
3.0% appreciation · 3.0% rent growth · sell at horizon
- IRR
- 18.1%
- Equity multiple
- 2.03×
- Total profit
- $32,556
- Equity at exit
- $50,810
- IRR
- 19.4%
- Equity multiple
- 3.82×
- Total profit
- $89,232
- Equity at exit
- $78,304
Cash invested: $31,640 (down + closing). Projections, not guarantees.
Landlord ↔ Tenant lean methodology
- Overall (STATE)
- 83 Strongly Landlord-Friendly
- State South Dakota
- 83 Strongly Landlord-Friendly · R+16
- County
- — inherits STATE
- City
- — inherits STATE
ZIP-level market 57384
- Active inventory
- 5
- Price-to-rent
- 7.7×
Monthly cashflow live
- Estimated rent
- $1,229 medium interval (Pro) →
- Mortgage (P&I)
- −$593
- Tax from tax record
- −$33 /mo · $401/yr
- Insurance
- −$47
- HOA
- −$0
- Vacancy / Maint / Mgmt
- −$258
- Net cashflow
- $298
Break-even live
UW: 25.0% down · 7.5% · 30yr · 1.5% tax · 5.0% vac · 8.0% maint · 8.0% mgmt
Financing live
Cash to close
- Down payment
- $28,250
- Closing costs
- $3,390
- Reserves months
- —
- Total cash needed
- —
Loan-product check · same deal, 3 products live
Conventional
25% down · 7.5% · 30yr
- Down + closing
- —
- Monthly P&I
- —
- Monthly cashflow
- —
- DSCR
- —
- Eligible?
- —
Personal DTI + credit; lowest rate.
DSCR
20% down · 8.5% · 30yr
- Down + closing
- —
- Monthly P&I
- —
- Monthly cashflow
- —
- DSCR
- —
- Eligible?
- —
No personal income docs; deal must DSCR.
Hard money
10% down · 12.0% · 12mo
- Down + closing
- —
- Monthly P&I
- —
- Monthly cashflow
- —
- DSCR
- —
- Eligible?
- —
Short-term bridge; refi at stabilization.
Listing history 6 events
-
2026-06-18days on market $113,000 Active 7 DOM
-
2026-06-17days on market $113,000 Active 6 DOM
-
2026-06-16days on market $113,000 Active 5 DOM
-
2026-06-15days on market $113,000 Active 4 DOM
-
2026-06-13days on market $113,000 Active 2 DOM
-
2026-06-12$113,000 Active 1 DOM
ⓘ Source: listings_history table (triggers on properties + properties_extension) + one-shot
backfill from property_details.listing_events for pre-trigger history.
Tax reassessment forecast SD · Resets to sale price
- Current annual tax
- $401 · $33/mo
- Projected year-2 tax
- $1,480 · $123/mo
- Expected delta
- +$1,080/yr (+$90/mo · 269.4%)
ⓘ Screening estimate from a state-policy table — verify with the county assessor before closing.
Climate risk First Street
- Flood 1/10 Low FEMA zone X (unshaded) · 0% chance over 30 yrs
- Wildfire 3/10 Moderate
- Heat 3/10 Moderate 7 d/yr ≥101°F today · 14 d/yr by 30 yrs out
- Wind 2/10 Low
- Air quality 2/10 Low 1 unhealthy d/yr today · 1 by 30 yrs out
Nearby sold comps map
Loading sold comps map…
Walkable amenities ~0.75 mi
Loading nearby amenities…
Taxation est. · year 1
- Rental income
- $14,753
- − Mortgage interest
- −$6,330
- − Property taxes
- −$401
- − Insurance
- −$565
- − Repairs & maintenance
- −$1,180
- − Management
- −$1,180
- − Depreciation
- −$3,287
- Taxable income
- $1,810
- Est. tax owed @ 24.0%
- −$434
- After-tax cash flow
- $3,144/yr
For passive investors: Depreciation is non-cash, so a rental often shows a tax loss while cash-flowing — sheltering income. Rental losses are passive: they offset passive income freely, and up to $25,000/yr can offset ordinary (W-2) income if you actively participate and your MAGI is under $100k (phasing out to $0 by $150k); unused losses carry forward. On sale, claimed depreciation is recaptured at up to 25%, and gains may owe capital-gains tax (a 1031 exchange can defer both). Figures are a year-1 estimate at your 24.0% rate — not tax advice; consult a CPA.
Schools (NCES district)
- District
- Wolsey Wessington School District 02-6
- NCES district ID
- 4680100
- Math proficiency
- 30% ▼ -12.00%
- Reading proficiency
- 35% ▼ -12.00%
- Median HH income
- $47,119
- Composite
- 30.72/100
- National rank
- #11418
- State rank
- #128 of 148 in SD
Livability — Wolsey
- Score
- 61/100
- State rank
- #234
- US rank
- #18047
Category grades
Schools grade is shown separately in the Schools card above.
Census & demographics
- Census place
- Wolsey, SD
- City population
- 1,062
- Population (ZIP)
- 1,062
Population outlook (Beadle County) Hauer SSP2
- Today (2025)
- 20,094 people
- By 2030
- 21,218 · +5.6%
- By 2040
- 24,042 · +19.6%
- By 2050
- 27,931 · +39.0%
- By 2075
- 43,296 · +115.5%
- By 2100
- 65,888 · +227.9%
Race, ethnicity, and origin ACS 2023
- Neighborhood character
- Predominantly White (85%)
- Race & ethnicity
- White 85% Hispanic / Latino 12% Two or more races 2% Black 2%
- Hispanic origin (detail)
- Mexican 12%
- Common ancestry
- Iranian 4% Portuguese 3% Lithuanian 2%
- Foreign-born
- 2%
- Languages at home
- 90% English-only · Spanish 7% German/W. Germanic 3%
Political lean MEDSL · Beadle
- 2024 margin
- Solid R (+40.1) · D 28.8% · R 68.8% · Other 2.4%
- 2008→2024 swing
- -32.8pp toward R · 2008: -7.3pp · 2024: -40.1pp
- All cycles
- 2024: R+40.1 2020: R+38.1 2016: R+37.6 2012: R+18.6 2008: R+7.3
Not yet ingested
- Civics
- —
Market trends
- HPI YoY
- —
- Current HPI
- —
- Rent YoY
- —
- Metro
- —
- State GDP YoY
- ▲ 0.70%
- F500 in state
- 2
Industry mix (Fortune 500 HQ in SD)
| Industry | F500 HQs | Revenue |
|---|---|---|
| Utilities | 1 | $1B |
|
||
Price history
1 event — show timeline
- 2026-06-11 Listed $113,000 HBOR
Property tax history
-6.2%/yrLatest (2026): $401 · -7.2% YoY. Source: county tax records.
Cash-flow waterfall
monthlySold comps — $/sqft
last 12 mo · ≤1 miLoading sold comps…