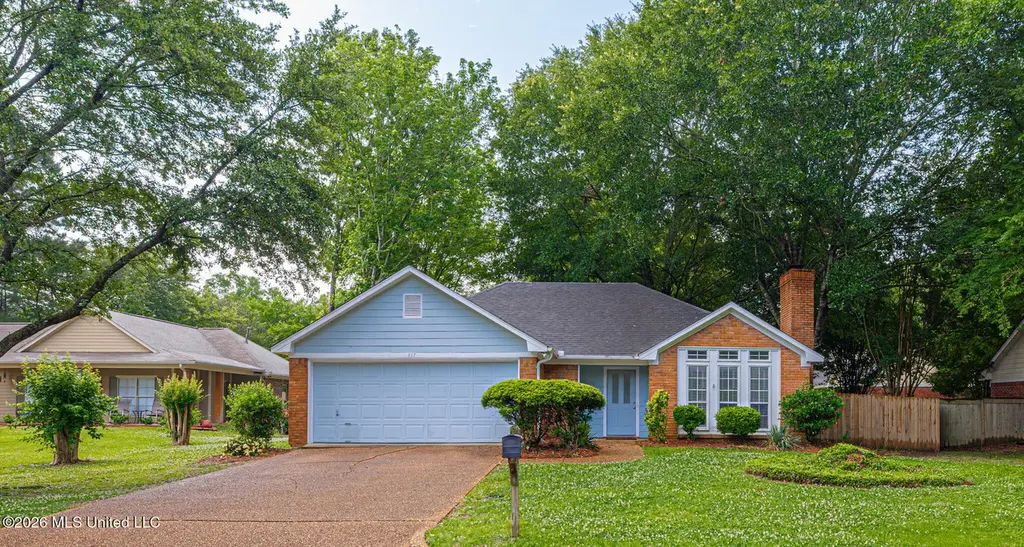
817 Pickford Pt · Madison, MS
Flood risk 1/10 · Minimal
- FEMA flood zone
- X (unshaded)
- Chance of flooding over 30 yrs
- 0.0%
- Est. flood insurance / yr
- $507 – $1,088
Fire risk 1/10 · Minimal
- Est. fire insurance / yr
- $1,241 – $2,305
Heat risk 7/10 · Major
- Hot days now (above 108°F)
- 7 days/yr
- Hot days in 30 yrs
- 20 days/yr
Wind risk 8/10 · Major
- Chance of severe wind over 30 yrs
- 80.0%
Air-quality risk 2/10 · Minimal
- Unhealthy air days now
- 0 days/yr
- Unhealthy air days in 30 yrs
- 1 days/yr
Risk factors via First Street. Map © Google.
Why this score? — see what drove the C+ grade
The composite is a weighted blend of 9 inputs, each scored 0–100. Each bar is that input's sub-score; the figure is the points it added to the 100-point composite (weight × sub-score).
- Cash flow +20.5/30.0
- ARV discount +13.8/15.0
- DSCR +6.5/10.0
- 1% rule +5.4/10.0
- Schools +4.8/10.0
- Livability +4.0/5.0
- Condition / age +4.0/5.0
- Rent growth +3.2/5.0
- Appreciation +0.0/10.0
$234,900
🖨 Deal sheet (PDF) 📄 Offer letter ✓ Due diligence
Listing remarks MLS
A steal in Madison County! Great location in a quite cul-de-sac in Hunters Pointe, this 3 bedroom, 2 bath home features beautiful flooring in the living room, dining room and kitchen, a two year old roof, lots of fresh paint, and the refrigerator, washer and dryer can remain with an acceptable offer. Located in the top-rated Madison School District! Call your REALTOR to see this home before it's too late.
Key facts
- Laminate flooring
- Eat-in kitchen
- Cul-de-sac
Tags
Property features AI
Finance
- Other: Lot size approximately 0.5 acres
Exterior
- Parking: 2-car garage
- Utilities: Public water; Public sewer; Cable available
- Home design: Single-family house; One story
- Construction: Brick construction; Asphalt roof; Slab foundation; Built (year per public records)
- Exterior features: Full yard fencing
Interior
- Kitchen: Dishwasher; Electric range; Refrigerator
- Bathrooms: 2 full bathrooms
- Heating & cooling: Central heating; Fireplace heating; Central air conditioning; Ceiling fans
- Interior features: Wood-burning fireplace; Move-in ready condition
Neighborhood map
What this means for you Summary
Snapshot
- This is a 3-bed/2.0-bath single-family listed at $235k. Condition is rated good.
Deal economics
- At list price, monthly cash flow is $311 ($4k/yr) — positive.
- The deal already cash-flows at list — no discount required.
- Meets the 1% rule at list price ($2k rent vs $235k).
- Cap rate 7.9% vs local median 3.7% in Madison — top-decile yield for the area; either an underpriced asset or a hidden risk that comps aren't pricing in. Stress-test before assuming the spread holds.
Location & tenants
- Location reads 81/100 on livability (#4 in MS, #1,556 nationally) — a professional / high-income tenant draw. Strengths: crime A+, employment A+, housing A+; Watch: amenities D-, commute F.
- Madison County School District (rural): math 54% / reading 54% proficiency, ranked #3 of 130 in MS (top 2%) — acceptable for families but not a draw, mixed tenant base, ~2y average lease.
- Zoned schools: Madison Avenue Lower Elementary (437 students, 99% FRL); Madison Middle School (math 66% / reading 57%, grade B+, #6 of 179 statewide, top 3%, 1,154 students, 100% FRL); Madison Central High School (math 5% / reading 63%, grade F, #78 of 197 statewide, top 39%, 1,246 students, 100% FRL) — zoned schools average 100% FRL vs 29% district-wide (70 pts higher); higher-poverty schools than district average — tighter screening recommended.
- Market conditions: Rents rising (+2.6%/yr); 634 active listings in the ZIP; high-income renter base; 553 units permitted in Madison County in 2024 (0 in 5+ unit buildings).
Forward outlook
- Local home prices are declining (-3.0%/yr); year-one equity from $2k of loan paydown is wiped out by about $7k of value loss. Plan a longer hold.
- Madison County population projected at +34% by 2050 — long-run rental-demand tailwind backs the buy-and-hold thesis.
Negotiation context
- Only 5 days on market — expect competitive offers; lowballing is unlikely to land.
- 5 sale attempts since 7y ago with the ask held roughly flat each time — persistent listings suggest the price (not the market) is what's stuck; bring a comps-based counter.
Risks & watch-outs
- Climate carrying-cost: severe wind risk, 80% chance of damaging wind over 30y; extreme-heat days projected 7→20/yr by 2055 (HVAC capex compounding) — expect insurance premiums to compound above CPI over the hold.
Questions for the listing agent
- Is there a deadline driving the sale (1031 exchange, divorce, estate, relocation)? That informs how much negotiation room exists.
- Schools are A-rated — typically a magnet for longer-tenancy family renters. What's the average tenant stay here, and is there a school-zone premium baked into asking?
- What's the average days-on-market for RENTAL listings here right now (not sales)? A rising rental-DOM trend means longer vacancies and softer asking-rent achievability than the comps imply.
- What's the recent tenant-quality profile in this submarket — average credit score on applications, eviction rate, late-payment / NSF rate, and stable-employment percentage? A property-management company in the area should have these aggregated.
- How much new for-sale + rental construction is in the pipeline within 1–3 miles? Heavy new supply typically softens prices + rents 12–24 months out; constrained supply supports both.
Investment metrics
- 1% rule
- 1.04% ✓
- Cap rate
- 7.88%
- Cash-on-cash
- 5.68%
- DSCR
- 1.25
- GRM
- 8.0
CMA / ARV
- ARV (median comp)
- $272,939
- List price
- $234,900
- Delta
- -13.94%
- Verdict
- UNDERPRICED
- Comps
- 20 within 1.0 mi
Show comp detail 12 sales within ~0.75 mi
| Address | Dist | Beds/Ba | Sqft | Sold | Price | $/sf | Match |
|---|---|---|---|---|---|---|---|
| 559 Spring Hill Dr | 0.13mi | 3/2.0 | 1,542 (+5%) | 2mo | $274,900 | $178 | 84 |
| 231 Clark Farms Rd | 0.25mi | 3/2.0 | 1,488 (+1%) | 11mo | $190,000 | $128 | 77 |
| 209 Pine Pl | 0.34mi | 3/2.0 | 1,553 (+6%) | 3mo | $270,000 | $174 | 72 |
| 707 Spring Hill Dr | 0.21mi | 3/2.0 | 1,573 (+7%) | 12mo | $255,000 | $162 | 68 |
| 409 Mockingbird Ln | 0.11mi | 3/2.0 | 1,636 (+11%) | 9mo | $269,900 | $165 | 68 |
| 113 N Ridge Dr | 0.33mi | 3/2.0 | 1,578 (+8%) | 5mo | $272,000 | $172 | 68 |
| 820 Strawberry Pointe | 0.36mi | 3/2.0 | 1,443 (-2%) | 15mo | $255,000 | $177 | 68 |
| 332 South Place Dr | 0.45mi | 3/2.0 | 1,448 (-1%) | 12mo | $246,000 | $170 | 67 |
| 800 Strawberry Pointe | 0.41mi | 3/2.0 | 1,523 (+4%) | 11mo | $260,000 | $171 | 66 |
| 237 N Ridge Dr | 0.42mi | 3/2.0 | 1,541 (+5%) | 9mo | $250,000 | $162 | 65 |
| 418 Wildwood Pointe | 0.29mi | 3/2.0 | 1,670 (+14%) | 4mo | $293,000 | $175 | 60 |
| 352 South Pl | 0.52mi | 3/2.0 | 1,570 (+7%) | 11mo | $279,000 | $178 | 55 |
Match score weights: distance 35% · size 25% · config 20% · recency 20%. Top-matched comps best support the ARV.
Projected returns pro-forma
-3.0% appreciation · 2.61% rent growth · sell at horizon
- IRR
- -7.9%
- Equity multiple
- 0.71×
- Total profit
- $-19,153
- Equity at exit
- $35,024
- IRR
- 1.1%
- Equity multiple
- 1.08×
- Total profit
- $5,110
- Equity at exit
- $20,310
Cash invested: $65,772 (down + closing). Projections, not guarantees.
Landlord ↔ Tenant lean methodology
- Overall (STATE)
- 90 Strongly Landlord-Friendly
- State Mississippi
- 90 Strongly Landlord-Friendly · R+11
- County
- — inherits STATE
- City
- — inherits STATE
ZIP-level market 39110
- Home prices YoY
- -28.3%
- Rents YoY
- 2.6%
- Active inventory
- 634
- Price-to-rent
- 8.0×
Monthly cashflow live
- Estimated rent
- $2,449 medium interval (Pro) →
- Mortgage (P&I)
- −$1,232
- Tax est. 1.5%
- −$294 /mo · $3,524/yr
- Insurance
- −$98
- HOA
- −$0
- Vacancy / Maint / Mgmt
- −$514
- Net cashflow
- $311
Break-even live
Sensitivity live
| Price | -10% $474 | -5% $393 | +0% $311 | +5% $230 | +10% $149 |
|---|---|---|---|---|---|
| Rent | -10% $118 | -5% $215 | +0% $311 | +5% $408 | +10% $505 |
| Rate | -1.0pp $430 | -0.5pp $371 | base $311 | +0.5pp $251 | +1.0pp $189 |
UW: 25.0% down · 7.5% · 30yr · 1.5% tax · 5.0% vac · 8.0% maint · 8.0% mgmt
Financing live
Cash to close
- Down payment
- $58,725
- Closing costs
- $7,047
- Reserves months
- —
- Total cash needed
- —
Loan-product check · same deal, 3 products live
Conventional
25% down · 7.5% · 30yr
- Down + closing
- —
- Monthly P&I
- —
- Monthly cashflow
- —
- DSCR
- —
- Eligible?
- —
Personal DTI + credit; lowest rate.
DSCR
20% down · 8.5% · 30yr
- Down + closing
- —
- Monthly P&I
- —
- Monthly cashflow
- —
- DSCR
- —
- Eligible?
- —
No personal income docs; deal must DSCR.
Hard money
10% down · 12.0% · 12mo
- Down + closing
- —
- Monthly P&I
- —
- Monthly cashflow
- —
- DSCR
- —
- Eligible?
- —
Short-term bridge; refi at stabilization.
Listing history 11 events
-
2026-05-05status Pending 350-char remark
-
2026-04-30$234,900 Active 350-char remark
-
2025-09-22historical $1,945
-
2025-08-31$1,945
-
2024-08-16historical $1,895
-
2024-08-08price $1,895
-
2024-07-02$1,925
-
2020-05-14soldstatus 408-char remark
Show marketing remark (408 chars)
A steal in Madison County! Great location in a quite cul-de-sac in Hunters Pointe, this 3 bedroom, 2 bath home features beautiful flooring in the living room, dining room and kitchen, a two year old roof, lots of fresh paint, and the refrigerator, washer and dryer can remain with an acceptable offer. Located in the top-rated Madison School District! Call your REALTOR to see this home before it's too late.
-
2020-02-27$165,000 408-char remark
Show marketing remark (408 chars)
A steal in Madison County! Great location in a quite cul-de-sac in Hunters Pointe, this 3 bedroom, 2 bath home features beautiful flooring in the living room, dining room and kitchen, a two year old roof, lots of fresh paint, and the refrigerator, washer and dryer can remain with an acceptable offer. Located in the top-rated Madison School District! Call your REALTOR to see this home before it's too late.
-
2020-02-17historical
-
2019-11-03$167,000
ⓘ Source: listings_history table (triggers on properties + properties_extension) + one-shot
backfill from property_details.listing_events for pre-trigger history.
Climate risk First Street
- Flood 1/10 Low FEMA zone X (unshaded) · 0% chance over 30 yrs
- Wildfire 1/10 Low
- Heat 7/10 Severe 7 d/yr ≥108°F today · 20 d/yr by 30 yrs out
- Wind 8/10 Severe 80% chance of damaging wind over 30 yrs
- Air quality 2/10 Low 0 unhealthy d/yr today · 1 by 30 yrs out
Nearby sold comps map
Loading sold comps map…
Walkable amenities ~0.75 mi
Loading nearby amenities…
Taxation est. · year 1
- Rental income
- $29,388
- − Mortgage interest
- −$13,158
- − Property taxes
- −$3,524
- − Insurance
- −$1,174
- − Repairs & maintenance
- −$2,351
- − Management
- −$2,351
- − Depreciation
- −$6,833
- Taxable loss
- −$4
- Est. tax savings @ 24.0%
- +$1
- After-tax cash flow
- $3,737/yr
For passive investors: Depreciation is non-cash, so a rental often shows a tax loss while cash-flowing — sheltering income. Rental losses are passive: they offset passive income freely, and up to $25,000/yr can offset ordinary (W-2) income if you actively participate and your MAGI is under $100k (phasing out to $0 by $150k); unused losses carry forward. On sale, claimed depreciation is recaptured at up to 25%, and gains may owe capital-gains tax (a 1031 exchange can defer both). Figures are a year-1 estimate at your 24.0% rate — not tax advice; consult a CPA.
Condition & rehab AI · 12 photos
This move-in-ready home in a quiet cul-de-sac offers updated interiors and a well-maintained exterior, making it an attractive option for buyers and renters alike.
Value-add opportunities
- Resale paint exterior — enhances curb appeal
- Resale landscaping — improves curb appeal
- Both update countertops — increases both resale and rental value
Renovation cost estimate screening
Value-add ROI direction
- Resale paint exterior — enhances curb appeal ↑
- Resale landscaping — improves curb appeal ↑
- Both update countertops — increases both resale and rental value ↑
ⓘ Cost ranges are severity-bucket heuristics (US national rule-of-thumb). Get contractor quotes + a written scope before underwriting a rehab budget.
Schools (NCES district)
- District
- Madison County School District
- NCES district ID
- 2802790
- Math proficiency
- 54% ▼ -7.00%
- Reading proficiency
- 54% ▼ -7.00%
- Median HH income
- $70,579
- Composite
- 48.08/100
- National rank
- #2188
- State rank
- #3 of 130 in MS
Livability — Madison
- Score
- 81/100
- State rank
- #4
- US rank
- #1556
Category grades
Schools grade is shown separately in the Schools card above.
Census & demographics
- Census place
- Madison, MS
- County
- Madison County · 75,005 people
- City population
- 50,443
- Metro
- Jackson, MS
- Population (ZIP)
- 50,443
- Household income
- $125,506
- Rent vs Own
- Severe rent burden
- 227.0
Population outlook (Madison County) Hauer SSP2
- Today (2025)
- 122,509 people
- By 2030
- 131,737 · +7.5%
- By 2040
- 148,930 · +21.6%
- By 2050
- 164,300 · +34.1%
- By 2075
- 197,495 · +61.2%
- By 2100
- 211,429 · +72.6%
Race, ethnicity, and origin ACS 2023
- Neighborhood character
- Predominantly White (76%)
- Race & ethnicity
- White 76% Black 15% Asian 4% Two or more races 3% Hispanic / Latino 2%
- Common ancestry
- Italian 6% Slovak 3% Lithuanian 3%
- Foreign-born
- 5% · China, Canada
- Languages at home
- 92% English-only · Spanish 2% Other Indo-European 2% Chinese 1%
Political lean MEDSL · Madison
- 2024 margin
- R (+17.3) · D 40.8% · R 58.0% · Other 1.2%
- 2008→2024 swing
- -1.7pp toward R · 2008: -15.6pp · 2024: -17.3pp
- All cycles
- 2024: R+17.3 2020: R+11.8 2016: R+16.1 2012: R+15.7 2008: R+15.6
Not yet ingested
- Civics
- —
Market trends
- HPI YoY
- ▼ -60.99%
- Current HPI
- 154.6909
- Rent YoY
- ▲ 2.61%
- Metro
- Jackson, MS
- State GDP YoY
- —
- F500 in state
- 0
Price history
+40.7% since first listed12 events — show timeline
- 2026-05-29 Sold (MLS) — MLSU
- 2026-05-05 Pending — MLSU
- 2026-04-30 Listed $234,900 MLSU
- 2025-09-22 Rental Removed $1,945 RENTLY
- 2025-08-31 Listed for Rent $1,945 RENTLY
- 2024-08-16 Rental Removed $1,895 RENTLY
- 2024-08-08 Price Changed $1,895 RENTLY
- 2024-07-02 Listed for Rent $1,925 RENTLY
- 2020-05-14 Sold (MLS) — MLSU
- 2020-02-27 Listed $165,000 MLSU
- 2020-02-17 Listing Removed — MLSU
- 2019-11-03 Listed $167,000 MLSU
Cash-flow waterfall
monthlySold comps — $/sqft
last 12 mo · ≤1 miLoading sold comps…