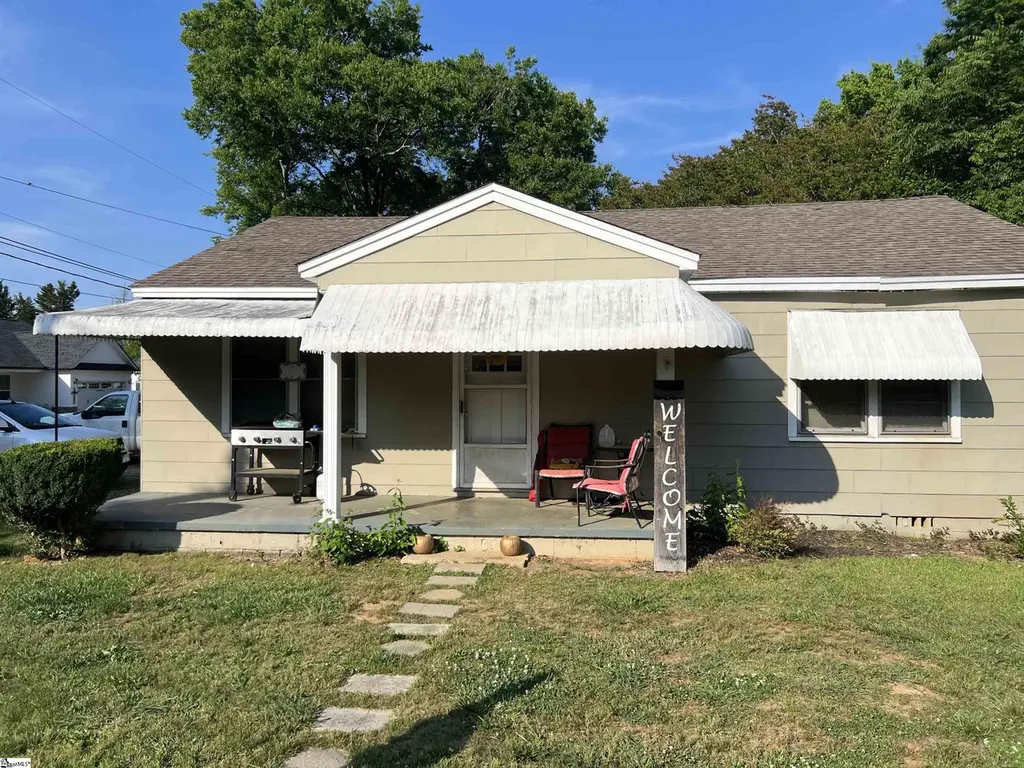
106 Dacus St · Williamston, SC
Flood risk 1/10 · Minimal
- FEMA flood zone
- X (unshaded)
- Chance of flooding over 30 yrs
- 0.0%
- Est. flood insurance / yr
- $507 – $1,088
Fire risk 4/10 · Minor
- Est. fire insurance / yr
- $783 – $1,453
Heat risk 6/10 · Moderate
- Hot days now (above 105°F)
- 7 days/yr
- Hot days in 30 yrs
- 17 days/yr
Wind risk 2/10 · Minimal
- Chance of severe wind over 30 yrs
- 4.0%
Air-quality risk 4/10 · Minor
- Unhealthy air days now
- 3 days/yr
- Unhealthy air days in 30 yrs
- 4 days/yr
Risk factors via First Street. Map © Google.
Why this score? — see what drove the B grade
The composite is a weighted blend of 9 inputs, each scored 0–100. Each bar is that input's sub-score; the figure is the points it added to the 100-point composite (weight × sub-score).
- Cash flow +30.0/30.0
- 1% rule +10.0/10.0
- DSCR +10.0/10.0
- ARV discount +7.5/15.0
- Schools +5.0/10.0
- Livability +3.6/5.0
- Rent growth +2.5/5.0
- Condition / age +2.5/5.0
- Appreciation +0.0/10.0
$79,500
🖨 Deal sheet 📄 Offer letter ✓ Due diligence
Listing remarks MLS
FIXER UPPER, IN THE HEART OF TOWN, ON NICE LEVEL CORNER LOT. This is a handyman's special and being sold AS IS with Cash, no financing. 2 bedroom, 1 bath, walkable to everything in town. Call Today To See All The Potential This Home Has in A Quiet Neighborhood on A Dead End Street.
Key facts
- Dead end street
- Level corner lot
- Quiet neighborhood
Tags
Property features AI
Finance
- Other: Lead-based paint disclosure required
- HOA & community: No HOA fees
Exterior
- Parking: Gravel driveway; No garage
- Utilities: Public water; Public sewer; Public garbage pickup; Electric water heater
- Home design: Single-story home; Approximate age: 50+ years; Crawl space foundation
- Construction: Asbestos shingle exterior; Composition shingle roof
- Exterior features: Front porch; Corner lot with some trees
Interior
- Kitchen: Kitchen (13 x 10); No appliances included
- Bedrooms: Primary bedroom on main level (16 x 13); Second bedroom on main level (13 x 11); Two bedrooms on the main level
- Flooring: Carpet; Hardwood; Vinyl
- Bathrooms: One full bathroom on the main level
- Heating & cooling: Heating: Other (see remarks); Cooling: Wall/window units; Electric water heater
- Interior features: Ceiling fan
- Laundry & utility: Laundry on first floor; Laundry in garage/storage
Neighborhood map
What this means for you Summary
Snapshot
- This is a 2-bed/1.0-bath other listed at $80k.
Deal economics
- At list price, monthly cash flow is $428 ($5k/yr) — positive.
- The deal already cash-flows at list — no discount required.
- Meets the 1% rule at list price ($1k rent vs $80k).
- Recommended offer: $78k (1.5% below list) — sets the bar for market timing.
- Cap rate 12.8% vs local median 1.7% in Williamston — top-decile yield for the area; either an underpriced asset or a hidden risk that comps aren't pricing in. Stress-test before assuming the spread holds.
Location & tenants
- Location reads 72/100 on livability (#43 in SC) — a middle-class / working-renter tenant base. Strengths: cost of living A+, housing A+, health & safety A+; Watch: employment D+, amenities D, crime F.
- Anderson 01 (rural): math 58% / reading 60% proficiency, ranked #3 of 80 in SC (top 4%) — acceptable for families but not a draw, mixed tenant base, ~2y average lease.
- Zoned schools: Palmetto Elementary (math 43% / reading 45%, grade F, #239 of 597 statewide, top 41%, 565 students, 84% FRL) — zoned schools average 84% FRL vs 35% district-wide (49 pts higher); higher-poverty schools than district average — tighter screening recommended.
- Zoned-school proficiency averages 44% at this address vs 59% district-wide (-15 pts) — the specific schools serving this property underperform the Anderson 01 average; the district grade overstates school quality for this exact location.
- Market conditions: 110 active listings in the ZIP; 2 comparable units currently listed for rent nearby; 1,255 units permitted in Anderson County in 2024 (0 in 5+ unit buildings).
Forward outlook
- Local home prices are declining (-3.0%/yr); year-one equity from $550 of loan paydown is wiped out by about $2k of value loss. Plan a longer hold.
- Anderson County population projected at +14% by 2050 — modest demand growth; plan on rents tracking national, not racing it.
- At projected returns (-3.0% appreciation + 3.0% rent growth), your $22k cash investment doubles in ~6 years — after that, you're playing with house money.
Negotiation context
- It's been on market 20 days — a 2% lower offer ($78k) is reasonable based on typical stale-listing flexibility.
- 2 sale attempts with the ask held roughly flat each time — persistent listings suggest the price (not the market) is what's stuck; bring a comps-based counter.
Risks & watch-outs
- Climate carrying-cost: extreme-heat days projected 7→17/yr by 2055 (HVAC capex compounding) — expect insurance premiums to compound above CPI over the hold.
Questions for the listing agent
- Is there a deadline driving the sale (1031 exchange, divorce, estate, relocation)? That informs how much negotiation room exists.
- Crime grade is F in this area — have there been break-ins, vandalism, or insurance claims at this property in the last 3 years? What carrier currently insures it and at what premium?
- What's the average days-on-market for RENTAL listings here right now (not sales)? A rising rental-DOM trend means longer vacancies and softer asking-rent achievability than the comps imply.
- What's the recent tenant-quality profile in this submarket — average credit score on applications, eviction rate, late-payment / NSF rate, and stable-employment percentage? A property-management company in the area should have these aggregated.
- How much new for-sale + rental construction is in the pipeline within 1–3 miles? Heavy new supply typically softens prices + rents 12–24 months out; constrained supply supports both.
Investment metrics
- 1% rule
- 1.60% ✓
- Cap rate
- 12.75%
- Cash-on-cash
- 23.07%
- DSCR
- 2.03
- GRM
- 5.2
CMA / ARV
No comps found within radius.
Projected returns pro-forma
-3.0% appreciation · 3.0% rent growth · sell at horizon
- IRR
- 16.1%
- Equity multiple
- 1.65×
- Total profit
- $14,406
- Equity at exit
- $11,854
- IRR
- 24.7%
- Equity multiple
- 3.15×
- Total profit
- $47,781
- Equity at exit
- $6,874
Cash invested: $22,260 (down + closing). Projections, not guarantees.
Landlord ↔ Tenant lean methodology
- Overall (STATE)
- 90 Strongly Landlord-Friendly
- State South Carolina
- 90 Strongly Landlord-Friendly · R+6
- County
- — inherits STATE
- City
- — inherits STATE
ZIP-level market 29697
- Home prices YoY
- -18.7%
- Active inventory
- 110
- Price-to-rent
- 5.2×
Monthly cashflow live
- Estimated rent
- $1,271 medium interval (Pro) →
- Mortgage (P&I)
- −$417
- Tax from tax record
- −$126 /mo · $1,515/yr
- Insurance
- −$33
- HOA
- −$0
- Vacancy / Maint / Mgmt
- −$267
- Net cashflow
- $428
Break-even live
UW: 25.0% down · 7.5% · 30yr · 1.5% tax · 5.0% vac · 8.0% maint · 8.0% mgmt
Financing live
Cash to close
- Down payment
- $19,875
- Closing costs
- $2,385
- Reserves months
- —
- Total cash needed
- —
Loan-product check · same deal, 3 products live
Conventional
25% down · 7.5% · 30yr
- Down + closing
- —
- Monthly P&I
- —
- Monthly cashflow
- —
- DSCR
- —
- Eligible?
- —
Personal DTI + credit; lowest rate.
DSCR
20% down · 8.5% · 30yr
- Down + closing
- —
- Monthly P&I
- —
- Monthly cashflow
- —
- DSCR
- —
- Eligible?
- —
No personal income docs; deal must DSCR.
Hard money
10% down · 12.0% · 12mo
- Down + closing
- —
- Monthly P&I
- —
- Monthly cashflow
- —
- DSCR
- —
- Eligible?
- —
Short-term bridge; refi at stabilization.
Rent comps 2 comps
| Address | Beds | Baths | Sqft | Rent | $/sqft | DOM | Units | Dist |
|---|---|---|---|---|---|---|---|---|
| 100 Williamston Ct Williamston, SC | 1.0–3.0 | 1.0–2.0 | 940 | $1,287 | $1.37 | 3d | 1 | 0.26mi |
| 602 Tripp St Williamston, SC | 2.0 | 1.0 | 1000 | $1,200 | $1.20 | 24d | 1 | 1.24mi |
Listing history 10 events
-
2026-06-10status $79,500 Pending 20 DOM
-
2026-06-09days on market $79,500 Contingency Contract 20 DOM
-
2026-06-08days on market $79,500 Contingency Contract 19 DOM
-
2026-06-07days on market $79,500 Contingency Contract 18 DOM
-
2026-06-03days on market $79,500 Contingency Contract 14 DOM
-
2026-06-03days on market $79,500 Contingency Contract 13 DOM
-
2026-06-01days on market $79,500 Contingency Contract 12 DOM
-
2026-05-31days on market $79,500 Contingency Contract 11 DOM
-
2026-05-18$79,500 Active 282-char remark
Show marketing remark (282 chars)
FIXER UPPER, IN THE HEART OF TOWN, ON NICE LEVEL CORNER LOT. This is a handyman's special and being sold AS IS with Cash, no financing. 2 bedroom, 1 bath, walkable to everything in town. Call Today To See All The Potential This Home Has in A Quiet Neighborhood on A Dead End Street.
-
2026-05-18$79,500 Active
Show marketing remark (282 chars)
FIXER UPPER, IN THE HEART OF TOWN, ON NICE LEVEL CORNER LOT. This is a handyman's special and being sold AS IS with Cash, no financing. 2 bedroom, 1 bath, walkable to everything in town. Call Today To See All The Potential This Home Has in A Quiet Neighborhood on A Dead End Street.
ⓘ Source: listings_history table (triggers on properties + properties_extension) + one-shot
backfill from property_details.listing_events for pre-trigger history.
Tax reassessment forecast SC · Resets to sale price
- Current annual tax
- $1,515 · $126/mo
- Projected year-2 tax
- $1,515 · $126/mo
- Expected delta
- $0/yr ($0/mo · 0.0%)
ⓘ Screening estimate from a state-policy table — verify with the county assessor before closing.
Climate risk First Street
- Flood 1/10 Low FEMA zone X (unshaded) · 0% chance over 30 yrs
- Wildfire 4/10 Moderate
- Heat 6/10 Major 7 d/yr ≥105°F today · 17 d/yr by 30 yrs out
- Wind 2/10 Low 4% chance of damaging wind over 30 yrs
- Air quality 4/10 Moderate 3 unhealthy d/yr today · 4 by 30 yrs out
Nearby sold comps map
Loading sold comps map…
Walkable amenities ~0.75 mi
Loading nearby amenities…
Taxation est. · year 1
- Rental income
- $15,253
- − Mortgage interest
- −$4,453
- − Property taxes
- −$1,515
- − Insurance
- −$398
- − Repairs & maintenance
- −$1,220
- − Management
- −$1,220
- − Depreciation
- −$2,313
- Taxable income
- $4,134
- Est. tax owed @ 24.0%
- −$992
- After-tax cash flow
- $4,142/yr
For passive investors: Depreciation is non-cash, so a rental often shows a tax loss while cash-flowing — sheltering income. Rental losses are passive: they offset passive income freely, and up to $25,000/yr can offset ordinary (W-2) income if you actively participate and your MAGI is under $100k (phasing out to $0 by $150k); unused losses carry forward. On sale, claimed depreciation is recaptured at up to 25%, and gains may owe capital-gains tax (a 1031 exchange can defer both). Figures are a year-1 estimate at your 24.0% rate — not tax advice; consult a CPA.
Schools (NCES district)
- District
- Anderson 01
- NCES district ID
- 4500780
- Math proficiency
- 58% ▼ -6.00%
- Reading proficiency
- 60% ▼ -1.00%
- Median HH income
- $52,196
- Composite
- 50.46/100
- National rank
- #1861
- State rank
- #3 of 80 in SC
Livability — Williamston
- Score
- 72/100
- State rank
- #43
- US rank
- #6133
Category grades
Schools grade is shown separately in the Schools card above.
Census & demographics
- Census place
- Williamston, SC
- Population (ZIP)
- 14,426
Population outlook (Anderson County) Hauer SSP2
- Today (2025)
- 210,546 people
- By 2030
- 217,791 · +3.4%
- By 2040
- 230,643 · +9.5%
- By 2050
- 240,220 · +14.1%
- By 2075
- 259,518 · +23.3%
- By 2100
- 258,696 · +22.9%
Race, ethnicity, and origin ACS 2023
- Neighborhood character
- Predominantly White (79%)
- Race & ethnicity
- White 79% Hispanic / Latino 10% Two or more races 7% Black 6%
- Hispanic origin (detail)
- Mexican 3%
- Common ancestry
- Serbian 4% Slovak 2% Lithuanian 2%
- Foreign-born
- 8% · Canada, Guatemala
- Languages at home
- 90% English-only · Spanish 9%
Political lean MEDSL · Anderson
- 2024 margin
- Solid R (+47.4) · D 25.7% · R 73.1% · Other 1.2%
- 2008→2024 swing
- -14.1pp toward R · 2008: -33.3pp · 2024: -47.4pp
- All cycles
- 2024: R+47.4 2020: R+42.0 2016: R+43.7 2012: R+36.4 2008: R+33.3
Not yet ingested
- Civics
- —
Market trends
- HPI YoY
- ▼ -60.07%
- Current HPI
- 260.8468
- Rent YoY
- —
- Metro
- —
- State GDP YoY
- ▲ 4.51%
- F500 in state
- 2
Industry mix (Fortune 500 HQ in SC)
| Industry | F500 HQs | Revenue |
|---|---|---|
| Packaging | 1 | $7B |
|
||
Price history
+0.0% since first listed2 events — show timeline
- 2026-05-18 Listed $79,500 Greater Greenville MLS
- 2026-05-18 Listed $79,500 WUMLS
Property tax history
+3.5%/yrLatest (2025): $1,515 · +13.9% YoY. Source: county tax records.
Cash-flow waterfall
monthlySold comps — $/sqft
last 12 mo · ≤1 miLoading sold comps…