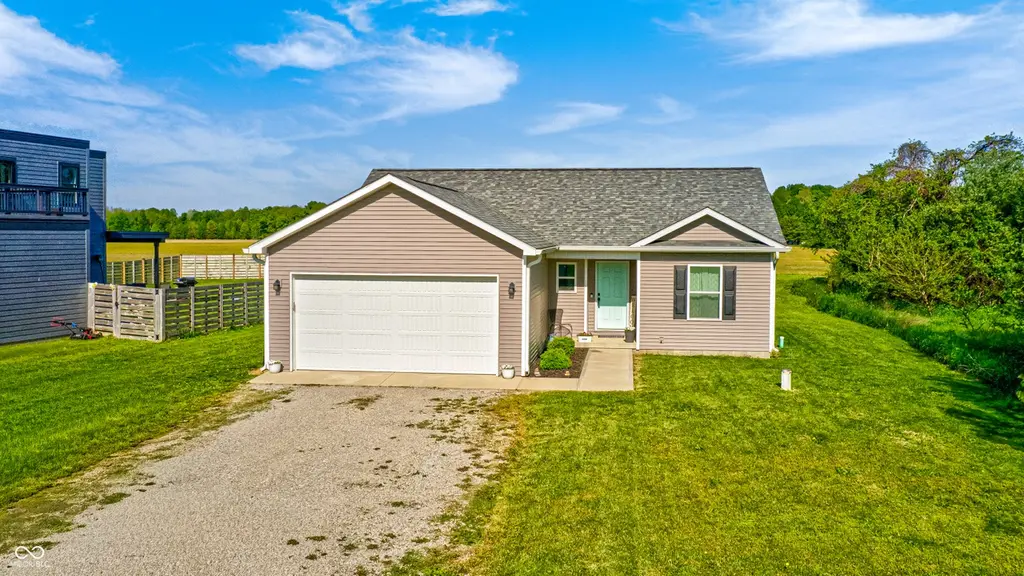
85 Patriots Lndg · Heritage Lake, IN
Flood risk 1/10 · Minimal
- FEMA flood zone
- X (unshaded)
- Chance of flooding over 30 yrs
- 0.0%
- Est. flood insurance / yr
- $507 – $1,088
Fire risk 1/10 · Minimal
- Est. fire insurance / yr
- $717 – $1,331
Heat risk 3/10 · Minor
- Hot days now (above 102°F)
- 7 days/yr
- Hot days in 30 yrs
- 18 days/yr
Wind risk 2/10 · Minimal
- Chance of severe wind over 30 yrs
- 1.0%
Air-quality risk 2/10 · Minimal
- Unhealthy air days now
- 0 days/yr
- Unhealthy air days in 30 yrs
- 1 days/yr
Risk factors via First Street. Map © Google.
Why this score? — see what drove the D grade
The composite is a weighted blend of 9 inputs, each scored 0–100. Each bar is that input's sub-score; the figure is the points it added to the 100-point composite (weight × sub-score).
- ARV discount +14.5/15.0
- Appreciation +7.5/10.0
- Cash flow +5.6/30.0
- Schools +4.1/10.0
- Livability +3.3/5.0
- Rent growth +2.5/5.0
- Condition / age +2.5/5.0
- 1% rule +0.0/10.0
- DSCR +0.0/10.0
$240,000
🖨 Deal sheet (PDF) 📄 Offer letter ✓ Due diligence
Listing remarks MLS
Nice lot in the Patriots Landing Neighborhood of Heritage Lake. Build your dream home or as a property owner acquire the right to enjoy Heritage Lake amenities like fishing, swimming and boating. Bring your boat with you or rent marina space. Camp grounds is an option for overnight stays. Great opportunity to begin a legacy of lake memories for your family!
Key facts
- Open-plan kitchen
- Inviting patio
- Private yard
Tags
Property features AI
Exterior
- Parking: Attached garage; 2-car garage (about 400 sq ft)
- Utilities: Community sewer; Private water
- Home design: Single-family residence; One level
- Construction: Vinyl siding; Block foundation
- Exterior features: Patio; Front porch; No fence; Approximately 0.32-acre lot (1/4–1/2 acre)
Interior
- Kitchen: Dishwasher; Microwave; Electric oven; Garbage disposal; Eat-in kitchen
- Bedrooms: Three main-level bedrooms; Primary bedroom with walk-in closet
- Bathrooms: Two full bathrooms (both on main level)
- Heating & cooling: Electric forced air heating; Central air conditioning
- Interior features: Cathedral ceilings; Eat-in kitchen; Walk-in closet(s); Living room (approx. 17 x 14); Additional main-level room (approx. 16 x 12)
- Laundry & utility: Main-level laundry (approx. 6 x 6); Dryer; Electric water heater
Neighborhood map
What this means for you Summary
Snapshot
- This is a 3-bed/2.0-bath single-family listed at $240k.
Deal economics
- At list price, monthly cash flow is $-498 ($-6k/yr) — negative.
- To cash-flow at today's rent, offer at most $152k (36.6% below list).
- To meet the 1% rule (rent ≥ 1% of price), the offer needs to be $119k (50.5% below list).
- Recommended offer: $119k (50.5% below list) — sets the bar for 1% rule.
Location & tenants
- Location reads 66/100 on livability (#294 in IN) — a middle-class / working-renter tenant base. Strengths: crime A+, cost of living A+, housing A+; Watch: amenities F, commute F, health & safety F.
- North Putnam Community Schools (rural): math 47% / reading 48% proficiency, ranked #73 of 301 in IN (top 24%) — families likely to look elsewhere, expect single-tenant / working-renter base with shorter leases.
- Zoned schools: Bainbridge Elementary School (math 62% / reading 47%, grade C, #197 of 994 statewide, top 22%, 419 students, 52% FRL); North Putnam Middle School (math 38% / reading 42%, grade F, #120 of 330 statewide, top 37%, 309 students, 52% FRL); North Putnam Sr High School (math 52% / reading 67%, grade C+, #49 of 369 statewide, top 16%, 437 students, 43% FRL).
- Market conditions: 13 active listings in the ZIP; 166 units permitted in Putnam County in 2024 (0 in 5+ unit buildings).
Forward outlook
- In year one you build about $14k of equity ($2k loan paydown + $12k appreciation (5.1% local appreciation)).
- Putnam County population projected to shrink 8% by 2050 — rents likely to lag national; underwrite the cash flow, not the appreciation.
- By year 3, paydown + projected appreciation supports a ~$34k cash-out refi (75% LTV) — recoverable capital for the next deal without selling this one.
Negotiation context
- Only 3 days on market — expect competitive offers; lowballing is unlikely to land.
- 3 sale attempts since 12y ago with the ask held roughly flat each time — persistent listings suggest the price (not the market) is what's stuck; bring a comps-based counter.
- Current owner paid $5k; list at $240k implies a 4705% gain — meaningful room to come down on a strong offer.
Questions for the listing agent
- What do current leases actually rent for vs. the listed asking? Can we see a recent rent roll and the last 12 months of T-12 income?
- Is there a deadline driving the sale (1031 exchange, divorce, estate, relocation)? That informs how much negotiation room exists.
- Schools are D-rated, which usually means shorter tenancies and higher turnover. Who's the typical renter profile here, and what's been the actual vacancy rate?
- The area grade is low — what's the realistic commute time and amenity access for the typical tenant pool here? Any planned neighborhood developments (good or bad) we should know about?
- What's the average days-on-market for RENTAL listings here right now (not sales)? A rising rental-DOM trend means longer vacancies and softer asking-rent achievability than the comps imply.
- What's the recent tenant-quality profile in this submarket — average credit score on applications, eviction rate, late-payment / NSF rate, and stable-employment percentage? A property-management company in the area should have these aggregated.
- How much new for-sale + rental construction is in the pipeline within 1–3 miles? Heavy new supply typically softens prices + rents 12–24 months out; constrained supply supports both.
Investment metrics
- 1% rule
- 0.49% ✗
- Cap rate
- 3.80%
- Cash-on-cash
- -8.89%
- DSCR
- 0.60
- GRM
- 16.8
CMA / ARV
- ARV (median comp)
- $284,286
- List price
- $240,000
- Delta
- -15.58%
- Verdict
- UNDERPRICED
- Comps
- 20 within 1.0 mi
Show comp detail 1 sale within ~0.75 mi
| Address | Dist | Beds/Ba | Sqft | Sold | Price | $/sf | Match |
|---|---|---|---|---|---|---|---|
| 169 Patriots Lndg | 0.51mi | 3/2.0 | 1,336 (+14%) | 19mo | $281,500 | $211 | 38 |
Match score weights: distance 35% · size 25% · config 20% · recency 20%. Top-matched comps best support the ARV.
Projected returns pro-forma
5.1% appreciation · 3.0% rent growth · sell at horizon
- IRR
- 5.7%
- Equity multiple
- 1.37×
- Total profit
- $24,812
- Equity at exit
- $137,396
- IRR
- 8.0%
- Equity multiple
- 2.51×
- Total profit
- $101,621
- Equity at exit
- $238,285
Cash invested: $67,200 (down + closing). Projections, not guarantees.
Landlord ↔ Tenant lean methodology
- Overall (STATE)
- 90 Strongly Landlord-Friendly
- State Indiana
- 90 Strongly Landlord-Friendly · R+11
- County
- — inherits STATE
- City
- — inherits STATE
ZIP-level market 46128
- Home prices YoY
- 2.1%
- Active inventory
- 13
- Price-to-rent
- 16.8×
Monthly cashflow live
- Estimated rent
- $1,187 medium interval (Pro) →
- Mortgage (P&I)
- −$1,259
- Tax from tax record
- −$77 /mo · $926/yr
- Insurance
- −$100
- HOA
- −$0
- Vacancy / Maint / Mgmt
- −$249
- Net cashflow
- $-498
Break-even live
Sensitivity live
| Price | -10% $-362 | -5% $-430 | +0% $-498 | +5% $-566 | +10% $-633 |
|---|---|---|---|---|---|
| Rent | -10% $-591 | -5% $-545 | +0% $-498 | +5% $-451 | +10% $-404 |
| Rate | -1.0pp $-377 | -0.5pp $-437 | base $-498 | +0.5pp $-560 | +1.0pp $-623 |
UW: 25.0% down · 7.5% · 30yr · 1.5% tax · 5.0% vac · 8.0% maint · 8.0% mgmt
Financing live
Cash to close
- Down payment
- $60,000
- Closing costs
- $7,200
- Reserves months
- —
- Total cash needed
- —
Loan-product check · same deal, 3 products live
Conventional
25% down · 7.5% · 30yr
- Down + closing
- —
- Monthly P&I
- —
- Monthly cashflow
- —
- DSCR
- —
- Eligible?
- —
Personal DTI + credit; lowest rate.
DSCR
20% down · 8.5% · 30yr
- Down + closing
- —
- Monthly P&I
- —
- Monthly cashflow
- —
- DSCR
- —
- Eligible?
- —
No personal income docs; deal must DSCR.
Hard money
10% down · 12.0% · 12mo
- Down + closing
- —
- Monthly P&I
- —
- Monthly cashflow
- —
- DSCR
- —
- Eligible?
- —
Short-term bridge; refi at stabilization.
Listing history 6 events
-
2026-05-17status Pending 992-char remark
-
2026-05-14$240,000 Active 992-char remark
-
2018-06-15soldstatus $4,995 359-char remark
Show marketing remark (359 chars)
Nice lot in the Patriots Landing Neighborhood of Heritage Lake. Build your dream home or as a property owner acquire the right to enjoy Heritage Lake amenities like fishing, swimming and boating. Bring your boat with you or rent marina space. Camp grounds is an option for overnight stays. Great opportunity to begin a legacy of lake memories for your family!
-
2017-04-17$4,995 359-char remark
Show marketing remark (359 chars)
Nice lot in the Patriots Landing Neighborhood of Heritage Lake. Build your dream home or as a property owner acquire the right to enjoy Heritage Lake amenities like fishing, swimming and boating. Bring your boat with you or rent marina space. Camp grounds is an option for overnight stays. Great opportunity to begin a legacy of lake memories for your family!
-
2015-02-18historical
-
2014-08-18$3,990
ⓘ Source: listings_history table (triggers on properties + properties_extension) + one-shot
backfill from property_details.listing_events for pre-trigger history.
Tax reassessment forecast IN · Partial reset (capped growth)
- Current annual tax
- $926 · $77/mo
- Projected year-2 tax
- $1,483 · $124/mo
- Expected delta
- +$557/yr (+$46/mo · 60.2%)
ⓘ Screening estimate from a state-policy table — verify with the county assessor before closing.
Climate risk First Street
- Flood 1/10 Low FEMA zone X (unshaded) · 0% chance over 30 yrs
- Wildfire 1/10 Low
- Heat 3/10 Moderate 7 d/yr ≥102°F today · 18 d/yr by 30 yrs out
- Wind 2/10 Low 100% chance of damaging wind over 30 yrs
- Air quality 2/10 Low 0 unhealthy d/yr today · 1 by 30 yrs out
Nearby sold comps map
Loading sold comps map…
Walkable amenities ~0.75 mi
Loading nearby amenities…
Taxation est. · year 1
- Rental income
- $14,250
- − Mortgage interest
- −$13,444
- − Property taxes
- −$926
- − Insurance
- −$1,200
- − Repairs & maintenance
- −$1,140
- − Management
- −$1,140
- − Depreciation
- −$6,982
- Taxable loss
- −$10,581
- Est. tax savings @ 24.0%
- +$2,540
- After-tax cash flow
- $-3,432/yr
For passive investors: Depreciation is non-cash, so a rental often shows a tax loss while cash-flowing — sheltering income. Rental losses are passive: they offset passive income freely, and up to $25,000/yr can offset ordinary (W-2) income if you actively participate and your MAGI is under $100k (phasing out to $0 by $150k); unused losses carry forward. On sale, claimed depreciation is recaptured at up to 25%, and gains may owe capital-gains tax (a 1031 exchange can defer both). Figures are a year-1 estimate at your 24.0% rate — not tax advice; consult a CPA.
Schools (NCES district)
- District
- North Putnam Community Schools
- NCES district ID
- 1807980
- Math proficiency
- 47% ▼ -12.00%
- Reading proficiency
- 48% ▼ -8.00%
- Median HH income
- $54,825
- Composite
- 41.18/100
- National rank
- #3549
- State rank
- #73 of 301 in IN
Livability — Heritage Lake
- Score
- 66/100
- State rank
- #294
- US rank
- #11904
Category grades
Schools grade is shown separately in the Schools card above.
Census & demographics
- Census place
- Heritage Lake, IN
- Population (ZIP)
- 2,319
Population outlook (Putnam County) Hauer SSP2
- Today (2025)
- 37,226 people
- By 2030
- 36,723 · -1.4%
- By 2040
- 35,407 · -4.9%
- By 2050
- 34,177 · -8.2%
- By 2075
- 32,038 · -13.9%
- By 2100
- 28,380 · -23.8%
Race, ethnicity, and origin ACS 2023
- Neighborhood character
- Predominantly White (84%)
- Race & ethnicity
- White 84% Hispanic / Latino 9% Two or more races 7%
- Hispanic origin (detail)
- Mexican 2%
- Common ancestry
- Scottish 6% Serbian 3% Romanian 1%
- Foreign-born
- 5% · Canada
- Languages at home
- 91% English-only · Spanish 9%
Political lean MEDSL · Putnam
- 2024 margin
- Solid R (+52.0) · D 23.1% · R 75.1% · Other 1.8%
- 2008→2024 swing
- -40.0pp toward R · 2008: -12.0pp · 2024: -52.0pp
- All cycles
- 2024: R+52.0 2020: R+50.2 2016: R+49.6 2012: R+32.6 2008: R+12.0
Not yet ingested
- Civics
- —
Market trends
- HPI YoY
- ▲ 5.10%
- Current HPI
- 243.159
- Rent YoY
- —
- Metro
- —
- State GDP YoY
- ▲ 2.90%
- F500 in state
- 18
Industry mix (Fortune 500 HQ in IN)
| Industry | F500 HQs | Revenue |
|---|---|---|
| Industrial Machinery | 2 | $37B |
|
||
| Healthcare | 1 | $177B |
|
||
| Pharmaceuticals | 1 | $45B |
|
||
| Metals / Steel | 1 | $18B |
|
||
| Agriculture | 1 | $17B |
|
||
| Packaging | 1 | $12B |
|
||
Price history
+5915.0% since first listed6 events — show timeline
- 2026-05-17 Pending — MIBOR as Distributed by MLS Grid
- 2026-05-14 Listed $240,000 MIBOR as Distributed by MLS Grid
- 2018-06-15 Sold (MLS) $4,995 MIBOR as Distributed by MLS Grid
- 2017-04-17 Listed $4,995 MIBOR as Distributed by MLS Grid
- 2015-02-18 Listing Removed — MIBOR as Distributed by MLS Grid
- 2014-08-18 Listed $3,990 MIBOR as Distributed by MLS Grid
Property tax history
+29.0%/yrLatest (2024): $926 · +29.1% YoY. Source: county tax records.
Cash-flow waterfall
monthlySold comps — $/sqft
last 12 mo · ≤1 miLoading sold comps…