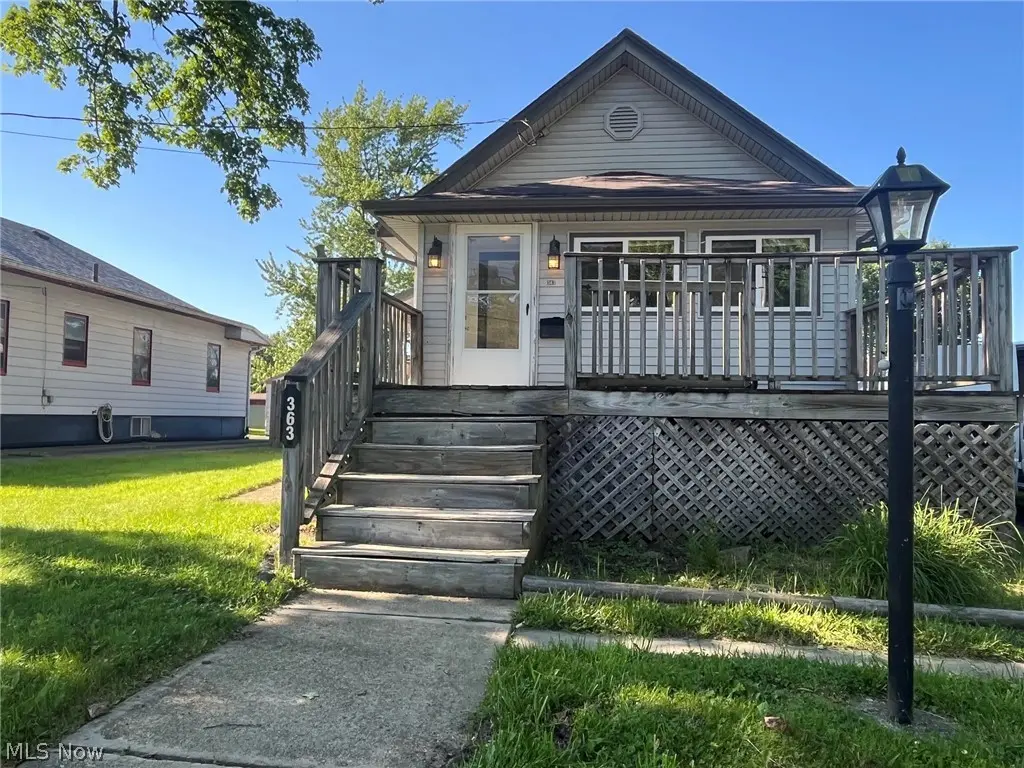
363 Spring St · Struthers, OH
Flood risk 1/10 · Minimal
- FEMA flood zone
- X (unshaded)
- Chance of flooding over 30 yrs
- 0.0%
- Est. flood insurance / yr
- $473 – $860
Fire risk 1/10 · Minimal
- Est. fire insurance / yr
- $713 – $1,323
Heat risk 3/10 · Minor
- Hot days now (above 97°F)
- 7 days/yr
- Hot days in 30 yrs
- 17 days/yr
Wind risk 1/10 · Minimal
- Chance of severe wind over 30 yrs
- —
Air-quality risk 3/10 · Minor
- Unhealthy air days now
- 1 days/yr
- Unhealthy air days in 30 yrs
- 4 days/yr
Risk factors via First Street. Map © Google.
Why this score? — see what drove the B+ grade
The composite is a weighted blend of 9 inputs, each scored 0–100. Each bar is that input's sub-score; the figure is the points it added to the 100-point composite (weight × sub-score).
- Cash flow +30.0/30.0
- ARV discount +15.0/15.0
- DSCR +10.0/10.0
- 1% rule +8.1/10.0
- Schools +4.0/10.0
- Livability +3.6/5.0
- Appreciation +2.9/10.0
- Rent growth +2.5/5.0
- Condition / age +2.5/5.0
$77,877
🖨 Deal sheet (PDF) 📄 Offer letter ✓ Due diligence
Listing remarks MLS
This one story home features 2 bedrooms, living room, formal dining room, extra room, full basement, large back yard
Key facts
- Foyer
- Kitchen
- Living room
Tags
Property features AI
Exterior
- Parking: Detached garage; Driveway; Garage (1 car)
- Utilities: Public water; Public sewer
- Home design: Single-story; Faces south
- Construction: Built as of appraiser records; Asphalt and block construction; Asphalt/fiberglass roof
- Exterior features: Private yard; Fire pit; Back yard; City lot
Interior
- Kitchen: Range
- Bedrooms: 2 main-level bedrooms
- Bathrooms: 1 full bathroom (main level)
- Heating & cooling: Forced-air heating; Gas heating
- Interior features: Ceiling fans; High ceilings; Laminate counters; Double-pane windows; Full basement
- Laundry & utility: Laundry in basement
Neighborhood map
What this means for you Summary
Snapshot
- This is a 2-bed/1.0-bath single-family listed at $78k.
Deal economics
- At list price, monthly cash flow is $294 ($4k/yr) — positive.
- The deal already cash-flows at list — no discount required.
- Meets the 1% rule at list price ($1k rent vs $78k).
- Cap rate 10.8% vs local median 6.4% in Struthers — top-decile yield for the area; either an underpriced asset or a hidden risk that comps aren't pricing in. Stress-test before assuming the spread holds.
Location & tenants
- Location reads 71/100 on livability (#418 in OH) — a middle-class / working-renter tenant base. Strengths: cost of living A+, housing A+, crime B; Watch: commute C-, amenities F, employment F.
- Struthers City (suburban): math 45% / reading 52% proficiency, ranked #475 of 656 in OH (top 72%) — families likely to look elsewhere, expect single-tenant / working-renter base with shorter leases.
- Market conditions: 66 active listings in the ZIP; 8 comparable units currently listed for rent nearby; rentals at typical pace (median 22d on market — plan ~3-4 weeks tenant-placement turnaround); 147 units permitted in Mahoning County in 2024 (0 in 5+ unit buildings).
Forward outlook
- Local home prices are declining (-3.0%/yr); year-one equity from $539 of loan paydown is wiped out by about $2k of value loss. Plan a longer hold.
- Mahoning County population projected at -14% by 2050 — secular population decline; favor cash flow + early exit over multi-decade hold.
- At projected returns (-3.0% appreciation + 3.0% rent growth), your $22k cash investment doubles in ~8 years — after that, you're playing with house money.
Negotiation context
- Only 4 days on market — expect competitive offers; lowballing is unlikely to land.
- 5 sale attempts since 22y ago with the ask held roughly flat each time — persistent listings suggest the price (not the market) is what's stuck; bring a comps-based counter.
- Current owner paid $29k; list at $78k implies a 169% gain — meaningful room to come down on a strong offer.
Risks & watch-outs
- Watch-outs: built in 1923 — expect roof / HVAC / electrical / plumbing capex.
Questions for the listing agent
- Built in 1923 — when were the roof, HVAC, electrical panel, plumbing, and water heater last replaced?
- Is there a deadline driving the sale (1031 exchange, divorce, estate, relocation)? That informs how much negotiation room exists.
- Schools are B-rated — typically a magnet for longer-tenancy family renters. What's the average tenant stay here, and is there a school-zone premium baked into asking?
- What's the average days-on-market for RENTAL listings here right now (not sales)? A rising rental-DOM trend means longer vacancies and softer asking-rent achievability than the comps imply.
- What's the recent tenant-quality profile in this submarket — average credit score on applications, eviction rate, late-payment / NSF rate, and stable-employment percentage? A property-management company in the area should have these aggregated.
- How much new for-sale + rental construction is in the pipeline within 1–3 miles? Heavy new supply typically softens prices + rents 12–24 months out; constrained supply supports both.
Investment metrics
- 1% rule
- 1.31% ✓
- Cap rate
- 10.82%
- Cash-on-cash
- 16.16%
- DSCR
- 1.72
- GRM
- 6.3
CMA / ARV
- ARV (on-the-fly)
- $116,760
- Comps found
- 9
Show comp detail 9 sales within ~0.75 mi
| Address | Dist | Beds/Ba | Sqft | Sold | Price | $/sf | Match |
|---|---|---|---|---|---|---|---|
| 608 Maplewood Ave | 0.47mi | 3/1.0 (+1) | 864 (+3%) | 6mo | $120,000 | $139 | 63 |
| 297 Overlook Blvd | 0.37mi | 3/1.0 (+1) | 832 (-1%) | 19mo | $92,700 | $111 | 60 |
| 2541 W Manor Ave | 0.71mi | 2/1.0 | 832 (-1%) | 7mo | $130,000 | $156 | 60 |
| 610 Elm St | 0.47mi | 3/1.0 (+1) | 768 (-9%) | 1mo | $109,000 | $142 | 58 |
| 521 6th St | 0.31mi | 2/2.0 | 750 (-11%) | 9mo | $119,900 | $160 | 56 |
| 724 8th St | 0.15mi | 3/1.0 (+1) | 960 (+14%) | 11mo | $130,000 | $135 | 55 |
| 231 Overlook Blvd | 0.41mi | 3/2.0 (+1) | 960 (+14%) | 8mo | $154,000 | $160 | 42 |
| 4812 Irma Ave | 0.72mi | 2/1.0 | 960 (+14%) | 9mo | $128,000 | $133 | 35 |
| 180 Poland Ave | 0.71mi | 3/1.5 (+1) | 952 (+13%) | 6mo | $57,300 | $60 | 33 |
Match score weights: distance 35% · size 25% · config 20% · recency 20%. Top-matched comps best support the ARV.
Projected returns pro-forma
-3.0% appreciation · 3.0% rent growth · sell at horizon
- IRR
- 7.1%
- Equity multiple
- 1.28×
- Total profit
- $6,080
- Equity at exit
- $11,612
- IRR
- 16.5%
- Equity multiple
- 2.35×
- Total profit
- $29,376
- Equity at exit
- $6,733
Cash invested: $21,806 (down + closing). Projections, not guarantees.
Landlord ↔ Tenant lean methodology
- Overall (STATE)
- 73 Landlord-Friendly
- State Ohio
- 73 Landlord-Friendly · R+6
- County
- — inherits STATE
- City
- — inherits STATE
ZIP-level market 44471
- Home prices YoY
- -1.5%
- Active inventory
- 66
- Price-to-rent
- 6.3×
Monthly cashflow live
- Estimated rent
- $1,024 high interval (Pro) →
- Mortgage (P&I)
- −$408
- Tax from tax record
- −$74 /mo · $892/yr
- Insurance
- −$32
- HOA
- −$0
- Vacancy / Maint / Mgmt
- −$215
- Net cashflow
- $294
Break-even live
Sensitivity live
| Price | -10% $338 | -5% $316 | +0% $294 | +5% $272 | +10% $249 |
|---|---|---|---|---|---|
| Rent | -10% $213 | -5% $253 | +0% $294 | +5% $334 | +10% $374 |
| Rate | -1.0pp $333 | -0.5pp $313 | base $294 | +0.5pp $273 | +1.0pp $253 |
UW: 25.0% down · 7.5% · 30yr · 1.5% tax · 5.0% vac · 8.0% maint · 8.0% mgmt
Financing live
Cash to close
- Down payment
- $19,469
- Closing costs
- $2,336
- Reserves months
- —
- Total cash needed
- —
Loan-product check · same deal, 3 products live
Conventional
25% down · 7.5% · 30yr
- Down + closing
- —
- Monthly P&I
- —
- Monthly cashflow
- —
- DSCR
- —
- Eligible?
- —
Personal DTI + credit; lowest rate.
DSCR
20% down · 8.5% · 30yr
- Down + closing
- —
- Monthly P&I
- —
- Monthly cashflow
- —
- DSCR
- —
- Eligible?
- —
No personal income docs; deal must DSCR.
Hard money
10% down · 12.0% · 12mo
- Down + closing
- —
- Monthly P&I
- —
- Monthly cashflow
- —
- DSCR
- —
- Eligible?
- —
Short-term bridge; refi at stabilization.
Rent comps 8 comps
| Address | Beds | Baths | Sqft | Rent | $/sqft | DOM | Units | Dist |
|---|---|---|---|---|---|---|---|---|
| 610 Elm St Struthers, OH | 3.0 | 1.0 | 1050 | $1,500 | $1.43 | 13d | 1 | 0.46mi |
| 2523 E Midlothian Blvd Apt 5 Struthers, OH | 2.0 | 1.0 | 750 | $800 | $1.07 | 14d | 1 | 0.55mi |
| 61 Crescent Dr Struthers, OH | 2.0 | 1.0 | 670 | $650 | $0.97 | 14d | 1 | 0.67mi |
| 2002 Brownlee Ave Youngstown, OH | 1.0 | 1.0 | 820 | $875 | $1.07 | 44d | 1 | 0.75mi |
| 1914 S Heights Ave Youngstown, OH | 3.0 | 1.0 | 1115 | $1,950 | $1.75 | 44d | 1 | 0.99mi |
| 1803 Pointview Ave Youngstown, OH | 2.0 | 1.0 | 950 | $1,000 | $1.05 | 44d | 1 | 1.09mi |
| 2063 Wolosyn Cir Unit 1 Poland, OH | 1.0 | 1.5 | 705 | $800 | $1.13 | 21d | 1 | 1.11mi |
| 240 Center St #3 Struthers, OH | 2.0 | 1.0 | 855 | $600 | $0.70 | 13d | 1 | 1.25mi |
Listing history 4 events
-
2026-06-09status $77,877 Pending 4 DOM
-
2026-06-08days on market $77,877 Active 4 DOM
-
2026-06-07remarks 699-char remark
-
2026-06-07$77,877 Active 3 DOM
ⓘ Source: listings_history table (triggers on properties + properties_extension) + one-shot
backfill from property_details.listing_events for pre-trigger history.
Tax reassessment forecast OH · Partial reset (capped growth)
- Current annual tax
- $892 · $74/mo
- Projected year-2 tax
- $1,054 · $88/mo
- Expected delta
- +$161/yr (+$13/mo · 18.1%)
ⓘ Screening estimate from a state-policy table — verify with the county assessor before closing.
Climate risk First Street
- Flood 1/10 Low FEMA zone X (unshaded) · 0% chance over 30 yrs
- Wildfire 1/10 Low
- Heat 3/10 Moderate 7 d/yr ≥97°F today · 17 d/yr by 30 yrs out
- Wind 1/10 Low
- Air quality 3/10 Moderate 1 unhealthy d/yr today · 4 by 30 yrs out
Nearby sold comps map
Loading sold comps map…
Walkable amenities ~0.75 mi
Loading nearby amenities…
Taxation est. · year 1
- Rental income
- $12,285
- − Mortgage interest
- −$4,362
- − Property taxes
- −$892
- − Insurance
- −$389
- − Repairs & maintenance
- −$983
- − Management
- −$983
- − Depreciation
- −$2,266
- Taxable income
- $2,410
- Est. tax owed @ 24.0%
- −$578
- After-tax cash flow
- $2,944/yr
For passive investors: Depreciation is non-cash, so a rental often shows a tax loss while cash-flowing — sheltering income. Rental losses are passive: they offset passive income freely, and up to $25,000/yr can offset ordinary (W-2) income if you actively participate and your MAGI is under $100k (phasing out to $0 by $150k); unused losses carry forward. On sale, claimed depreciation is recaptured at up to 25%, and gains may owe capital-gains tax (a 1031 exchange can defer both). Figures are a year-1 estimate at your 24.0% rate — not tax advice; consult a CPA.
Schools (NCES district)
- District
- Struthers City
- NCES district ID
- 3904485
- Math proficiency
- 45% ▼ -12.00%
- Reading proficiency
- 52% ▼ -8.00%
- Median HH income
- $37,753
- Composite
- 40.35/100
- National rank
- #3742
- State rank
- #475 of 656 in OH
Livability — Struthers
- Score
- 71/100
- State rank
- #418
- US rank
- #6867
Category grades
Schools grade is shown separately in the Schools card above.
Census & demographics
- Census place
- Struthers, OH
- County
- Mahoning · 224,175 people
- City population
- 10,296
- Metro
- Youngstown-Warren, OH
- Population (ZIP)
- 10,296
- Household income
- $52,811
- Rent vs Own
- Severe rent burden
- 12.2
Population outlook (Mahoning County) Hauer SSP2
- Today (2025)
- 223,932 people
- By 2030
- 218,387 · -2.5%
- By 2040
- 205,367 · -8.3%
- By 2050
- 193,606 · -13.5%
- By 2075
- 173,694 · -22.4%
- By 2100
- 151,147 · -32.5%
Race, ethnicity, and origin ACS 2023
- Neighborhood character
- Predominantly White (82%)
- Race & ethnicity
- White 82% Hispanic / Latino 8% Two or more races 8% Black 4% Asian 1%
- Hispanic origin (detail)
- Mexican 2% Puerto Rican 5%
- Common ancestry
- Romanian 8% Lithuanian 4% Slovak 1%
- Foreign-born
- 2% · Canada
- Languages at home
- 94% English-only · Spanish 4% Arabic 1% Other Indo-European 1%
Political lean MEDSL · Mahoning
- 2024 margin
- Lean R (+9.4) · D 44.9% · R 54.4%
- 2008→2024 swing
- -36.1pp toward R · 2008: 26.6pp · 2024: -9.4pp
- All cycles
- 2024: R+9.4 2020: R+1.9 2016: D+3.0 2012: D+27.7 2008: D+26.6
Not yet ingested
- Civics
- —
Market trends
- HPI YoY
- ▼ -4.12%
- Current HPI
- 274.6394
- Rent YoY
- —
- Metro
- —
- State GDP YoY
- ▲ 1.98%
- F500 in state
- 48
Industry mix (Fortune 500 HQ in OH)
| Industry | F500 HQs | Revenue |
|---|---|---|
| Insurance | 3 | $145B |
|
||
| Industrial Machinery | 3 | $49B |
|
||
| Financial Services | 3 | $24B |
|
||
| Consumer Goods | 2 | $93B |
|
||
| Aerospace / Defense | 2 | $47B |
|
||
| Utilities | 2 | $33B |
|
||
Price history
+53.0% since first listed9 events — show timeline
- 2026-06-04 Listed $77,877 MLSNOW
- 2021-01-04 Listing Removed — MLSNOW
- 2021-01-02 Relisted — MLSNOW
- 2020-02-18 Listing Removed — MLSNOW
- 2020-02-18 Listed $52,000 MLSNOW
- 2006-06-02 Sold (MLS) $28,900 MLSNOW
- 2006-04-09 Listed $28,900 MLSNOW
- 2005-02-22 Listing Removed — MLSNOW
- 2004-02-23 Listed $50,900 MLSNOW
Property tax history
+2.7%/yrLatest (2025): $892 · -0.0% YoY. Source: county tax records.
Cash-flow waterfall
monthlySold comps — $/sqft
last 12 mo · ≤1 miLoading sold comps…