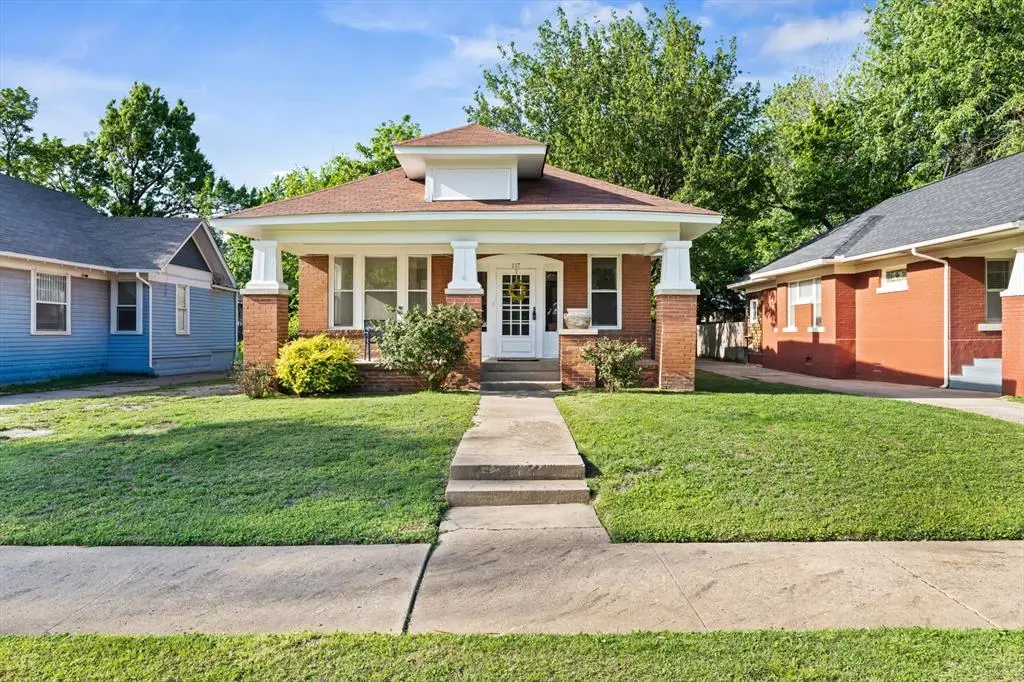
117 NW 25th St · Oklahoma City, OK
Flood risk 4/10 · Minor
- FEMA flood zone
- X (unshaded)
- Chance of flooding over 30 yrs
- 0.22%
- Est. flood insurance / yr
- $507 – $1,088
Fire risk 1/10 · Minimal
- Est. fire insurance / yr
- $2,463 – $4,575
Heat risk 6/10 · Moderate
- Hot days now (above 107°F)
- 7 days/yr
- Hot days in 30 yrs
- 19 days/yr
Wind risk 2/10 · Minimal
- Chance of severe wind over 30 yrs
- 3.0%
Air-quality risk 2/10 · Minimal
- Unhealthy air days now
- 1 days/yr
- Unhealthy air days in 30 yrs
- 2 days/yr
Risk factors via First Street. Map © Google.
Why this score? — see what drove the C- grade
The composite is a weighted blend of 9 inputs, each scored 0–100. Each bar is that input's sub-score; the figure is the points it added to the 100-point composite (weight × sub-score).
- Cash flow +18.7/30.0
- ARV discount +15.0/15.0
- DSCR +5.9/10.0
- 1% rule +4.3/10.0
- Livability +4.0/5.0
- Rent growth +2.8/5.0
- Condition / age +2.5/5.0
- Schools +0.7/10.0
- Appreciation +0.0/10.0
$189,000
🖨 Deal sheet 📄 Offer letter ✓ Due diligence
Listing remarks
Nestled in the heart of Jefferson Park, this charming Craftsman bungalow is the kind of home that rarely comes available-offered for the first time in over 40 years. Tucked on a quiet cul-de-sac beneath mature trees, it blends timeless character with a lifestyle that's hard to match. Just moments from local favorites like Toast Coffee+Kitchen, and The Blue Note and minutes to the Paseo Arts District, you'll find yourself surrounded by some of Oklahoma City's most loved restaurants, galleries, and gathering spots. Inside, refinished original hardwood floors and abundant natural light highlight the home's historic charm, while thoughtful updates-including fresh interior and exterior paint, up
Key facts
- Quiet cul-de-sac
- Flexible layout
- Spacious kitchen
Tags
Property features AI
Finance
- Other: Vacant and available; Living area reported as 1,268 (assessor)
- Financial info: Loan qualifying allowed; Not assumable
- HOA & community: No mandatory association dues
Exterior
- Home design: Single family residence; One level; Faces south; Residential property, existing; Located in a special zoning district; Homestead eligible; Historically designated
- Construction: Brick construction; Composition roof; Built on a conventional foundation
- Exterior features: Covered porch; Outbuildings; Wood fencing; Cul-de-sac lot; Interior lot
Interior
- Kitchen: Kitchen with pantry; Gas range
- Bedrooms: 3 bedrooms; One bedroom features a walk-in closet
- Flooring: Carpet; Wood
- Bathrooms: 1 full bathroom
- Interior features: Living area with 6 rooms total; Optional bedroom or living area; Study / office; Fireplace (1) — other-style
- Laundry & utility: Conventional foundation (utility access implied)
Neighborhood map
What this means for you Summary
Snapshot
- This is a 4-bed/1.0-bath single-family listed at $189k.
Deal economics
- At list price, monthly cash flow is $188 ($2k/yr) — positive.
- The deal already cash-flows at list — no discount required.
- To meet the 1% rule (rent ≥ 1% of price), the offer needs to be $176k (7.1% below list).
- Recommended offer: $176k (7.1% below list) — sets the bar for 1% rule.
- Cap rate 7.5% vs local median 3.7% in Oklahoma City — top-decile yield for the area; either an underpriced asset or a hidden risk that comps aren't pricing in. Stress-test before assuming the spread holds.
Location & tenants
- Location reads 80/100 on livability (#3 in OK, #1,635 nationally) — a professional / high-income tenant draw. Strengths: amenities A+, commute A+, cost of living A+; Watch: crime F.
- Oklahoma City (urban): math 7% / reading 10% proficiency, ranked #254 of 270 in OK (top 94%) — low school quality limits family demand, transient renter base, plan for 1-2y turnover; 82% free/reduced lunch — lower-income household profile, screen leases tightly.
- Zoned schools: Wilson Es (math 37% / reading 42%, grade F, #107 of 845 statewide, top 14%, 398 students, 0% FRL); Douglass Hs (math 2% / reading 2%, grade F, #445 of 447 statewide, top 100%, 556 students, 0% FRL) — zoned schools average 0% FRL vs 82% district-wide (82 pts lower); this property's tenant base skews higher-income than the district average.
- Zoned-school proficiency averages 21% at this address vs 8% district-wide (+12 pts) — the actual schools serving this property are materially stronger than the Oklahoma City average implies; a family-tenant draw the district grade alone would hide.
- Market conditions: Rents rising (+1.2%/yr); 53 active listings in the ZIP; 20 comparable units currently listed for rent nearby; rentals lingering (median 44d on market — plan ~5-8 weeks vacancy on turnover, expect pricing pressure); 60% of comp listings sitting > 30 days — soft ceiling on asking rent; 5,365 units permitted in Oklahoma County in 2024 (569 in 5+ unit buildings).
Forward outlook
- Local home prices are declining (-3.0%/yr); year-one equity from $1k of loan paydown is wiped out by about $6k of value loss. Plan a longer hold.
- Oklahoma County population projected at +41% by 2050 — long-run rental-demand tailwind backs the buy-and-hold thesis.
Negotiation context
- It's been on market 34 days — a 3% lower offer ($183k) is reasonable based on typical stale-listing flexibility.
- 2 sale attempts; this cycle's ask has dropped $10k (5%) from the opening price — seller is motivated, your offer sets the floor, not the list.
- Current owner paid $82k; list at $189k implies a 130% gain — meaningful room to come down on a strong offer.
Risks & watch-outs
- Watch-outs: built in 1915 — expect roof / HVAC / electrical / plumbing capex.
- Climate carrying-cost: extreme-heat days projected 7→19/yr by 2055 (HVAC capex compounding) — expect insurance premiums to compound above CPI over the hold.
Questions for the listing agent
- It's been on market 34 days. Have you received any prior offers? Is the seller open to a 7% concession, seller financing, or rate buy-down credit?
- Built in 1915 — when were the roof, HVAC, electrical panel, plumbing, and water heater last replaced?
- Is there a deadline driving the sale (1031 exchange, divorce, estate, relocation)? That informs how much negotiation room exists.
- Schools are F-rated, which usually means shorter tenancies and higher turnover. Who's the typical renter profile here, and what's been the actual vacancy rate?
- Crime grade is F in this area — have there been break-ins, vandalism, or insurance claims at this property in the last 3 years? What carrier currently insures it and at what premium?
- What's the average days-on-market for RENTAL listings here right now (not sales)? A rising rental-DOM trend means longer vacancies and softer asking-rent achievability than the comps imply.
- What's the recent tenant-quality profile in this submarket — average credit score on applications, eviction rate, late-payment / NSF rate, and stable-employment percentage? A property-management company in the area should have these aggregated.
- How much new for-sale + rental construction is in the pipeline within 1–3 miles? Heavy new supply typically softens prices + rents 12–24 months out; constrained supply supports both.
Investment metrics
- 1% rule
- 0.93% ✗
- Cap rate
- 7.48%
- Cash-on-cash
- 4.26%
- DSCR
- 1.19
- GRM
- 9.0
CMA / ARV
- ARV (median comp)
- $265,336
- List price
- $189,000
- Delta
- -28.77%
- Verdict
- UNDERPRICED
- Comps
- 20 within 1.0 mi
Show comp detail 12 sales within ~0.75 mi
| Address | Dist | Beds/Ba | Sqft | Sold | Price | $/sf | Match |
|---|---|---|---|---|---|---|---|
| 214 NW 25th St | 0.12mi | 3/2.0 (-1) | 1,352 (+7%) | 11mo | $245,000 | $181 | 66 |
| 411 NW 26th St | 0.29mi | 3/2.0 (-1) | 1,280 (+1%) | 13mo | $295,000 | $230 | 65 |
| 434 NW 27th St | 0.35mi | 3/1.5 (-1) | 1,266 (-0%) | 20mo | $285,000 | $225 | 60 |
| 307 NW 25th St | 0.18mi | 3/1.5 (-1) | 1,373 (+8%) | 14mo | $280,000 | $204 | 60 |
| 2608 N Dewey Ave | 0.44mi | 3/2.5 (-1) | 1,279 (+1%) | 10mo | $210,000 | $164 | 59 |
| 611 NW 22nd St | 0.53mi | 3/1.5 (-1) | 1,231 (-3%) | 11mo | $339,750 | $276 | 54 |
| 121 NW 18th St | 0.50mi | 3/1.0 (-1) | 1,377 (+9%) | 15mo | $399,900 | $290 | 45 |
| 704 NW 28th St | 0.58mi | 3/2.0 (-1) | 1,406 (+11%) | 1mo | $135,000 | $96 | 45 |
| 200 NW 34th St | 0.59mi | 3/2.0 (-1) | 1,332 (+5%) | 14mo | $300,000 | $225 | 44 |
| 119 NW 16th St | 0.64mi | 3/2.0 (-1) | 1,314 (+4%) | 19mo | $305,000 | $232 | 39 |
| 715 NW 22nd St | 0.61mi | 3/2.0 (-1) | 1,437 (+13%) | 2mo | $360,000 | $251 | 38 |
| 529 NW 31st St | 0.61mi | 3/1.0 (-1) | 1,428 (+13%) | 16mo | $180,000 | $126 | 32 |
Match score weights: distance 35% · size 25% · config 20% · recency 20%. Top-matched comps best support the ARV.
Projected returns pro-forma
-3.0% appreciation · 1.19% rent growth · sell at horizon
- IRR
- -11.6%
- Equity multiple
- 0.59×
- Total profit
- $-21,850
- Equity at exit
- $28,181
- IRR
- -5.1%
- Equity multiple
- 0.69×
- Total profit
- $-16,217
- Equity at exit
- $16,341
Cash invested: $52,920 (down + closing). Projections, not guarantees.
Landlord ↔ Tenant lean methodology
- Overall (STATE)
- 83 Strongly Landlord-Friendly
- State Oklahoma
- 83 Strongly Landlord-Friendly · R+20
- County
- — inherits STATE
- City
- — inherits STATE
ZIP-level market 73103
- Rents YoY
- 1.2%
- Active inventory
- 53
- Price-to-rent
- 9.0×
Monthly cashflow live
- Estimated rent
- $1,755 high interval (Pro) →
- Mortgage (P&I)
- −$991
- Tax from tax record
- −$129 /mo · $1,549/yr
- Insurance
- −$79
- HOA
- −$0
- Vacancy / Maint / Mgmt
- −$369
- Net cashflow
- $188
Break-even live
UW: 25.0% down · 7.5% · 30yr · 1.5% tax · 5.0% vac · 8.0% maint · 8.0% mgmt
Financing live
Cash to close
- Down payment
- $47,250
- Closing costs
- $5,670
- Reserves months
- —
- Total cash needed
- —
Loan-product check · same deal, 3 products live
Conventional
25% down · 7.5% · 30yr
- Down + closing
- —
- Monthly P&I
- —
- Monthly cashflow
- —
- DSCR
- —
- Eligible?
- —
Personal DTI + credit; lowest rate.
DSCR
20% down · 8.5% · 30yr
- Down + closing
- —
- Monthly P&I
- —
- Monthly cashflow
- —
- DSCR
- —
- Eligible?
- —
No personal income docs; deal must DSCR.
Hard money
10% down · 12.0% · 12mo
- Down + closing
- —
- Monthly P&I
- —
- Monthly cashflow
- —
- DSCR
- —
- Eligible?
- —
Short-term bridge; refi at stabilization.
Rent comps 20 comps
| Address | Beds | Baths | Sqft | Rent | $/sqft | DOM | Units | Dist |
|---|---|---|---|---|---|---|---|---|
| 2605 N Robinson Ave Oklahoma City, OK | 4.0 | 2.0 | 1813 | $1,850 | $1.02 | 43d | 1 | 0.07mi |
| 2915 N Harvey Pkwy Oklahoma City, OK | 3.0 | 1.0 | 1596 | $1,600 | $1.00 | 43d | 1 | 0.26mi |
| 726 NW 24th St Oklahoma City, OK | 3.0 | 2.0 | 1485 | $1,599 | $1.08 | 2d | 1 | 0.59mi |
| 711 W Hill St Unit 1 Oklahoma City, OK | 3.0 | 2.0 | 1440 | $1,765 | $1.23 | 3d | 1 | 0.76mi |
| 1100 NW 27th St Unit 1100 Oklahoma City, OK | 3.0 | 2.0 | 1500 | $1,195 | $0.80 | 23d | 1 | 0.86mi |
| 148 NE 15th St Oklahoma City, OK | 3.0 | 2.5 | 1593 | $2,099 | $1.32 | 1d | 1 | 0.88mi |
| 704 NE 31st St Oklahoma City, OK | 3.0 | 1.0 | 952 | $1,300 | $1.37 | 43d | 1 | 0.88mi |
| 610 NW Eubanks St Oklahoma City, OK | 3.0 | 3.0 | 1680 | $2,200 | $1.31 | 23d | 1 | 0.90mi |
| 1325 N Walker Ave Oklahoma City, OK | 1.0–3.0 | 1.0–2.0 | 972 | $2,235 | $2.30 | 1d | 22 | 1.02mi |
| 713 NE 34th Ter Oklahoma City, OK | 4.0 | 2.0 | 1397 | $1,395 | $1.00 | 43d | 1 | 1.03mi |
| 1302 NW 22nd St Oklahoma City, OK | 3.0 | 2.5 | 1647 | $2,395 | $1.45 | 23d | 1 | 1.04mi |
| 1302 NW 22nd St Oklahoma City, OK | 3.0 | 2.0 | 1647 | $2,395 | $1.45 | 43d | 1 | 1.04mi |
| 1400 NW 25th St Unit 2515-200 Oklahoma City, OK | 3.0 | 2.5 | 1600 | $1,595 | $1.00 | 43d | 1 | 1.11mi |
| 1305 Classen Dr Oklahoma City, OK | 1.0–3.0 | 1.0–3.5 | 1677 | $4,995 | $2.98 | 4d | 7 | 1.15mi |
| 846 Marilyn St Oklahoma City, OK | 3.0 | 1.0 | 1000 | $1,049 | $1.05 | 43d | 1 | 1.22mi |
| 1220 NW 36th St Oklahoma City, OK | 3.0 | 2.0 | 1595 | $1,595 | $1.00 | 43d | 1 | 1.30mi |
| 1215 NW 13th St Oklahoma City, OK | 3.0 | 1.0 | 1368 | $2,200 | $1.61 | 43d | 1 | 1.35mi |
| 2312 N Everest Ave Oklahoma City, OK | 3.0 | 1.0 | 1100 | $1,299 | $1.18 | 43d | 1 | 1.41mi |
| 1211 N Ellison Ave Oklahoma City, OK | 4.0 | 2.0 | 1526 | $1,800 | $1.18 | 43d | 1 | 1.46mi |
| 2135 N Lottie Ave Oklahoma City, OK | 3.0 | 2.0 | 1602 | $1,600 | $1.00 | 43d | 1 | 1.46mi |
Listing history 11 events
-
2026-06-05statusdays on market $189,000 Pending 34 DOM
-
2026-06-03days on market $189,000 Active 33 DOM
-
2026-06-02days on market $189,000 Active 32 DOM
-
2026-06-02price $189,000 Active 31 DOM
-
2026-06-01days on market $199,000 Active 31 DOM
-
2026-05-31days on market $199,000 Active 30 DOM
-
2026-05-01$199,000 Active 1760-char remark
-
2026-04-30historical
-
2026-01-19$225,000 Active
-
2018-12-03soldstatus $82,000
-
1984-06-01soldstatus $16,000
ⓘ Source: listings_history table (triggers on properties + properties_extension) + one-shot
backfill from property_details.listing_events for pre-trigger history.
Tax reassessment forecast OK · Resets to sale price
- Current annual tax
- $1,549 · $129/mo
- Projected year-2 tax
- $1,701 · $142/mo
- Expected delta
- +$152/yr (+$13/mo · 9.8%)
ⓘ Screening estimate from a state-policy table — verify with the county assessor before closing.
Climate risk First Street
- Flood 4/10 Moderate FEMA zone X (unshaded) · 22% chance over 30 yrs
- Wildfire 1/10 Low
- Heat 6/10 Major 7 d/yr ≥107°F today · 19 d/yr by 30 yrs out
- Wind 2/10 Low 3% chance of damaging wind over 30 yrs
- Air quality 2/10 Low 1 unhealthy d/yr today · 2 by 30 yrs out
Nearby sold comps map
Loading sold comps map…
Walkable amenities ~0.75 mi
Loading nearby amenities…
Taxation est. · year 1
- Rental income
- $21,063
- − Mortgage interest
- −$10,587
- − Property taxes
- −$1,549
- − Insurance
- −$945
- − Repairs & maintenance
- −$1,685
- − Management
- −$1,685
- − Depreciation
- −$5,498
- Taxable loss
- −$886
- Est. tax savings @ 24.0%
- +$213
- After-tax cash flow
- $2,465/yr
For passive investors: Depreciation is non-cash, so a rental often shows a tax loss while cash-flowing — sheltering income. Rental losses are passive: they offset passive income freely, and up to $25,000/yr can offset ordinary (W-2) income if you actively participate and your MAGI is under $100k (phasing out to $0 by $150k); unused losses carry forward. On sale, claimed depreciation is recaptured at up to 25%, and gains may owe capital-gains tax (a 1031 exchange can defer both). Figures are a year-1 estimate at your 24.0% rate — not tax advice; consult a CPA.
Schools (NCES district)
- District
- Oklahoma City
- NCES district ID
- 4022770
- Math proficiency
- 7% ▼ -5.00%
- Reading proficiency
- 10% ▼ -6.00%
- Median HH income
- $35,606
- Composite
- 7.0/100
- National rank
- #9970
- State rank
- #254 of 270 in OK
Livability — Oklahoma City
- Score
- 80/100
- State rank
- #3
- US rank
- #1635
Category grades
Schools grade is shown separately in the Schools card above.
Census & demographics
- Census place
- Oklahoma City, OK
- County
- Oklahoma County · 771,644 people
- City population
- 498,656
- Metro
- Oklahoma City, OK
- Population (ZIP)
- 5,486
- Household income
- $54,561
- Rent vs Own
- Severe rent burden
- 376.0
Population outlook (Oklahoma County) Hauer SSP2
- Today (2025)
- 911,875 people
- By 2030
- 982,413 · +7.7%
- By 2040
- 1,130,468 · +24.0%
- By 2050
- 1,288,422 · +41.3%
- By 2075
- 1,711,482 · +87.7%
- By 2100
- 2,088,448 · +129.0%
Race, ethnicity, and origin ACS 2023
- Neighborhood character
- Predominantly White (78%)
- Race & ethnicity
- White 78% Two or more races 8% Hispanic / Latino 6% Black 5% Asian 4% Native American 2%
- Hispanic origin (detail)
- Mexican 4%
- Common ancestry
- Slovak 6% Iranian 5% Italian 4%
- Foreign-born
- 5% · Canada
- Languages at home
- 94% English-only · Spanish 2% Other Indo-European 1% Other Asian/Pacific 1%
Political lean MEDSL · Oklahoma
- 2024 margin
- Toss-up / Even · D 48.0% · R 49.7% · Other 2.3%
- 2008→2024 swing
- +15.1pp toward D · 2008: -16.8pp · 2024: -1.7pp
- All cycles
- 2024: R+1.7 2020: R+1.1 2016: R+10.5 2012: R+16.7 2008: R+16.8
Not yet ingested
- Civics
- —
Market trends
- HPI YoY
- ▼ -249.27%
- Current HPI
- 278.2506
- Rent YoY
- ▲ 1.19%
- Metro
- Oklahoma City, OK
- State GDP YoY
- ▲ 1.55%
- F500 in state
- 6
Industry mix (Fortune 500 HQ in OK)
| Industry | F500 HQs | Revenue |
|---|---|---|
| Energy | 3 | $48B |
|
||
Price history
+1081.2% since first listed7 events — show timeline
- 2026-06-04 Pending — MLSOK
- 2026-06-01 Price Changed $189,000 MLSOK
- 2026-05-01 Listed $199,000 MLSOK
- 2026-04-30 Listing Removed — MLSOK
- 2026-01-19 Listed $225,000 MLSOK
- 2018-12-03 Sold (Public Records) $82,000 Public Records
- 1984-06-01 Sold (Public Records) $16,000 Public Records
Property tax history
+17.4%/yrLatest (2025): $1,549 · +4.2% YoY. Source: county tax records.
Cash-flow waterfall
monthlySold comps — $/sqft
last 12 mo · ≤1 miLoading sold comps…