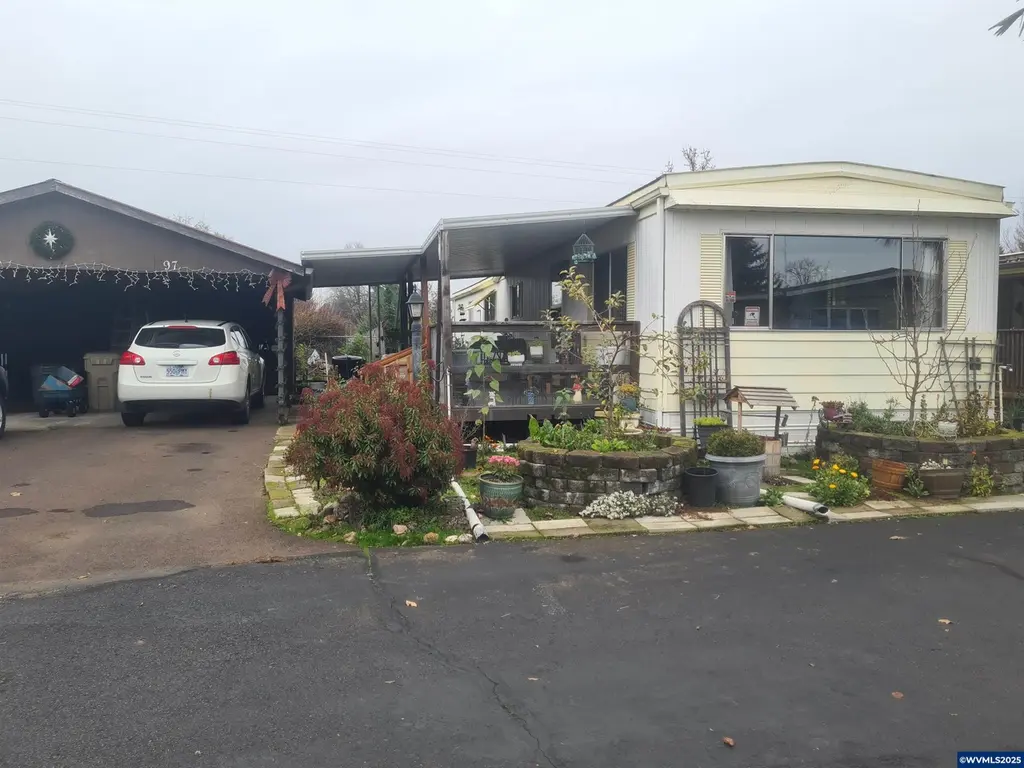
2796 S Main Rd #97 · Lebanon, OR
Flood risk 1/10 · Minimal
- FEMA flood zone
- X (unshaded)
- Chance of flooding over 30 yrs
- 0.0%
- Est. flood insurance / yr
- $507 – $1,088
Fire risk 5/10 · Moderate
- Est. fire insurance / yr
- $498 – $926
Heat risk 4/10 · Minor
- Hot days now (above 91°F)
- 7 days/yr
- Hot days in 30 yrs
- 15 days/yr
Wind risk 1/10 · Minimal
- Chance of severe wind over 30 yrs
- —
Air-quality risk 10/10 · Severe
- Unhealthy air days now
- 11 days/yr
- Unhealthy air days in 30 yrs
- 13 days/yr
Risk factors via First Street. Map © Google.
Why this score? — see what drove the B+ grade
The composite is a weighted blend of 9 inputs, each scored 0–100. Each bar is that input's sub-score; the figure is the points it added to the 100-point composite (weight × sub-score).
- Cash flow +30.0/30.0
- ARV discount +15.0/15.0
- 1% rule +10.0/10.0
- DSCR +10.0/10.0
- Rent growth +3.6/5.0
- Livability +3.6/5.0
- Schools +3.0/10.0
- Condition / age +2.5/5.0
- Appreciation +0.0/10.0
$41,950
🖨 Deal sheet 📄 Offer letter ✓ Due diligence
Listing remarks MLS
MOVE-IN READY 55+ GEM! Discover this beautifully updated 2 bed, 1 bath mobile home in sought-after Twin Cedars Park. At $pm 924$ sq ft, it features generously sized rooms and fantastic storage. The updated kitchen includes a dishwasher & fridge. Enjoy the outdoors with a covered patio and partially fenced yard. Easy access via ramp and stairs. Forget the hassle of renovations—simply unlock the door and start your simplified lifestyle today!
Key facts
- Covered patio
- Fantastic storage
- Updated kitchen
Tags
Neighborhood map
What this means for you Summary
Snapshot
- This is a 2-bed/1.0-bath other listed at $42k.
Deal economics
- At list price, monthly cash flow is $919 ($11k/yr) — positive.
- The deal already cash-flows at list — no discount required.
- Meets the 1% rule at list price ($2k rent vs $42k).
- Recommended offer: $37k (12.0% below list) — sets the bar for market timing.
- Cap rate 32.6% vs local median 2.9% in Lebanon — top-decile yield for the area; either an underpriced asset or a hidden risk that comps aren't pricing in. Stress-test before assuming the spread holds.
Location & tenants
- Location reads 71/100 on livability (#126 in OR) — a middle-class / working-renter tenant base. Strengths: housing A+, crime A, cost of living A; Watch: schools C-, health & safety C-, amenities D+.
- Lebanon Community SD 9 (town): math 27% / reading 43% proficiency, ranked #26 of 58 in OR (top 45%) — families likely to look elsewhere, expect single-tenant / working-renter base with shorter leases.
- Market conditions: Rents rising fast (+4.5%/yr); 246 active listings in the ZIP; 15 comparable units currently listed for rent nearby; rentals lingering (median 44d on market — plan ~5-8 weeks vacancy on turnover, expect pricing pressure); 100% of comp listings sitting > 30 days — soft ceiling on asking rent; 311 units permitted in Linn County in 2024 (60 in 5+ unit buildings).
Forward outlook
- Local home prices are declining (-3.0%/yr); year-one equity from $290 of loan paydown is wiped out by about $1k of value loss. Plan a longer hold.
- Linn County population projected at +5% by 2050 — modest demand growth; plan on rents tracking national, not racing it.
- At projected returns (-3.0% appreciation + 4.5% rent growth), your $12k cash investment doubles in ~2 years — after that, you're playing with house money.
Negotiation context
- It's been on market 185 days — a 12% lower offer ($37k) is reasonable based on typical stale-listing flexibility.
- 3 sale attempts since 22y ago with the ask held roughly flat each time — persistent listings suggest the price (not the market) is what's stuck; bring a comps-based counter.
- Current owner paid $11k; list at $42k implies a 286% gain — meaningful room to come down on a strong offer.
Risks & watch-outs
- Climate carrying-cost: moderate wildfire risk — expect insurance premiums to compound above CPI over the hold.
Questions for the listing agent
- It's been on market 185 days. Have you received any prior offers? Is the seller open to a 12% concession, seller financing, or rate buy-down credit?
- Built in 1976 — when were the roof, HVAC, electrical panel, plumbing, and water heater last replaced?
- Why hasn't it sold? Are there any deal-killer items the seller is aware of (foundation, flood, title, zoning, code violations)?
- Is there a deadline driving the sale (1031 exchange, divorce, estate, relocation)? That informs how much negotiation room exists.
- What's the average days-on-market for RENTAL listings here right now (not sales)? A rising rental-DOM trend means longer vacancies and softer asking-rent achievability than the comps imply.
- What's the recent tenant-quality profile in this submarket — average credit score on applications, eviction rate, late-payment / NSF rate, and stable-employment percentage? A property-management company in the area should have these aggregated.
- How much new for-sale + rental construction is in the pipeline within 1–3 miles? Heavy new supply typically softens prices + rents 12–24 months out; constrained supply supports both.
Investment metrics
- 1% rule
- 3.59% ✓
- Cap rate
- 32.58%
- Cash-on-cash
- 93.87%
- DSCR
- 5.18
- GRM
- 2.3
CMA / ARV
- ARV (median comp)
- $72,250
- List price
- $41,950
- Delta
- -41.94%
- Verdict
- UNDERPRICED
- Comps
- 10 within 1.0 mi
Projected returns pro-forma
-3.0% appreciation · 4.55% rent growth · sell at horizon
- IRR
- 96.4%
- Equity multiple
- 5.61×
- Total profit
- $54,124
- Equity at exit
- $6,255
- IRR
- 99.4%
- Equity multiple
- 12.29×
- Total profit
- $132,649
- Equity at exit
- $3,627
Cash invested: $11,746 (down + closing). Projections, not guarantees.
Landlord ↔ Tenant lean methodology
- Overall (STATE)
- 28 Tenant-Leaning
- State Oregon
- 28 Tenant-Leaning · D+6
- County
- — inherits STATE
- City
- — inherits STATE
ZIP-level market 97355
- Rents YoY
- 4.5%
- Active inventory
- 246
- Price-to-rent
- 2.3×
Monthly cashflow live
- Estimated rent
- $1,508 high interval (Pro) →
- Mortgage (P&I)
- −$220
- Tax from tax record
- −$35 /mo · $421/yr
- Insurance
- −$17
- HOA
- −$0
- Vacancy / Maint / Mgmt
- −$317
- Net cashflow
- $919
Break-even live
UW: 25.0% down · 7.5% · 30yr · 1.5% tax · 5.0% vac · 8.0% maint · 8.0% mgmt
Financing live
Cash to close
- Down payment
- $10,488
- Closing costs
- $1,258
- Reserves months
- —
- Total cash needed
- —
Loan-product check · same deal, 3 products live
Conventional
25% down · 7.5% · 30yr
- Down + closing
- —
- Monthly P&I
- —
- Monthly cashflow
- —
- DSCR
- —
- Eligible?
- —
Personal DTI + credit; lowest rate.
DSCR
20% down · 8.5% · 30yr
- Down + closing
- —
- Monthly P&I
- —
- Monthly cashflow
- —
- DSCR
- —
- Eligible?
- —
No personal income docs; deal must DSCR.
Hard money
10% down · 12.0% · 12mo
- Down + closing
- —
- Monthly P&I
- —
- Monthly cashflow
- —
- DSCR
- —
- Eligible?
- —
Short-term bridge; refi at stabilization.
Rent comps 15 comps
| Address | Beds | Baths | Sqft | Rent | $/sqft | DOM | Units | Dist |
|---|---|---|---|---|---|---|---|---|
| 300 Sand Ridge Ct Lebanon, OR | 1.0–2.0 | 1.0–2.0 | 944 | $1,525 | $1.61 | 43d | 6 | 0.10mi |
| 1956 S Second St Lebanon, OR | 1.0–2.0 | 1.0–2.0 | 840 | $1,445 | $1.72 | 43d | 7 | 0.43mi |
| 1900 S Second St Unit A103 Lebanon, OR | 2.0 | 1.0 | 858 | $1,350 | $1.57 | 43d | 1 | 0.52mi |
| 975 Wassom St Lebanon, OR | 2.0 | 1.5 | 928 | $1,525 | $1.64 | 43d | 1 | 0.52mi |
| 1900 S Second St Unit A201 Lebanon, OR | 2.0 | 2.0 | 1078 | $1,450 | $1.35 | 43d | 1 | 0.53mi |
| E Airport Rd Lebanon, OR | 1.0–3.0 | 1.0–2.0 | 993 | $1,710 | $1.72 | 43d | 14 | 0.63mi |
| 2180 Franklin St Lebanon, OR | 1.0–2.0 | 1.0–2.0 | 862 | $1,695 | $1.97 | 43d | 6 | 0.67mi |
| 2400 12th St Lebanon, OR | 1.0–2.0 | 1.0 | 926 | $1,600 | $1.73 | 43d | 6 | 0.72mi |
| 45 Cox St Lebanon, OR | 2.0 | 1.0 | 760 | $1,395 | $1.84 | 43d | 1 | 0.87mi |
| 640 F St Lebanon, OR | 2.0 | 1.0 | 980 | $1,435 | $1.46 | 43d | 1 | 0.87mi |
| 198 E Milton St Unit 1 Lebanon, OR | 2.0 | 1.0 | 800 | $1,350 | $1.69 | 43d | 1 | 0.95mi |
| 865 E St Unit 865 Lebanon, OR | 2.0 | 1.0 | 819 | $1,500 | $1.83 | 43d | 1 | 1.00mi |
| 1515 David Dr Unit 1515-DA Lebanon, OR | 2.0 | 1.0 | 1104 | $1,450 | $1.31 | 43d | 1 | 1.18mi |
| 900 S 10th St Lebanon, OR | 2.0 | 1.5 | 960 | $1,435 | $1.49 | 43d | 1 | 1.35mi |
| 153 E Ash St Unit 153 Lebanon, OR | 2.0 | 1.5 | 1050 | $1,495 | $1.42 | 43d | 1 | 1.50mi |
Listing history 23 events
-
2026-06-19days on market $41,950 Active 185 DOM
-
2026-06-18days on market $41,950 Active 184 DOM
-
2026-06-17days on market $41,950 Active 183 DOM
-
2026-06-16days on market $41,950 Active 182 DOM
-
2026-06-15days on market $41,950 Active 181 DOM
-
2026-06-14days on market $41,950 Active 179 DOM
-
2026-06-13days on market $41,950 Active 178 DOM
-
2026-06-10days on market $41,950 Active 176 DOM
-
2026-06-09days on market $41,950 Active 175 DOM
-
2026-06-08days on market $41,950 Active 174 DOM
-
2026-06-07days on market $41,950 Active 173 DOM
-
2026-06-03days on market $41,950 Active 169 DOM
-
2026-06-02days on market $41,950 Active 168 DOM
-
2026-06-01days on market $41,950 Active 167 DOM
-
2026-05-31days on market $41,950 Active 166 DOM
-
2026-05-30days on market $41,950 Active 165 DOM
-
2025-12-16$41,950 Active 454-char remark
Show marketing remark (454 chars)
MOVE-IN READY 55+ GEM! Discover this beautifully updated 2 bed, 1 bath mobile home in sought-after Twin Cedars Park. At $pm 924$ sq ft, it features generously sized rooms and fantastic storage. The updated kitchen includes a dishwasher & fridge. Enjoy the outdoors with a covered patio and partially fenced yard. Easy access via ramp and stairs. Forget the hassle of renovations—simply unlock the door and start your simplified lifestyle today!
-
2005-10-04soldstatus $10,865 184-char remark
Show marketing remark (184 chars)
Front living room, open floor plan, large covered front deck, country kitchen with banana bar, newer appliances. 55+ community. Price just drastically reduced, very motivated seller!!!
-
2005-09-04historical 184-char remark
Show marketing remark (184 chars)
Front living room, open floor plan, large covered front deck, country kitchen with banana bar, newer appliances. 55+ community. Price just drastically reduced, very motivated seller!!!
-
2005-05-23$13,500 184-char remark
Show marketing remark (184 chars)
Front living room, open floor plan, large covered front deck, country kitchen with banana bar, newer appliances. 55+ community. Price just drastically reduced, very motivated seller!!!
-
2004-07-15soldstatus $11,200
-
2004-07-13historical
-
2004-05-12$13,000
ⓘ Source: listings_history table (triggers on properties + properties_extension) + one-shot
backfill from property_details.listing_events for pre-trigger history.
Tax reassessment forecast OR · Resets to sale price
- Current annual tax
- $421 · $35/mo
- Projected year-2 tax
- $421 · $35/mo
- Expected delta
- $0/yr ($0/mo · 0.0%)
ⓘ Screening estimate from a state-policy table — verify with the county assessor before closing.
Climate risk First Street
- Flood 1/10 Low FEMA zone X (unshaded) · 0% chance over 30 yrs
- Wildfire 5/10 Major
- Heat 4/10 Moderate 7 d/yr ≥91°F today · 15 d/yr by 30 yrs out
- Wind 1/10 Low
- Air quality 10/10 Extreme 11 unhealthy d/yr today · 13 by 30 yrs out
Nearby sold comps map
Loading sold comps map…
Walkable amenities ~0.75 mi
Loading nearby amenities…
Taxation est. · year 1
- Rental income
- $18,097
- − Mortgage interest
- −$2,350
- − Property taxes
- −$421
- − Insurance
- −$210
- − Repairs & maintenance
- −$1,448
- − Management
- −$1,448
- − Depreciation
- −$1,220
- Taxable income
- $11,001
- Est. tax owed @ 24.0%
- −$2,640
- After-tax cash flow
- $8,386/yr
For passive investors: Depreciation is non-cash, so a rental often shows a tax loss while cash-flowing — sheltering income. Rental losses are passive: they offset passive income freely, and up to $25,000/yr can offset ordinary (W-2) income if you actively participate and your MAGI is under $100k (phasing out to $0 by $150k); unused losses carry forward. On sale, claimed depreciation is recaptured at up to 25%, and gains may owe capital-gains tax (a 1031 exchange can defer both). Figures are a year-1 estimate at your 24.0% rate — not tax advice; consult a CPA.
Schools (NCES district)
- District
- Lebanon Community SD 9
- NCES district ID
- 4107380
- Math proficiency
- 27% ▼ -10.00%
- Reading proficiency
- 43% ▼ -4.00%
- Median HH income
- $45,264
- Composite
- 29.83/100
- National rank
- #6418
- State rank
- #26 of 58 in OR
Livability — Lebanon
- Score
- 71/100
- State rank
- #126
- US rank
- #7209
Category grades
Schools grade is shown separately in the Schools card above.
Census & demographics
- Census place
- Lebanon, OR
- County
- Linn County · 70,700 people
- City population
- 34,292
- Metro
- Albany-Lebanon, OR
- Population (ZIP)
- 34,292
- Household income
- $68,595
- Rent vs Own
- Severe rent burden
- 1051.0
Population outlook (Linn County) Hauer SSP2
- Today (2025)
- 127,026 people
- By 2030
- 129,540 · +2.0%
- By 2040
- 132,780 · +4.5%
- By 2050
- 133,614 · +5.2%
- By 2075
- 129,061 · +1.6%
- By 2100
- 112,224 · -11.7%
Race, ethnicity, and origin ACS 2023
- Neighborhood character
- Predominantly White (87%)
- Race & ethnicity
- White 87% Hispanic / Latino 7% Two or more races 7%
- Hispanic origin (detail)
- Mexican 6%
- Common ancestry
- Italian 5% Slovak 3% Portuguese 3%
- Foreign-born
- 4% · Canada
- Languages at home
- 93% English-only · Spanish 5% French/Haitian/Cajun 1%
Political lean MEDSL · Linn
- 2024 margin
- Strong R (+24.4) · D 36.2% · R 60.6% · Other 3.1%
- 2008→2024 swing
- -13.0pp toward R · 2008: -11.4pp · 2024: -24.4pp
- All cycles
- 2024: R+24.4 2020: R+23.4 2016: R+27.8 2012: R+17.2 2008: R+11.4
Not yet ingested
- Civics
- —
Market trends
- HPI YoY
- ▼ -528.42%
- Current HPI
- 221.8977
- Rent YoY
- ▲ 4.55%
- Metro
- Albany-Lebanon, OR
- State GDP YoY
- ▲ 2.05%
- F500 in state
- 2
Industry mix (Fortune 500 HQ in OR)
| Industry | F500 HQs | Revenue |
|---|---|---|
| Consumer Goods | 1 | $51B |
|
||
Price history
+222.7% since first listed7 events — show timeline
- 2025-12-16 Listed $41,950 WVMLS
- 2005-10-04 Sold (MLS) $10,865 WVMLS
- 2005-09-04 Listing Removed — WVMLS
- 2005-05-23 Listed $13,500 WVMLS
- 2004-07-15 Sold (MLS) $11,200 WVMLS
- 2004-07-13 Listing Removed — WVMLS
- 2004-05-12 Listed $13,000 WVMLS
Property tax history
+5.7%/yrLatest (2025): $421 · +3.3% YoY. Source: county tax records.
Cash-flow waterfall
monthlySold comps — $/sqft
last 12 mo · ≤1 miLoading sold comps…