716 Northfield Dr Unit C · Sacramento, CA
Flood risk No data
- FEMA flood zone
- —
- Chance of flooding over 30 yrs
- —
- Est. flood insurance / yr
- —
Fire risk No data
- Est. fire insurance / yr
- —
Heat risk No data
- Hot days now (above threshold)
- —
- Hot days in 30 yrs
- —
Wind risk No data
- Chance of severe wind over 30 yrs
- —
Air-quality risk No data
- Unhealthy air days now
- —
- Unhealthy air days in 30 yrs
- —
Risk factors via First Street. Map © Google.
Why this score? — see what drove the D grade
The composite is a weighted blend of 9 inputs, each scored 0–100. Each bar is that input's sub-score; the figure is the points it added to the 100-point composite (weight × sub-score).
- Cash flow +13.4/30.0
- ARV discount +7.5/15.0
- 1% rule +4.5/10.0
- DSCR +4.0/10.0
- Livability +3.6/5.0
- Rent growth +3.5/5.0
- Schools +3.1/10.0
- Condition / age +2.5/5.0
- Appreciation +0.0/10.0
$229,000
🖨 Deal sheet (PDF) 📄 Offer letter ✓ Due diligence
Listing remarks
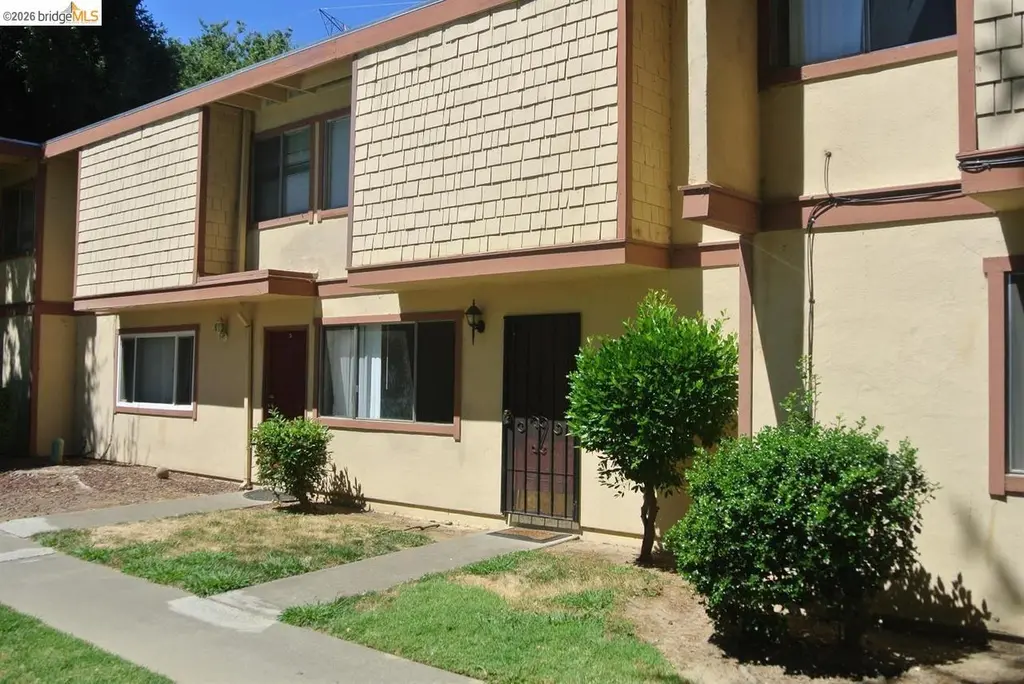
This is a rare opportunity to purchase an immaculate, turn-key 3-bedroom, 1.5-bathroom newly renovated condo in Sacramento. This unit is priced competitively and features a generous floor plan that caters to both singles and families. This beautiful home has been just upgraded throughout, including freshly painted interior walls, upgraded counters and cabinets for the kitchen and bathrooms, new durable laminate flooring. the backyard is spacious for a condo. This beautifully updated condo offers comfort, convenience, and great amenities. Garden lawns and pool on site. Buy as residence or can rent at 2500-3000 a month. Close to Downtown, Parks, Transportation and Shopping. Don't miss out on
Key facts
- Spacious backyard
- Upgraded counters
- Garden lawns
Tags
Property features AI
Finance
- Other: Community in-ground pool
- HOA & community: Monthly association fee of $285; Association amenities: greenbelt, community pool; Pets allowed: cats and dogs; Has homeowners association
Exterior
- Parking: Carport; Parking lot
- Utilities: Public water
- Home design: Residential condominium; Built in 1980
- Exterior features: Unit faces a common area; Back yard; Shed(s)
Interior
- Kitchen: Dishwasher; Electric range / cooktop; Refrigerator
- Bedrooms: 5 rooms total (includes bedrooms and living spaces)
- Bathrooms: 2 total bathrooms (1 full, 1 partial); Updated baths
- Heating & cooling: Has heating; Central air; Ceiling fans
- Interior features: Fireplace; No additional rooms
Neighborhood map
What this means for you Summary
Snapshot
- This is a 3-bed/1.5-bath condo listed at $229k.
Deal economics
- At list price, monthly cash flow is $2 ($26/yr) — positive.
- The deal already cash-flows at list — no discount required.
- To meet the 1% rule (rent ≥ 1% of price), the offer needs to be $218k (5.0% below list).
- Recommended offer: $218k (5.0% below list) — sets the bar for 1% rule.
- Cap rate 6.3% vs local median 3.0% in Sacramento — top-decile yield for the area; either an underpriced asset or a hidden risk that comps aren't pricing in. Stress-test before assuming the spread holds.
Location & tenants
- Location reads 71/100 on livability (#218 in CA) — a middle-class / working-renter tenant base. Strengths: amenities A+, commute A+, housing A; Watch: crime F, cost of living F.
- Twin Rivers Unified (suburban): math 29% / reading 37% proficiency, ranked #970 of 1,400 in CA (top 69%) — families likely to look elsewhere, expect single-tenant / working-renter base with shorter leases; 76% free/reduced lunch — lower-income household profile, screen leases tightly.
- Zoned schools: Woodlake Elementary (321 students, 94% FRL); Rio Tierra Junior High (292 students, 89% FRL); Grant Union High (2,040 students, 88% FRL).
- Market conditions: Rents rising (+3.8%/yr); 136 active listings in the ZIP; 24 comparable units currently listed for rent nearby; rentals leasing fast (median 4d on market — plan ~1-2 weeks tenant-placement turnaround); solid renter incomes; 6,825 units permitted in Sacramento County in 2024 (1,752 in 5+ unit buildings).
Forward outlook
- Local home prices are declining (-3.0%/yr); year-one equity from $2k of loan paydown is wiped out by about $7k of value loss. Plan a longer hold.
- Sacramento County population projected at +17% by 2050 — long-run rental-demand tailwind backs the buy-and-hold thesis.
Negotiation context
- It's been on market 23 days — a 2% lower offer ($226k) is reasonable based on typical stale-listing flexibility.
- 2 sale attempts with the ask held roughly flat each time — persistent listings suggest the price (not the market) is what's stuck; bring a comps-based counter.
- Current owner paid $104k; list at $229k implies a 120% gain — meaningful room to come down on a strong offer.
Questions for the listing agent
- What does the HOA fee cover, when was the last increase, and are there any pending special assessments or reserve-fund shortfalls?
- Any open or pending special assessments — roof, HVAC, plumbing, elevator, façade? What's the per-unit balance and payoff schedule, and is the seller paying it off at close or rolling it to the buyer?
- Is there a deadline driving the sale (1031 exchange, divorce, estate, relocation)? That informs how much negotiation room exists.
- Schools are D-rated, which usually means shorter tenancies and higher turnover. Who's the typical renter profile here, and what's been the actual vacancy rate?
- Crime grade is F in this area — have there been break-ins, vandalism, or insurance claims at this property in the last 3 years? What carrier currently insures it and at what premium?
- The area grade is low — what's the realistic commute time and amenity access for the typical tenant pool here? Any planned neighborhood developments (good or bad) we should know about?
- What's the average days-on-market for RENTAL listings here right now (not sales)? A rising rental-DOM trend means longer vacancies and softer asking-rent achievability than the comps imply.
- What's the recent tenant-quality profile in this submarket — average credit score on applications, eviction rate, late-payment / NSF rate, and stable-employment percentage? A property-management company in the area should have these aggregated.
- How much new apartment / multifamily construction is in the pipeline within 1–3 miles? Heavy new supply (>2% of stock underway) typically softens rents 12–24 months out; light construction supports rent growth.
Investment metrics
- 1% rule
- 0.95% ✗
- Cap rate
- 6.30%
- Cash-on-cash
- 0.04%
- DSCR
- 1.00
- GRM
- 8.8
CMA / ARV
No comps found within radius.
Projected returns pro-forma
-3.0% appreciation · 3.82% rent growth · sell at horizon
- IRR
- -15.2%
- Equity multiple
- 0.45×
- Total profit
- $-35,046
- Equity at exit
- $34,145
- IRR
- -5.1%
- Equity multiple
- 0.65×
- Total profit
- $-22,323
- Equity at exit
- $19,800
Cash invested: $64,120 (down + closing). Projections, not guarantees.
Landlord ↔ Tenant lean methodology
- Overall (STATE)
- 18 Strongly Tenant-Friendly
- State California
- 18 Strongly Tenant-Friendly · D+13
- County
- — inherits STATE
- City
- — inherits STATE
ZIP-level market 95833
- Rents YoY
- 3.8%
- Active inventory
- 136
- Price-to-rent
- 8.8×
Monthly cashflow live
- Estimated rent
- $2,175 high interval (Pro) →
- Mortgage (P&I)
- −$1,201
- Tax from tax record
- −$135 /mo · $1,619/yr
- Insurance
- −$95
- HOA
- −$285
- Vacancy / Maint / Mgmt
- −$457
- Net cashflow
- $2
Break-even live
Sensitivity live
| Price | -10% $132 | -5% $67 | +0% $2 | +5% $-63 | +10% $-127 |
|---|---|---|---|---|---|
| Rent | -10% $-170 | -5% $-84 | +0% $2 | +5% $88 | +10% $174 |
| Rate | -1.0pp $117 | -0.5pp $60 | base $2 | +0.5pp $-57 | +1.0pp $-118 |
UW: 25.0% down · 7.5% · 30yr · 1.5% tax · 5.0% vac · 8.0% maint · 8.0% mgmt
Financing live
Cash to close
- Down payment
- $57,250
- Closing costs
- $6,870
- Reserves months
- —
- Total cash needed
- —
Loan-product check · same deal, 3 products live
Conventional
25% down · 7.5% · 30yr
- Down + closing
- —
- Monthly P&I
- —
- Monthly cashflow
- —
- DSCR
- —
- Eligible?
- —
Personal DTI + credit; lowest rate.
DSCR
20% down · 8.5% · 30yr
- Down + closing
- —
- Monthly P&I
- —
- Monthly cashflow
- —
- DSCR
- —
- Eligible?
- —
No personal income docs; deal must DSCR.
Hard money
10% down · 12.0% · 12mo
- Down + closing
- —
- Monthly P&I
- —
- Monthly cashflow
- —
- DSCR
- —
- Eligible?
- —
Short-term bridge; refi at stabilization.
Rent comps 24 comps
| Address | Beds | Baths | Sqft | Rent | $/sqft | DOM | Units | Dist |
|---|---|---|---|---|---|---|---|---|
| 631 Garden Hwy Unit 6103 Sacramento, CA | 2.0 | 2.0 | 975 | $1,795 | $1.84 | 3d | 1 | 0.12mi |
| 631 Garden Hwy Unit 3202 Sacramento, CA | 2.0 | 2.0 | 975 | $1,795 | $1.84 | 16d | 1 | 0.17mi |
| 2660 Stonecreek Dr Sacramento, CA | 2.0 | 2.0 | 887 | $2,055 | $2.32 | 21d | 1 | 0.77mi |
| 2450 Seamist Dr Sacramento, CA | 1.0–2.0 | 1.0–2.0 | 755 | $1,804 | $2.39 | 0d | 20 | 0.77mi |
| 1560 Waterwheel Dr Sacramento, CA | 2.0 | 2.0 | 1119 | $2,115 | $1.89 | 25d | 1 | 0.84mi |
| 1560 Waterwheel Dr Sacramento, CA | 2.0 | 2.0 | 1070 | $1,925 | $1.80 | 0d | 1 | 0.84mi |
| 1560 Waterwheel Dr Sacramento, CA | 3.0 | 2.0 | 1290 | $2,170 | $1.68 | 45d | 1 | 0.84mi |
| 1560 Waterwheel Dr Sacramento, CA | 3.0 | 2.0 | 1290 | $2,240 | $1.74 | 21d | 1 | 0.84mi |
| 102 Redwood Ave Unit A Sacramento, CA | 2.0 | 1.0 | 1100 | $2,100 | $1.91 | 9d | 1 | 0.86mi |
| 775 N 6th St Sacramento, CA | 3.0 | 1.0–2.0 | 1037 | $3,395 | $3.27 | 3d | 34 | 0.87mi |
| 300 Curran Ave Sacramento, CA | 2.0 | 1.0 | 710 | $1,695 | $2.39 | 45d | 1 | 0.98mi |
| 581 Summer Garden Way Sacramento, CA | 4.0 | 2.0 | 1500 | $2,800 | $1.87 | 3d | 1 | 1.17mi |
| 186 Globe Ave Unit 186 Sacramento, CA | 2.0 | 1.0 | 937 | $1,895 | $2.02 | 25d | 1 | 1.18mi |
| 2379 Gibson St Sacramento, CA | 2.0 | 1.0 | 1000 | $1,850 | $1.85 | 12d | 1 | 1.20mi |
| 2593 Millcreek Dr Sacramento, CA | 1.0–2.0 | 1.0–2.0 | 787 | $1,800 | $2.29 | 0d | 9 | 1.22mi |
| 2680 Grove Ave Unit NA Sacramento, CA | 3.0 | 1.0 | 1360 | $2,500 | $1.84 | 3d | 1 | 1.24mi |
| 2680 Grove Ave Sacramento, CA | 3.0 | 1.0 | 1360 | $2,700 | $1.99 | 3d | 1 | 1.24mi |
| 3196 Kinnaird Way Sacramento, CA | 2.0 | 1.0 | 830 | $1,525 | $1.84 | 23d | 1 | 1.26mi |
| 3047 Mill Oak Way Sacramento, CA | 3.0 | 2.0 | 1474 | $2,650 | $1.80 | 0d | 1 | 1.27mi |
| 2205 Natomas Park Dr Sacramento, CA | 1.0–3.0 | 1.0–2.0 | 900 | $3,180 | $3.53 | 0d | 20 | 1.29mi |
| 321 Bercut Dr Sacramento, CA | 2.0 | 1.0–2.0 | 575 | $1,980 | $3.44 | 3d | 18 | 1.32mi |
| 801 San Juan Rd Sacramento, CA | 1.0–2.0 | 1.0–2.0 | 765 | $1,660 | $2.17 | 3d | 3 | 1.43mi |
| 2025 W El Camino Ave Sacramento, CA | 1.0–2.0 | 1.0–2.0 | 744 | $2,053 | $2.76 | 0d | 1 | 1.48mi |
| 1816 K St Unit L2 Sacramento, CA | 2.0 | 2.0 | 850 | $1,995 | $2.35 | 45d | 1 | 1.49mi |
HOA detail condo
- Monthly dues
- $285 · $3,420/yr
- Likely covers
- pool
- Assessments
- None detected in remarks — confirm with the listing agent.
Listing history 14 events
-
2026-06-21days on market $229,000 Active 23 DOM
-
2026-06-18days on market $229,000 Active 20 DOM
-
2026-06-17days on market $229,000 Active 19 DOM
-
2026-06-16days on market $229,000 Active 18 DOM
-
2026-06-15days on market $229,000 Active 17 DOM
-
2026-06-13days on market $229,000 Active 15 DOM
-
2026-06-13days on market $229,000 Active 14 DOM
-
2026-06-09days on market $229,000 Active 11 DOM
-
2026-06-08days on market $229,000 Active 10 DOM
-
2026-06-07days on market $229,000 Active 9 DOM
-
2026-06-03days on market $229,000 Active 5 DOM
-
2026-06-02pricedays on market $229,000 Active 4 DOM
-
2026-06-01days on market $239,000 Active 3 DOM
-
2026-05-31days on market $239,000 Active 2 DOM
ⓘ Source: listings_history table (triggers on properties + properties_extension) + one-shot
backfill from property_details.listing_events for pre-trigger history.
Tax reassessment forecast CA · Resets to sale price
- Current annual tax
- $1,619 · $135/mo
- Projected year-2 tax
- $1,740 · $145/mo
- Expected delta
- +$122/yr (+$10/mo · 7.5%)
ⓘ Screening estimate from a state-policy table — verify with the county assessor before closing.
Nearby sold comps map
Loading sold comps map…
Walkable amenities ~0.75 mi
Loading nearby amenities…
Taxation est. · year 1
- Rental income
- $26,102
- − Mortgage interest
- −$12,828
- − Property taxes
- −$1,619
- − Insurance
- −$1,145
- − Repairs & maintenance
- −$2,088
- − Management
- −$2,088
- − HOA
- −$3,420
- − Depreciation
- −$6,662
- Taxable loss
- −$3,747
- Est. tax savings @ 24.0%
- +$899
- After-tax cash flow
- $925/yr
For passive investors: Depreciation is non-cash, so a rental often shows a tax loss while cash-flowing — sheltering income. Rental losses are passive: they offset passive income freely, and up to $25,000/yr can offset ordinary (W-2) income if you actively participate and your MAGI is under $100k (phasing out to $0 by $150k); unused losses carry forward. On sale, claimed depreciation is recaptured at up to 25%, and gains may owe capital-gains tax (a 1031 exchange can defer both). Figures are a year-1 estimate at your 24.0% rate — not tax advice; consult a CPA.
Schools (NCES district)
- District
- Twin Rivers Unified
- NCES district ID
- 0601332
- Math proficiency
- 29% ▲ 2.00%
- Reading proficiency
- 37% ▲ 2.00%
- Median HH income
- $42,481
- Composite
- 30.67/100
- National rank
- #11437
- State rank
- #970 of 1400 in CA
Livability — Sacramento
- Score
- 71/100
- State rank
- #218
- US rank
- #6957
Category grades
Schools grade is shown separately in the Schools card above.
Census & demographics
- Census place
- Sacramento, CA
- County
- Sacramento County · 1,539,646 people
- City population
- 761,410
- Metro
- Sacramento-Roseville-Folsom, CA
- Population (ZIP)
- 42,265
- Household income
- $97,792
- Rent vs Own
- Severe rent burden
- 1743.0
Population outlook (Sacramento County) Hauer SSP2
- Today (2025)
- 1,660,763 people
- By 2030
- 1,732,990 · +4.3%
- By 2040
- 1,855,755 · +11.7%
- By 2050
- 1,941,335 · +16.9%
- By 2075
- 2,046,162 · +23.2%
- By 2100
- 1,961,444 · +18.1%
Race, ethnicity, and origin ACS 2023
- Neighborhood character
- Highly diverse neighborhood (Simpson 0.73)
- Race & ethnicity
- Hispanic / Latino 41% White 27% Two or more races 20% Black 12% Asian 10% Pacific Islander 1%
- Hispanic origin (detail)
- Mexican 35%
- Common ancestry
- Russian 2% Lithuanian 1% Italian 1%
- Foreign-born
- 19% · Canada, China, Vietnam
- Languages at home
- 66% English-only · Spanish 22% Other Indo-European 4% Other Asian/Pacific 2%
Political lean MEDSL · Sacramento
- 2024 margin
- D (+19.7) · D 58.1% · R 38.4% · Other 3.5%
- 2008→2024 swing
- +0.7pp no change · 2008: 19.0pp · 2024: 19.7pp
- All cycles
- 2024: D+19.7 2020: D+25.3 2016: D+23.7 2012: D+16.3 2008: D+19.0
Not yet ingested
- Civics
- —
Market trends
- HPI YoY
- ▼ -230.78%
- Current HPI
- 307.7212
- Rent YoY
- ▲ 3.82%
- Metro
- Sacramento-Roseville-Folsom, CA
- State GDP YoY
- ▲ 3.21%
- F500 in state
- 116
Industry mix (Fortune 500 HQ in CA)
| Industry | F500 HQs | Revenue |
|---|---|---|
| Technology | 27 | $1,492B |
|
||
| Financial Services | 3 | $174B |
|
||
| Retail | 3 | $44B |
|
||
| Insurance | 3 | $26B |
|
||
| Media / Entertainment | 2 | $115B |
|
||
| Pharmaceuticals / Biotech | 2 | $62B |
|
||
Price history
+563.9% since first listed9 events — show timeline
- 2026-05-29 Listed $239,000 bridgeMLS, Bay East AOR, or Contra Costa AOR
- 2026-04-01 Listing Removed — bridgeMLS, Bay East AOR, or Contra Costa AOR
- 2026-03-18 Price Changed — bridgeMLS, Bay East AOR, or Contra Costa AOR
- 2026-02-24 Price Changed — bridgeMLS, Bay East AOR, or Contra Costa AOR
- 2026-02-11 Price Changed — bridgeMLS, Bay East AOR, or Contra Costa AOR
- 2026-01-28 Listed — bridgeMLS, Bay East AOR, or Contra Costa AOR
- 2017-08-01 Sold (Public Records) $104,000 Public Records
- 1995-06-12 Sold (Public Records) $3,849 Public Records
- 1990-09-28 Sold (Public Records) $36,000 Public Records
Property tax history
+6.9%/yrLatest (2025): $1,619 · +3.7% YoY. Source: county tax records.
Cash-flow waterfall
monthlySold comps — $/sqft
last 12 mo · ≤1 miLoading sold comps…