 🏷️ Likely Rental
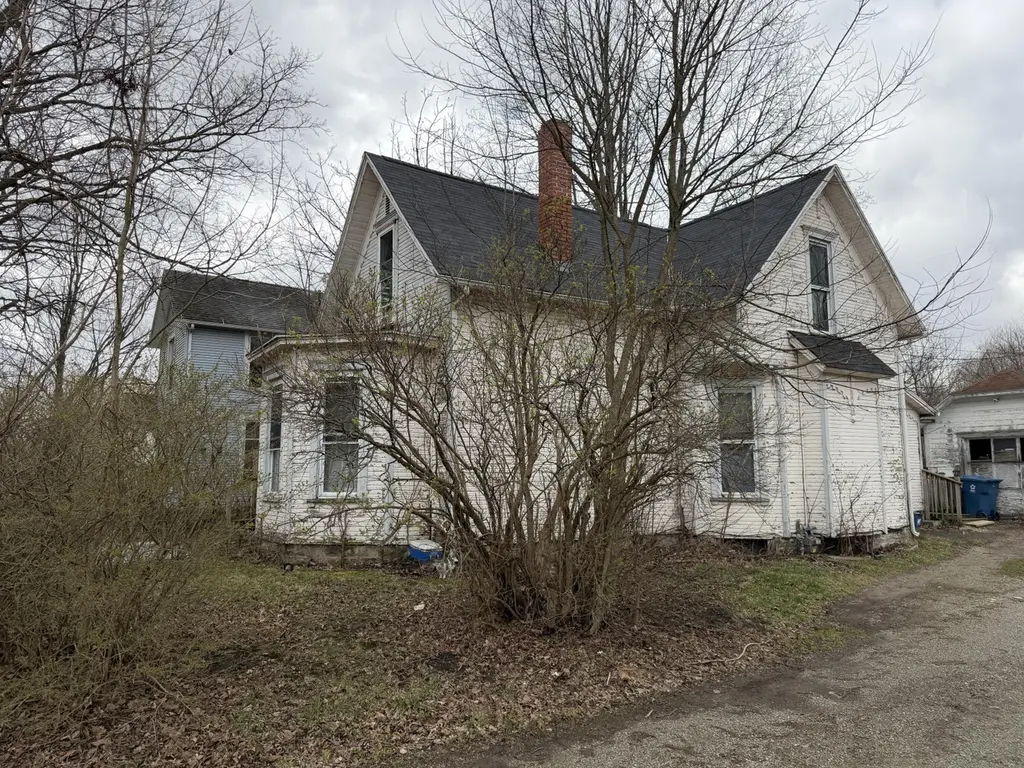
313 N Elm St · Bellefontaine, OH
Flood risk 1/10 · Minimal
- FEMA flood zone
- X (unshaded)
- Chance of flooding over 30 yrs
- 0.0%
- Est. flood insurance / yr
- $473 – $860
Fire risk 1/10 · Minimal
- Est. fire insurance / yr
- $713 – $1,323
Heat risk 3/10 · Minor
- Hot days now (above 98°F)
- 7 days/yr
- Hot days in 30 yrs
- 18 days/yr
Wind risk 2/10 · Minimal
- Chance of severe wind over 30 yrs
- —
Air-quality risk 2/10 · Minimal
- Unhealthy air days now
- 1 days/yr
- Unhealthy air days in 30 yrs
- 2 days/yr
Risk factors via First Street. Map © Google.
Why this score? — see what drove the B+ grade
The composite is a weighted blend of 9 inputs, each scored 0–100. Each bar is that input's sub-score; the figure is the points it added to the 100-point composite (weight × sub-score).
- Cash flow +30.0/30.0
- ARV discount +15.0/15.0
- 1% rule +10.0/10.0
- DSCR +10.0/10.0
- Schools +4.8/10.0
- Livability +3.8/5.0
- Rent growth +2.5/5.0
- Condition / age +2.5/5.0
- Appreciation +0.0/10.0
$99,900
🖨 Deal sheet 📄 Offer letter ✓ Due diligence
Listing remarks MLS
Investor opportunity in the heart of Bellefontaine! This 4-bedroom, 1-bath home offers strong potential for the savvy buyer looking to build equity or expand their rental portfolio. Currently tenant-occupied at $700/month, this property provides immediate cash flow while leaving room for value-add improvements. With its spacious layout and great location close to local shopping, dining, parks, and everyday amenities with a ton of upside. Whether you're looking to renovate and rent or create a long-term investment, this fixer-upper is packed with opportunity.
Key facts
- Immediate cash flow
- Tenant occupied
- Great location
Tags
Neighborhood map
What this means for you Summary
Snapshot
- This is a 4-bed/1.0-bath single-family listed at $100k.
Deal economics
- At list price, monthly cash flow is $680 ($8k/yr) — positive.
- The deal already cash-flows at list — no discount required.
- Meets the 1% rule at list price ($2k rent vs $100k).
- Recommended offer: $94k (6.0% below list) — sets the bar for market timing.
- Cap rate 14.5% vs local median 3.6% in Bellefontaine — top-decile yield for the area; either an underpriced asset or a hidden risk that comps aren't pricing in. Stress-test before assuming the spread holds.
Location & tenants
- Location reads 76/100 on livability (#213 in OH, #3,316 nationally) — a middle-class / working-renter tenant base. Strengths: crime A+, cost of living A+, housing A+; Watch: employment D+, amenities F, commute F.
- Bellefontaine City (town): math 55% / reading 59% proficiency, ranked #348 of 656 in OH (top 53%) — acceptable for families but not a draw, mixed tenant base, ~2y average lease.
- Market conditions: 152 active listings in the ZIP; 1 comparable units currently listed for rent nearby; 121 units permitted in Logan County in 2024 (0 in 5+ unit buildings).
- This rent runs 32% of the median local income ($64k/yr) — at the standard rent-burdened threshold; future hikes will face affordability resistance.
Forward outlook
- Local home prices are declining (-3.0%/yr); year-one equity from $691 of loan paydown is wiped out by about $3k of value loss. Plan a longer hold.
- Logan County population projected at -15% by 2050 — secular population decline; favor cash flow + early exit over multi-decade hold.
- At projected returns (-3.0% appreciation + 3.0% rent growth), your $28k cash investment doubles in ~5 years — after that, you're playing with house money.
Negotiation context
- It's been on market 71 days — a 6% lower offer ($94k) is reasonable based on typical stale-listing flexibility.
Risks & watch-outs
- Watch-outs: built in 1920 — expect roof / HVAC / electrical / plumbing capex.
Questions for the listing agent
- It's been on market 71 days. Have you received any prior offers? Is the seller open to a 6% concession, seller financing, or rate buy-down credit?
- Built in 1920 — when were the roof, HVAC, electrical panel, plumbing, and water heater last replaced?
- Why hasn't it sold? Are there any deal-killer items the seller is aware of (foundation, flood, title, zoning, code violations)?
- Is there a deadline driving the sale (1031 exchange, divorce, estate, relocation)? That informs how much negotiation room exists.
- What's the average days-on-market for RENTAL listings here right now (not sales)? A rising rental-DOM trend means longer vacancies and softer asking-rent achievability than the comps imply.
- What's the recent tenant-quality profile in this submarket — average credit score on applications, eviction rate, late-payment / NSF rate, and stable-employment percentage? A property-management company in the area should have these aggregated.
- How much new for-sale + rental construction is in the pipeline within 1–3 miles? Heavy new supply typically softens prices + rents 12–24 months out; constrained supply supports both.
Investment metrics
- 1% rule
- 1.70% ✓
- Cap rate
- 14.46%
- Cash-on-cash
- 29.15%
- DSCR
- 2.30
- GRM
- 4.9
CMA / ARV
- ARV (median comp)
- $178,138
- List price
- $99,900
- Delta
- -43.92%
- Verdict
- UNDERPRICED
- Comps
- 20 within 1.0 mi
Show comp detail 12 sales within ~0.75 mi
| Address | Dist | Beds/Ba | Sqft | Sold | Price | $/sf | Match |
|---|---|---|---|---|---|---|---|
| 208 W Williams Ave | 0.18mi | 3/2.0 (-1) | 1,672 (-4%) | 4mo | $205,900 | $123 | 73 |
| 322 Clagg St | 0.31mi | 4/2.0 | 1,620 (-7%) | 4mo | $219,000 | $135 | 67 |
| 316 N Madriver St | 0.33mi | 4/1.5 | 1,612 (-7%) | 8mo | $160,000 | $99 | 64 |
| 633 N Detroit St | 0.35mi | 3/1.5 (-1) | 1,857 (+7%) | 3mo | $195,000 | $105 | 63 |
| 413 E Sandusky Ave | 0.58mi | 4/2.0 | 1,673 (-4%) | 1mo | $80,000 | $48 | 62 |
| 432 N Detroit St | 0.18mi | 3/1.5 (-1) | 1,560 (-10%) | 7mo | $177,000 | $113 | 62 |
| 308 Plumvalley St | 0.49mi | 4/2.0 | 1,630 (-6%) | 4mo | $166,630 | $102 | 60 |
| 201 E Spring Ave | 0.67mi | 3/2.0 (-1) | 1,767 (+2%) | 7mo | $115,000 | $65 | 52 |
| 221 E Patterson Ave | 0.62mi | 5/2.0 (+1) | 1,628 (-6%) | 6mo | $224,000 | $138 | 46 |
| 137 N Stanley St | 0.63mi | 3/2.0 (-1) | 1,610 (-8%) | 5mo | $181,000 | $112 | 45 |
| 921 N Main St | 0.69mi | 4/2.0 | 1,920 (+10%) | 9mo | $215,000 | $112 | 39 |
| 313 Irving Ave | 0.60mi | 3/2.5 (-1) | 1,576 (-9%) | 8mo | $261,000 | $166 | 38 |
Match score weights: distance 35% · size 25% · config 20% · recency 20%. Top-matched comps best support the ARV.
Projected returns pro-forma
-3.0% appreciation · 3.0% rent growth · sell at horizon
- IRR
- 23.6%
- Equity multiple
- 1.97×
- Total profit
- $27,103
- Equity at exit
- $14,895
- IRR
- 31.5%
- Equity multiple
- 3.84×
- Total profit
- $79,371
- Equity at exit
- $8,638
Cash invested: $27,972 (down + closing). Projections, not guarantees.
Landlord ↔ Tenant lean methodology
- Overall (STATE)
- 73 Landlord-Friendly
- State Ohio
- 73 Landlord-Friendly · R+6
- County
- — inherits STATE
- City
- — inherits STATE
ZIP-level market 43311
- Active inventory
- 152
- Price-to-rent
- 4.9×
Monthly cashflow live
- Estimated rent
- $1,700 medium interval (Pro) →
- Mortgage (P&I)
- −$524
- Tax from tax record
- −$98 /mo · $1,175/yr
- Insurance
- −$42
- HOA
- −$0
- Vacancy / Maint / Mgmt
- −$357
- Net cashflow
- $680
Break-even live
UW: 25.0% down · 7.5% · 30yr · 1.5% tax · 5.0% vac · 8.0% maint · 8.0% mgmt
Financing live
Cash to close
- Down payment
- $24,975
- Closing costs
- $2,997
- Reserves months
- —
- Total cash needed
- —
Loan-product check · same deal, 3 products live
Conventional
25% down · 7.5% · 30yr
- Down + closing
- —
- Monthly P&I
- —
- Monthly cashflow
- —
- DSCR
- —
- Eligible?
- —
Personal DTI + credit; lowest rate.
DSCR
20% down · 8.5% · 30yr
- Down + closing
- —
- Monthly P&I
- —
- Monthly cashflow
- —
- DSCR
- —
- Eligible?
- —
No personal income docs; deal must DSCR.
Hard money
10% down · 12.0% · 12mo
- Down + closing
- —
- Monthly P&I
- —
- Monthly cashflow
- —
- DSCR
- —
- Eligible?
- —
Short-term bridge; refi at stabilization.
Rent comps 1 comps
| Address | Beds | Baths | Sqft | Rent | $/sqft | DOM | Units | Dist |
|---|---|---|---|---|---|---|---|---|
| 520 N Madriver St Bellefontaine, OH | 4.0 | 1.5 | 1600 | $1,700 | $1.06 | 44d | 1 | 0.36mi |
Listing history 16 events
-
2026-06-18days on market $99,900 Active 71 DOM
-
2026-06-17days on market $99,900 Active 70 DOM
-
2026-06-16days on market $99,900 Active 69 DOM
-
2026-06-15days on market $99,900 Active 68 DOM
-
2026-06-13days on market $99,900 Active 66 DOM
-
2026-06-12days on market $99,900 Active 65 DOM
-
2026-06-09days on market $99,900 Active 62 DOM
-
2026-06-08days on market $99,900 Active 61 DOM
-
2026-06-07days on market $99,900 Active 60 DOM
-
2026-06-07days on market $99,900 Active 59 DOM
-
2026-06-04days on market $99,900 Active 56 DOM
-
2026-06-02days on market $99,900 Active 55 DOM
-
2026-06-01days on market $99,900 Active 54 DOM
-
2026-05-31days on market $99,900 Active 53 DOM
-
2026-04-27price $124,900 568-char remark
Show marketing remark (568 chars)
Investor opportunity in the heart of Bellefontaine! This 4-bedroom, 1-bath home offers strong potential for the savvy buyer looking to build equity or expand their rental portfolio. Currently tenant-occupied at $700/month, this property provides immediate cash flow while leaving room for value-add improvements. With its spacious layout and great location close to local shopping, dining, parks, and everyday amenities with a ton of upside. Whether you're looking to renovate and rent or create a long-term investment, this fixer-upper is packed with opportunity.
-
2026-04-08$139,900 Active 568-char remark
Show marketing remark (568 chars)
Investor opportunity in the heart of Bellefontaine! This 4-bedroom, 1-bath home offers strong potential for the savvy buyer looking to build equity or expand their rental portfolio. Currently tenant-occupied at $700/month, this property provides immediate cash flow while leaving room for value-add improvements. With its spacious layout and great location close to local shopping, dining, parks, and everyday amenities with a ton of upside. Whether you're looking to renovate and rent or create a long-term investment, this fixer-upper is packed with opportunity.
ⓘ Source: listings_history table (triggers on properties + properties_extension) + one-shot
backfill from property_details.listing_events for pre-trigger history.
Tax reassessment forecast OH · Partial reset (capped growth)
- Current annual tax
- $1,175 · $98/mo
- Projected year-2 tax
- $1,367 · $114/mo
- Expected delta
- +$192/yr (+$16/mo · 16.3%)
ⓘ Screening estimate from a state-policy table — verify with the county assessor before closing.
Climate risk First Street
- Flood 1/10 Low FEMA zone X (unshaded) · 0% chance over 30 yrs
- Wildfire 1/10 Low
- Heat 3/10 Moderate 7 d/yr ≥98°F today · 18 d/yr by 30 yrs out
- Wind 2/10 Low
- Air quality 2/10 Low 1 unhealthy d/yr today · 2 by 30 yrs out
Nearby sold comps map
Loading sold comps map…
Walkable amenities ~0.75 mi
Loading nearby amenities…
Taxation est. · year 1
- Rental income
- $20,400
- − Mortgage interest
- −$5,596
- − Property taxes
- −$1,175
- − Insurance
- −$500
- − Repairs & maintenance
- −$1,632
- − Management
- −$1,632
- − Depreciation
- −$2,906
- Taxable income
- $6,959
- Est. tax owed @ 24.0%
- −$1,670
- After-tax cash flow
- $6,485/yr
For passive investors: Depreciation is non-cash, so a rental often shows a tax loss while cash-flowing — sheltering income. Rental losses are passive: they offset passive income freely, and up to $25,000/yr can offset ordinary (W-2) income if you actively participate and your MAGI is under $100k (phasing out to $0 by $150k); unused losses carry forward. On sale, claimed depreciation is recaptured at up to 25%, and gains may owe capital-gains tax (a 1031 exchange can defer both). Figures are a year-1 estimate at your 24.0% rate — not tax advice; consult a CPA.
Schools (NCES district)
- District
- Bellefontaine City
- NCES district ID
- 3904358
- Math proficiency
- 55% ▼ -10.00%
- Reading proficiency
- 59% ▼ -6.00%
- Median HH income
- $43,270
- Composite
- 47.94/100
- National rank
- #2207
- State rank
- #348 of 656 in OH
Livability — Bellefontaine
- Score
- 76/100
- State rank
- #213
- US rank
- #3316
Category grades
Schools grade is shown separately in the Schools card above.
Census & demographics
- Census place
- Bellefontaine, OH
- County
- Logan · 47,256 people
- City population
- 20,074
- Population (ZIP)
- 20,074
- Household income
- $64,217
- Rent vs Own
- Severe rent burden
- 10.1
Population outlook (Logan County) Hauer SSP2
- Today (2025)
- 44,240 people
- By 2030
- 43,166 · -2.4%
- By 2040
- 40,495 · -8.5%
- By 2050
- 37,511 · -15.2%
- By 2075
- 30,453 · -31.2%
- By 2100
- 23,081 · -47.8%
Race, ethnicity, and origin ACS 2023
- Neighborhood character
- Predominantly White (90%)
- Race & ethnicity
- White 90% Two or more races 5% Black 3% Hispanic / Latino 2%
- Common ancestry
- Italian 4% Slovak 4% Lithuanian 2%
- Foreign-born
- 2% · Canada
- Languages at home
- 98% English-only · Spanish 1%
Political lean MEDSL · Logan
- 2024 margin
- Solid R (+56.2) · D 21.5% · R 77.7%
- 2008→2024 swing
- -29.6pp toward R · 2008: -26.6pp · 2024: -56.2pp
- All cycles
- 2024: R+56.2 2020: R+55.2 2016: R+52.6 2012: R+31.8 2008: R+26.6
Not yet ingested
- Civics
- —
Market trends
- HPI YoY
- ▼ -182.18%
- Current HPI
- 243.9954
- Rent YoY
- —
- Metro
- —
- State GDP YoY
- ▲ 1.98%
- F500 in state
- 48
Industry mix (Fortune 500 HQ in OH)
| Industry | F500 HQs | Revenue |
|---|---|---|
| Insurance | 3 | $145B |
|
||
| Industrial Machinery | 3 | $49B |
|
||
| Financial Services | 3 | $24B |
|
||
| Consumer Goods | 2 | $93B |
|
||
| Aerospace / Defense | 2 | $47B |
|
||
| Utilities | 2 | $33B |
|
||
Price history
-10.7% since first listed2 events — show timeline
- 2026-04-27 Price Changed $124,900 WRIST
- 2026-04-08 Listed $139,900 WRIST
Property tax history
+3.8%/yrLatest (2025): $1,175 · +34.0% YoY. Source: county tax records.
Cash-flow waterfall
monthlySold comps — $/sqft
last 12 mo · ≤1 miLoading sold comps…