6297 Rolling Fork Rd Unit 103 · North Charleston, SC
Flood risk 1/10 · Minimal
- FEMA flood zone
- X (unshaded)
- Chance of flooding over 30 yrs
- 0.0%
- Est. flood insurance / yr
- $507 – $1,088
Fire risk 3/10 · Minor
- Est. fire insurance / yr
- $783 – $1,453
Heat risk 9/10 · Severe
- Hot days now (above 107°F)
- 7 days/yr
- Hot days in 30 yrs
- 18 days/yr
Wind risk 8/10 · Major
- Chance of severe wind over 30 yrs
- 99.0%
Air-quality risk 3/10 · Minor
- Unhealthy air days now
- 3 days/yr
- Unhealthy air days in 30 yrs
- 3 days/yr
Risk factors via First Street. Map © Google.
Why this score? — see what drove the C- grade
The composite is a weighted blend of 9 inputs, each scored 0–100. Each bar is that input's sub-score; the figure is the points it added to the 100-point composite (weight × sub-score).
- Cash flow +20.3/30.0
- ARV discount +7.5/15.0
- DSCR +6.4/10.0
- 1% rule +4.3/10.0
- Schools +4.3/10.0
- Livability +3.3/5.0
- Rent growth +2.8/5.0
- Condition / age +2.5/5.0
- Appreciation +0.0/10.0
$174,000
🖨 Deal sheet (PDF) 📄 Offer letter ✓ Due diligence
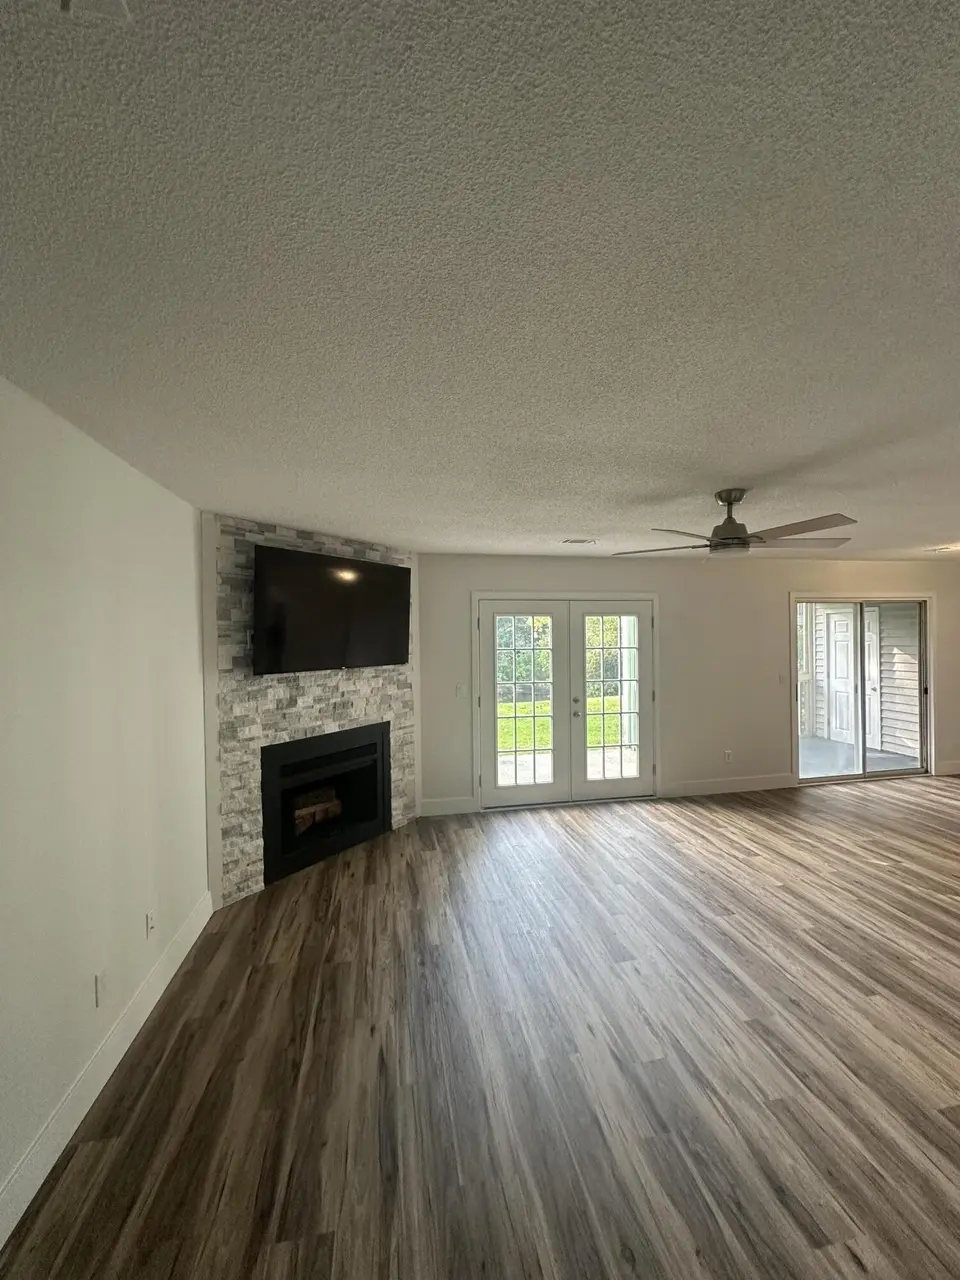
Listing remarks
Beautifully updated 2bed 2bath condo with new HVAC, stainless steel appliances, granite counter tops, flooring and pool
Key facts
- Community pool
- Built 1985
- Listed 34 days
Property features AI
Finance
- HOA & community: Community pool
Exterior
- Parking: Off-street parking spaces
- Utilities: Public sewer; Charleston Water Service; Dominion Energy
- Home design: Residential property; One story; Located in Woodhill Place subdivision
- Construction: No additional outbuildings / other structures
- Exterior features: In-ground community pool; Pond onsite / pond frontage
Interior
- Kitchen: Dishwasher; Disposal; Electric range; Microwave; Refrigerator
- Bedrooms: 2 bedrooms with multiple closets in the primary bedroom
- Flooring: Vinyl flooring
- Bathrooms: 2 bathrooms
- Heating & cooling: Central heat with heat pump; Central air conditioning
- Interior features: Wood-burning fireplace in the living room; Laundry room
- Laundry & utility: Washer hookup; Electric dryer hookup
Neighborhood map
What this means for you Summary
Snapshot
- This is a 2-bed/2.0-bath condo listed at $174k.
Deal economics
- At list price, monthly cash flow is $222 ($3k/yr) — positive.
- The deal already cash-flows at list — no discount required.
- To meet the 1% rule (rent ≥ 1% of price), the offer needs to be $162k (6.7% below list).
- Recommended offer: $162k (6.7% below list) — sets the bar for 1% rule.
- Cap rate 7.8% vs local median 4.0% in North Charleston — top-decile yield for the area; either an underpriced asset or a hidden risk that comps aren't pricing in. Stress-test before assuming the spread holds.
Location & tenants
- Location reads 66/100 on livability (#122 in SC) — a middle-class / working-renter tenant base. Strengths: housing A+, health & safety A+, cost of living A; Watch: employment C-, crime F, amenities F.
- Charleston 01 (urban): math 48% / reading 53% proficiency, ranked #7 of 80 in SC (top 9%) — acceptable for families but not a draw, mixed tenant base, ~2y average lease.
- Zoned schools: Midland Park Primary (450 students, 100% FRL); Morningside Middle (math 4% / reading 12%, grade F, #226 of 229 statewide, top 99%, 567 students, 100% FRL); Rb Stall High (math 49% / reading 63%, grade C, #126 of 196 statewide, top 65%, 1,952 students, 100% FRL) — zoned schools average 100% FRL vs 44% district-wide (56 pts higher); higher-poverty schools than district average — tighter screening recommended.
- Zoned-school proficiency averages 32% at this address vs 50% district-wide (-18 pts) — the specific schools serving this property underperform the Charleston 01 average; the district grade overstates school quality for this exact location.
- Market conditions: Rents rising (+1.4%/yr); 174 active listings in the ZIP; 26 comparable units currently listed for rent nearby; rentals at typical pace (median 20d on market — plan ~3-4 weeks tenant-placement turnaround); 4,156 units permitted in Charleston County in 2024 (857 in 5+ unit buildings).
- This rent runs 39% of the median local income ($50k/yr) — at the standard rent-burdened threshold; future hikes will face affordability resistance.
Forward outlook
- Local home prices are declining (-3.0%/yr); year-one equity from $1k of loan paydown is wiped out by about $5k of value loss. Plan a longer hold.
- Charleston County population projected at +44% by 2050 — long-run rental-demand tailwind backs the buy-and-hold thesis.
Negotiation context
- It's been on market 34 days — a 3% lower offer ($169k) is reasonable based on typical stale-listing flexibility.
- 5 sale attempts since 21y ago; this cycle's ask has dropped $14k (7%) from the opening price — seller is motivated, your offer sets the floor, not the list.
- Current owner paid $86k; list at $174k implies a 101% gain — meaningful room to come down on a strong offer.
Risks & watch-outs
- Climate carrying-cost: severe wind risk, 99% chance of damaging wind over 30y; extreme-heat days projected 7→18/yr by 2055 (HVAC capex compounding) — expect insurance premiums to compound above CPI over the hold.
Questions for the listing agent
- It's been on market 34 days. Have you received any prior offers? Is the seller open to a 7% concession, seller financing, or rate buy-down credit?
- Any open or pending special assessments — roof, HVAC, plumbing, elevator, façade? What's the per-unit balance and payoff schedule, and is the seller paying it off at close or rolling it to the buyer?
- Is there a deadline driving the sale (1031 exchange, divorce, estate, relocation)? That informs how much negotiation room exists.
- Crime grade is F in this area — have there been break-ins, vandalism, or insurance claims at this property in the last 3 years? What carrier currently insures it and at what premium?
- What's the average days-on-market for RENTAL listings here right now (not sales)? A rising rental-DOM trend means longer vacancies and softer asking-rent achievability than the comps imply.
- What's the recent tenant-quality profile in this submarket — average credit score on applications, eviction rate, late-payment / NSF rate, and stable-employment percentage? A property-management company in the area should have these aggregated.
- How much new apartment / multifamily construction is in the pipeline within 1–3 miles? Heavy new supply (>2% of stock underway) typically softens rents 12–24 months out; light construction supports rent growth.
Investment metrics
- 1% rule
- 0.93% ✗
- Cap rate
- 7.83%
- Cash-on-cash
- 5.48%
- DSCR
- 1.24
- GRM
- 8.9
CMA / ARV
No comps found within radius.
Projected returns pro-forma
-3.0% appreciation · 1.37% rent growth · sell at horizon
- IRR
- -9.5%
- Equity multiple
- 0.66×
- Total profit
- $-16,714
- Equity at exit
- $25,944
- IRR
- -2.3%
- Equity multiple
- 0.86×
- Total profit
- $-6,979
- Equity at exit
- $15,044
Cash invested: $48,720 (down + closing). Projections, not guarantees.
Landlord ↔ Tenant lean methodology
- Overall (STATE)
- 90 Strongly Landlord-Friendly
- State South Carolina
- 90 Strongly Landlord-Friendly · R+6
- County
- — inherits STATE
- City
- — inherits STATE
ZIP-level market 29406
- Home prices YoY
- -6.7%
- Rents YoY
- 1.4%
- Active inventory
- 174
- Price-to-rent
- 8.9×
Monthly cashflow live
- Estimated rent
- $1,624 high interval (Pro) →
- Mortgage (P&I)
- −$912
- Tax from tax record
- −$76 /mo · $910/yr
- Insurance
- −$72
- HOA
- −$0
- Vacancy / Maint / Mgmt
- −$341
- Net cashflow
- $222
Break-even live
Sensitivity live
| Price | -10% $321 | -5% $272 | +0% $222 | +5% $173 | +10% $124 |
|---|---|---|---|---|---|
| Rent | -10% $94 | -5% $158 | +0% $222 | +5% $287 | +10% $351 |
| Rate | -1.0pp $310 | -0.5pp $267 | base $222 | +0.5pp $177 | +1.0pp $131 |
UW: 25.0% down · 7.5% · 30yr · 1.5% tax · 5.0% vac · 8.0% maint · 8.0% mgmt
Financing live
Cash to close
- Down payment
- $43,500
- Closing costs
- $5,220
- Reserves months
- —
- Total cash needed
- —
Loan-product check · same deal, 3 products live
Conventional
25% down · 7.5% · 30yr
- Down + closing
- —
- Monthly P&I
- —
- Monthly cashflow
- —
- DSCR
- —
- Eligible?
- —
Personal DTI + credit; lowest rate.
DSCR
20% down · 8.5% · 30yr
- Down + closing
- —
- Monthly P&I
- —
- Monthly cashflow
- —
- DSCR
- —
- Eligible?
- —
No personal income docs; deal must DSCR.
Hard money
10% down · 12.0% · 12mo
- Down + closing
- —
- Monthly P&I
- —
- Monthly cashflow
- —
- DSCR
- —
- Eligible?
- —
Short-term bridge; refi at stabilization.
Rent comps 26 comps
| Address | Beds | Baths | Sqft | Rent | $/sqft | DOM | Units | Dist |
|---|---|---|---|---|---|---|---|---|
| 2020 Coldspring Dr Unit F North Charleston, SC | 2.0 | 2.0 | 921 | $1,750 | $1.90 | 24d | 1 | 0.01mi |
| 2020 Coldspring Dr North Charleston, SC | 2.0 | 2.0 | 921 | $1,700 | $1.85 | 24d | 1 | 0.01mi |
| 6211 Rolling Fork Rd Apt E North Charleston, SC | 2.0 | 2.0 | 988 | $1,700 | $1.72 | 24d | 1 | 0.09mi |
| 6280 Lucille Dr Unit D North Charleston, SC | 2.0 | 1.5 | 1066 | $1,450 | $1.36 | 24d | 1 | 0.15mi |
| 6248 Lucille Dr Unit 15F North Charleston, SC | 2.0 | 1.5 | 1066 | $1,530 | $1.44 | 15d | 1 | 0.20mi |
| 1945 Hanahan Rd Charleston, SC | 1.0–2.0 | 1.0–2.0 | 994 | $1,936 | $1.95 | 3d | 13 | 0.41mi |
| 6600 Rivers Ave North Charleston, SC | 1.0–3.0 | 1.0 | 809 | $1,277 | $1.58 | 3d | 13 | 0.56mi |
| 1901 Gumwood Blvd Unit F North Charleston, SC | 2.0 | 1.0 | 1100 | $900 | $0.82 | 22d | 1 | 0.70mi |
| 6880 Rivers Ave North Charleston, SC | 1.0–2.0 | 1.0–2.0 | 946 | $1,904 | $2.01 | 3d | 19 | 0.82mi |
| 6220 Murray Dr Hanahan, SC | 1.0–2.0 | 1.0 | 792 | $1,263 | $1.59 | 24d | 4 | 0.89mi |
| 1100 River Rd Hanahan, SC | 2.0 | 1.0 | 850 | $1,245 | $1.46 | 3d | 4 | 0.91mi |
| 6935 Rivers Ave Charleston, SC | 2.0–3.0 | 2.0 | 875 | $1,431 | $1.64 | 3d | 1 | 1.04mi |
| 5902 Park St Hanahan, SC | 3.0 | 1.0 | 1100 | $1,650 | $1.50 | 12d | 1 | 1.12mi |
| 5902 Park St Hanahan, SC | 3.0 | 1.0 | 1100 | $1,650 | $1.50 | 3d | 1 | 1.12mi |
| 5806 Sledge St Hanahan, SC | 2.0 | 2.0 | 1000 | $1,600 | $1.60 | 15d | 1 | 1.13mi |
| 1815 Sumner Ave North Charleston, SC | 2.0 | 1.0 | 625 | $1,500 | $2.40 | 15d | 2 | 1.29mi |
| 5555 Mole Ln Apt B1 North Charleston, SC | 2.0 | 1.0 | 625 | $1,600 | $2.56 | 24d | 1 | 1.35mi |
| 5555 Mole Ln North Charleston, SC | 2.0 | 1.0 | 625 | $1,620 | $2.59 | 12d | 4 | 1.35mi |
| 5475 Califf Rd Charleston, SC | 2.0 | 1.0 | 750 | $1,350 | $1.80 | 24d | 1 | 1.38mi |
| 5527 Read St Apt 28 North Charleston, SC | 2.0 | 1.0 | 570 | $1,450 | $2.54 | 19d | 1 | 1.38mi |
| 5527 Read St Apt 21 North Charleston, SC | 2.0 | 1.0 | 570 | $1,499 | $2.63 | 19d | 1 | 1.38mi |
| 5739 Salvo ST , SC | 2.0 | 2.0 | 994 | $1,495 | $1.50 | 24d | 1 | 1.44mi |
| 2557 Midland Park Rd Charleston, SC | 1.0 | 1.0 | 600 | $990 | $1.65 | 24d | 2 | 1.44mi |
| 1441 Remount Rd North Charleston, SC | 2.0–3.0 | 1.0–2.0 | 837 | $1,500 | $1.79 | 15d | 3 | 1.50mi |
| 1441 Remount Rd Unit 14 North Charleston, SC | 2.0 | 1.0 | 625 | $1,500 | $2.40 | 24d | 1 | 1.50mi |
| 1441 Remount Rd Unit 12 North Charleston, SC | 3.0 | 2.0 | 1050 | $2,030 | $1.93 | 24d | 1 | 1.50mi |
HOA detail condo
- Monthly dues
- $0 · $0/yr
- Likely covers
- pool
- Assessments
- None detected in remarks — confirm with the listing agent.
Listing history 25 events
-
2026-06-18days on market $174,000 Active 34 DOM
-
2026-06-17days on market $174,000 Active 33 DOM
-
2026-06-16days on market $174,000 Active 32 DOM
-
2026-06-15days on market $174,000 Active 31 DOM
-
2026-06-10days on market $174,000 Active 26 DOM
-
2026-06-09days on market $174,000 Active 25 DOM
-
2026-06-08days on market $174,000 Active 24 DOM
-
2026-06-07days on market $174,000 Active 23 DOM
-
2026-06-05pricedays on market $174,000 Active 20 DOM
-
2026-06-03days on market $178,000 Active 19 DOM
-
2026-06-01days on market $178,000 Active 17 DOM
-
2026-05-31days on market $178,000 Active 16 DOM
-
2026-05-22price $182,000
-
2026-05-15$188,000 Active
-
2026-03-03soldstatus $86,500
-
2015-02-06historical
-
2009-08-28$69,900
-
2007-06-08historical
-
2007-04-14$83,000
-
2007-04-12historical
-
2006-11-21$89,900
-
2005-11-01soldstatus $75,000
-
2005-10-31soldstatus $75,000
-
2005-09-28$73,900
-
1986-11-26soldstatus $52,000
ⓘ Source: listings_history table (triggers on properties + properties_extension) + one-shot
backfill from property_details.listing_events for pre-trigger history.
Tax reassessment forecast SC · Resets to sale price
- Current annual tax
- $910 · $76/mo
- Projected year-2 tax
- $992 · $83/mo
- Expected delta
- +$82/yr (+$7/mo · 9.0%)
ⓘ Screening estimate from a state-policy table — verify with the county assessor before closing.
Climate risk First Street
- Flood 1/10 Low FEMA zone X (unshaded) · 0% chance over 30 yrs
- Wildfire 3/10 Moderate
- Heat 9/10 Extreme 7 d/yr ≥107°F today · 18 d/yr by 30 yrs out
- Wind 8/10 Severe 99% chance of damaging wind over 30 yrs
- Air quality 3/10 Moderate 3 unhealthy d/yr today · 3 by 30 yrs out
Nearby sold comps map
Loading sold comps map…
Walkable amenities ~0.75 mi
Loading nearby amenities…
Taxation est. · year 1
- Rental income
- $19,491
- − Mortgage interest
- −$9,747
- − Property taxes
- −$910
- − Insurance
- −$870
- − Repairs & maintenance
- −$1,559
- − Management
- −$1,559
- − Depreciation
- −$5,062
- Taxable loss
- −$215
- Est. tax savings @ 24.0%
- +$52
- After-tax cash flow
- $2,721/yr
For passive investors: Depreciation is non-cash, so a rental often shows a tax loss while cash-flowing — sheltering income. Rental losses are passive: they offset passive income freely, and up to $25,000/yr can offset ordinary (W-2) income if you actively participate and your MAGI is under $100k (phasing out to $0 by $150k); unused losses carry forward. On sale, claimed depreciation is recaptured at up to 25%, and gains may owe capital-gains tax (a 1031 exchange can defer both). Figures are a year-1 estimate at your 24.0% rate — not tax advice; consult a CPA.
Schools (NCES district)
- District
- Charleston 01
- NCES district ID
- 4501440
- Math proficiency
- 48% ▼ -2.00%
- Reading proficiency
- 53% ▬ 0.00%
- Median HH income
- $52,376
- Composite
- 43.41/100
- National rank
- #3018
- State rank
- #7 of 80 in SC
Livability — North Charleston
- Score
- 66/100
- State rank
- #122
- US rank
- #12222
Category grades
Schools grade is shown separately in the Schools card above.
Census & demographics
- Census place
- North Charleston, SC
- County
- Charleston County · 366,793 people
- City population
- 108,266
- Metro
- Charleston-North Charleston, SC
- Population (ZIP)
- 32,001
- Household income
- $49,815
- Rent vs Own
- Severe rent burden
- 2054.0
Population outlook (Charleston County) Hauer SSP2
- Today (2025)
- 480,562 people
- By 2030
- 525,921 · +9.4%
- By 2040
- 612,189 · +27.4%
- By 2050
- 691,627 · +43.9%
- By 2075
- 847,979 · +76.5%
- By 2100
- 926,482 · +92.8%
Race, ethnicity, and origin ACS 2023
- Neighborhood character
- Diverse neighborhood (Simpson 0.70)
- Race & ethnicity
- Black 40% White 32% Hispanic / Latino 19% Two or more races 9% Asian 3%
- Hispanic origin (detail)
- Mexican 10% Puerto Rican 1%
- Common ancestry
- Romanian 1% Italian 1% Lithuanian 1%
- Foreign-born
- 15% · Canada, Vietnam
- Languages at home
- 79% English-only · Spanish 17% Vietnamese 1% Tagalog/Filipino 1%
Political lean MEDSL · Charleston
- 2024 margin
- Lean D (+5.7) · D 51.9% · R 46.3% · Other 1.8%
- 2008→2024 swing
- -2.7pp toward R · 2008: 8.3pp · 2024: 5.7pp
- All cycles
- 2024: D+5.7 2020: D+12.9 2016: D+7.9 2012: D+2.4 2008: D+8.3
Not yet ingested
- Civics
- —
Market trends
- HPI YoY
- ▼ -27.09%
- Current HPI
- 374.9164
- Rent YoY
- ▲ 1.37%
- Metro
- Charleston-North Charleston, SC
- State GDP YoY
- ▲ 4.51%
- F500 in state
- 2
Industry mix (Fortune 500 HQ in SC)
| Industry | F500 HQs | Revenue |
|---|---|---|
| Packaging | 1 | $7B |
|
||
Price history
+250.0% since first listed13 events — show timeline
- 2026-05-22 Price Changed $182,000 Charleston Trident MLS
- 2026-05-15 Listed $188,000 Charleston Trident MLS
- 2026-03-03 Sold (Public Records) $86,500 Public Records
- 2015-02-06 Listing Removed — Charleston Trident MLS
- 2009-08-28 Listed $69,900 Charleston Trident MLS
- 2007-06-08 Listing Removed — Charleston Trident MLS
- 2007-04-14 Listed $83,000 Charleston Trident MLS
- 2007-04-12 Listing Removed — Charleston Trident MLS
- 2006-11-21 Listed $89,900 Charleston Trident MLS
- 2005-11-01 Sold (Public Records) $75,000 Public Records
- 2005-10-31 Sold (MLS) $75,000 Charleston Trident MLS
- 2005-09-28 Listed $73,900 Charleston Trident MLS
- 1986-11-26 Sold (Public Records) $52,000 Public Records
Property tax history
-1.0%/yrLatest (2022): $910 · +0.7% YoY. Source: county tax records.
Cash-flow waterfall
monthlySold comps — $/sqft
last 12 mo · ≤1 miLoading sold comps…