553 Lake Rd · Pine Plains, NY
Flood risk 5/10 · Moderate
- FEMA flood zone
- X (unshaded)
- Chance of flooding over 30 yrs
- 0.27%
- Est. flood insurance / yr
- $473 – $860
Fire risk 5/10 · Moderate
- Est. fire insurance / yr
- $691 – $1,283
Heat risk 3/10 · Minor
- Hot days now (above 95°F)
- 7 days/yr
- Hot days in 30 yrs
- 16 days/yr
Wind risk 4/10 · Minor
- Chance of severe wind over 30 yrs
- 11.0%
Air-quality risk 2/10 · Minimal
- Unhealthy air days now
- 1 days/yr
- Unhealthy air days in 30 yrs
- 3 days/yr
Risk factors via First Street. Map © Google.
Why this score? — see what drove the D- grade
The composite is a weighted blend of 9 inputs, each scored 0–100. Each bar is that input's sub-score; the figure is the points it added to the 100-point composite (weight × sub-score).
- ARV discount +10.4/15.0
- Appreciation +10.0/10.0
- Schools +4.8/10.0
- Cash flow +3.2/30.0
- Livability +3.2/5.0
- Rent growth +2.5/5.0
- Condition / age +2.5/5.0
- 1% rule +0.0/10.0
- DSCR +0.0/10.0
$639,000
🖨 Deal sheet 📄 Offer letter ✓ Due diligence
Listing remarks MLS
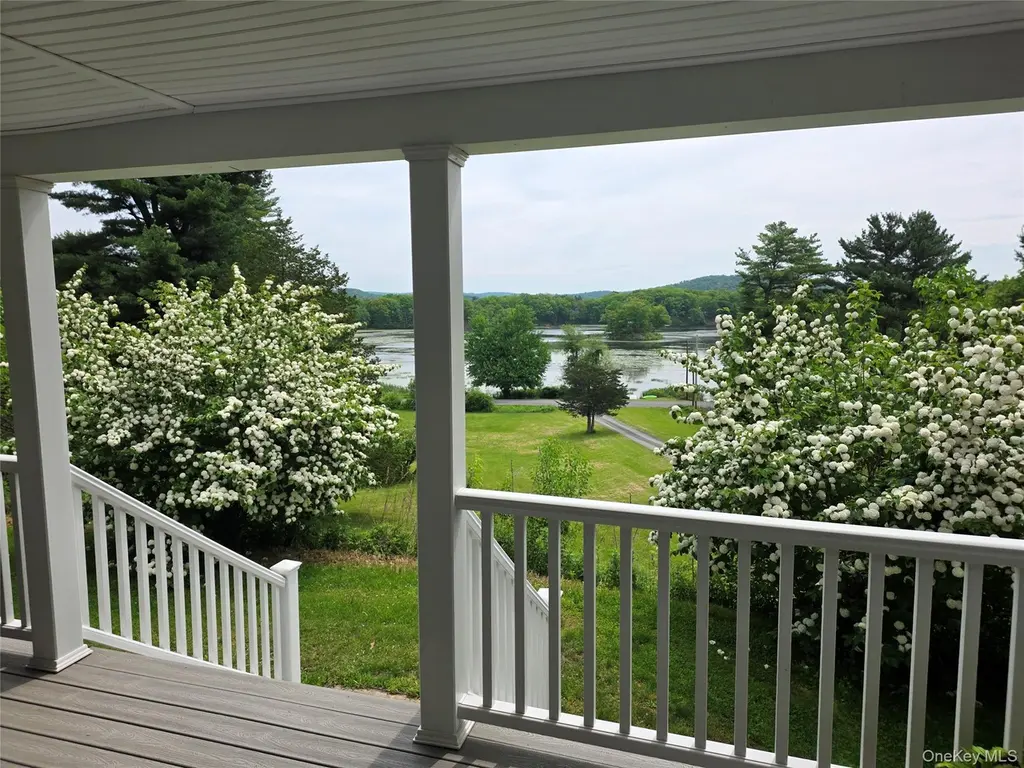
Charming Ranch Style Home Sited High On A Hilltop With Sweeping Views Of Stissing Lake. Main Level Offers Three Bedrooms, Living Room With Fireplace And A Year-Round Sun Room. Lower Level Is Also Finished Providing Plenty Of Additional Living Space Including A Summer Kitchen.
Key facts
- 3.7 acre lot
- 4 garage spots
- Built 1985
Property features AI
Exterior
- Parking: Detached garage; Driveway; Heated garage; Total of 4 garage spaces
- Utilities: Septic tank; Electricity connected; Private trash collection
- Home design: Single-family residence; Updated/remodeled condition
- Construction: Other foundation details
- Exterior features: Other construction materials; Additional garage structures on the property; Not waterfront
Interior
- Kitchen: Range; Refrigerator; Walk-through kitchen layout
- Bedrooms: Master downstairs; First floor bedroom
- Flooring: Hardwood; Laminate; Vinyl
- Bathrooms: 2 full bathrooms; 1 half bathroom
- Heating & cooling: Oil heating; No central air
- Interior features: First-floor bedroom; First-floor full bathroom; Natural woodwork; Open floor plan; Primary bathroom; Master suite on main level; Walk-through kitchen; Washer/dryer hookup; Finished full basement with walk-out access; Crawl attic; 10 total rooms
- Laundry & utility: Washer/dryer hookup; Generator on property
Neighborhood map
What this means for you Summary
Snapshot
- This is a 3-bed/2.5-bath single-family listed at $639k.
Deal economics
- At list price, monthly cash flow is $-2k ($-24k/yr) — negative.
- To cash-flow at today's rent, offer at most $285k (55.4% below list).
- To meet the 1% rule (rent ≥ 1% of price), the offer needs to be $274k (57.1% below list).
- Recommended offer: $274k (57.1% below list) — sets the bar for 1% rule.
Location & tenants
- Location reads 64/100 on livability (#746 in NY) — a middle-class / working-renter tenant base. Strengths: crime A+, housing A+, employment B+; Watch: cost of living D+, amenities F, commute F.
- Pine Plains Central School District (rural): math 55% / reading 50% proficiency, ranked #372 of 755 in NY (top 49%) — acceptable for families but not a draw, mixed tenant base, ~2y average lease.
- Zoned schools: Cold Spring Early Learning Center (165 students, 12% FRL); Stissing Mountain Junior/Senior High School (math 92% / reading 75%, grade A, #409 of 1,100 statewide, top 39%, 460 students, 36% FRL) — zoned schools at 24% FRL track the district average.
- Zoned-school proficiency averages 84% at this address vs 52% district-wide (+31 pts) — the actual schools serving this property are materially stronger than the Pine Plains Central School District average implies; a family-tenant draw the district grade alone would hide.
- Market conditions: 39 active listings in the ZIP; 4 comparable units currently listed for rent nearby; rentals at typical pace (median 23d on market — plan ~3-4 weeks tenant-placement turnaround); 620 units permitted in Dutchess County in 2024 (242 in 5+ unit buildings).
Forward outlook
- In year one you build about $68k of equity ($4k loan paydown + $64k appreciation (10.0% local appreciation)).
- Dutchess County population projected at -11% by 2050 — secular population decline; favor cash flow + early exit over multi-decade hold.
- By year 2, paydown + projected appreciation supports a ~$110k cash-out refi (75% LTV) — recoverable capital for the next deal without selling this one.
Negotiation context
- Only 14 days on market — expect competitive offers; lowballing is unlikely to land.
- Current owner paid $237k; list at $639k implies a 170% gain — meaningful room to come down on a strong offer.
Risks & watch-outs
- Climate carrying-cost: moderate flood risk; moderate wildfire risk — expect insurance premiums to compound above CPI over the hold.
Questions for the listing agent
- What do current leases actually rent for vs. the listed asking? Can we see a recent rent roll and the last 12 months of T-12 income?
- Is there a deadline driving the sale (1031 exchange, divorce, estate, relocation)? That informs how much negotiation room exists.
- The area grade is low — what's the realistic commute time and amenity access for the typical tenant pool here? Any planned neighborhood developments (good or bad) we should know about?
- What's the average days-on-market for RENTAL listings here right now (not sales)? A rising rental-DOM trend means longer vacancies and softer asking-rent achievability than the comps imply.
- What's the recent tenant-quality profile in this submarket — average credit score on applications, eviction rate, late-payment / NSF rate, and stable-employment percentage? A property-management company in the area should have these aggregated.
- How much new for-sale + rental construction is in the pipeline within 1–3 miles? Heavy new supply typically softens prices + rents 12–24 months out; constrained supply supports both.
Investment metrics
- 1% rule
- 0.43% ✗
- Cap rate
- 2.53%
- Cash-on-cash
- -13.44%
- DSCR
- 0.40
- GRM
- 19.4
CMA / ARV
- ARV (on-the-fly)
- $683,280
- Comps found
- 2
Show comp detail 2 sales within ~0.75 mi
| Address | Dist | Beds/Ba | Sqft | Sold | Price | $/sf | Match |
|---|---|---|---|---|---|---|---|
| 37 Stissing Mountain Dr | 0.39mi | 2/2.0 (-1) | 1,624 (+4%) | 9mo | $711,000 | $438 | 60 |
| 4 Antlers Club Rd | 0.46mi | 2/2.0 (-1) | 1,620 (+4%) | 9mo | $280,500 | $173 | 58 |
Match score weights: distance 35% · size 25% · config 20% · recency 20%. Top-matched comps best support the ARV.
Projected returns pro-forma
10.0% appreciation · 3.0% rent growth · sell at horizon
- IRR
- 14.9%
- Equity multiple
- 2.23×
- Total profit
- $220,239
- Equity at exit
- $575,662
- IRR
- 14.6%
- Equity multiple
- 5.18×
- Total profit
- $748,749
- Equity at exit
- $1,241,436
Cash invested: $178,920 (down + closing). Projections, not guarantees.
Landlord ↔ Tenant lean methodology
- Overall (STATE)
- 15 Strongly Tenant-Friendly
- State New York
- 15 Strongly Tenant-Friendly · D+10
- County
- — inherits STATE
- City
- — inherits STATE
ZIP-level market 12567
- Home prices YoY
- 18.7%
- Active inventory
- 39
- Price-to-rent
- 19.4×
Monthly cashflow live
- Estimated rent
- $2,744 medium interval (Pro) →
- Mortgage (P&I)
- −$3,351
- Tax from tax record
- −$555 /mo · $6,662/yr
- Insurance
- −$266
- HOA
- −$0
- Vacancy / Maint / Mgmt
- −$576
- Net cashflow
- $-2,005
Break-even live
UW: 25.0% down · 7.5% · 30yr · 1.5% tax · 5.0% vac · 8.0% maint · 8.0% mgmt
Financing live
Cash to close
- Down payment
- $159,750
- Closing costs
- $19,170
- Reserves months
- —
- Total cash needed
- —
Loan-product check · same deal, 3 products live
Conventional
25% down · 7.5% · 30yr
- Down + closing
- —
- Monthly P&I
- —
- Monthly cashflow
- —
- DSCR
- —
- Eligible?
- —
Personal DTI + credit; lowest rate.
DSCR
20% down · 8.5% · 30yr
- Down + closing
- —
- Monthly P&I
- —
- Monthly cashflow
- —
- DSCR
- —
- Eligible?
- —
No personal income docs; deal must DSCR.
Hard money
10% down · 12.0% · 12mo
- Down + closing
- —
- Monthly P&I
- —
- Monthly cashflow
- —
- DSCR
- —
- Eligible?
- —
Short-term bridge; refi at stabilization.
Rent comps 4 comps
| Address | Beds | Baths | Sqft | Rent | $/sqft | DOM | Units | Dist |
|---|---|---|---|---|---|---|---|---|
| 34 Town Centre Rd Pine Plains, NY | 2.0 | 2.0 | 1250 | $2,742 | $2.19 | 13d | 5 | 0.79mi |
| 32 Town Centre Rd Pine Plains, NY | 2.0 | 2.0 | 1147 | $2,660 | $2.32 | 23d | 1 | 0.79mi |
| 59 Hillside Rd Pine Plains, NY | 2.0 | 2.0 | 1140 | $2,825 | $2.48 | 23d | 1 | 0.79mi |
| 20 Town Centre Rd Pine Plains, NY | 2.0 | 2.0 | 1250 | $2,750 | $2.20 | 43d | 1 | 0.83mi |
Listing history 15 events
-
2026-06-18days on market $639,000 Active 14 DOM
-
2026-06-17days on market $639,000 Active 13 DOM
-
2026-06-16days on market $639,000 Active 12 DOM
-
2026-06-15days on market $639,000 Active 11 DOM
-
2026-06-14days on market $639,000 Active 9 DOM
-
2026-06-10days on market $639,000 Active 6 DOM
-
2026-06-09days on market $639,000 Active 5 DOM
-
2026-06-08days on market $639,000 Active 4 DOM
-
2026-06-07statusdays on market $639,000 Active 3 DOM
-
2026-06-05days on market $639,000 Coming Soon 5 DOM
-
2026-06-03days on market $639,000 Coming Soon 4 DOM
-
2026-06-02days on market $639,000 Coming Soon 3 DOM
-
2026-06-01days on market $639,000 Coming Soon 2 DOM
-
2026-05-31remarks 687-char remark
-
2026-05-31$639,000 Coming Soon 1 DOM
ⓘ Source: listings_history table (triggers on properties + properties_extension) + one-shot
backfill from property_details.listing_events for pre-trigger history.
Tax reassessment forecast NY · Partial reset (capped growth)
- Current annual tax
- $6,662 · $555/mo
- Projected year-2 tax
- $8,731 · $728/mo
- Expected delta
- +$2,068/yr (+$172/mo · 31.0%)
ⓘ Screening estimate from a state-policy table — verify with the county assessor before closing.
Climate risk First Street
- Flood 5/10 Major FEMA zone X (unshaded) · 27% chance over 30 yrs
- Wildfire 5/10 Major
- Heat 3/10 Moderate 7 d/yr ≥95°F today · 16 d/yr by 30 yrs out
- Wind 4/10 Moderate 11% chance of damaging wind over 30 yrs
- Air quality 2/10 Low 1 unhealthy d/yr today · 3 by 30 yrs out
Nearby sold comps map
Loading sold comps map…
Walkable amenities ~0.75 mi
Loading nearby amenities…
Taxation est. · year 1
- Rental income
- $32,930
- − Mortgage interest
- −$35,794
- − Property taxes
- −$6,662
- − Insurance
- −$3,195
- − Repairs & maintenance
- −$2,634
- − Management
- −$2,634
- − Depreciation
- −$18,589
- Taxable loss
- −$36,579
- Est. tax savings @ 24.0%
- +$8,779
- After-tax cash flow
- $-15,275/yr
For passive investors: Depreciation is non-cash, so a rental often shows a tax loss while cash-flowing — sheltering income. Rental losses are passive: they offset passive income freely, and up to $25,000/yr can offset ordinary (W-2) income if you actively participate and your MAGI is under $100k (phasing out to $0 by $150k); unused losses carry forward. On sale, claimed depreciation is recaptured at up to 25%, and gains may owe capital-gains tax (a 1031 exchange can defer both). Figures are a year-1 estimate at your 24.0% rate — not tax advice; consult a CPA.
Schools (NCES district)
- District
- Pine Plains Central School District
- NCES district ID
- 3623040
- Math proficiency
- 55% ▬ 0.00%
- Reading proficiency
- 50% ▲ 1.00%
- Median HH income
- $66,189
- Composite
- 48.33/100
- National rank
- #4688
- State rank
- #372 of 755 in NY
Livability — Pine Plains
- Score
- 64/100
- State rank
- #746
- US rank
- #14240
Category grades
Schools grade is shown separately in the Schools card above.
Census & demographics
- City population
- 2,498
- Population (ZIP)
- 2,498
Population outlook (Dutchess County) Hauer SSP2
- Today (2025)
- 291,768 people
- By 2030
- 287,131 · -1.6%
- By 2040
- 274,881 · -5.8%
- By 2050
- 259,971 · -10.9%
- By 2075
- 235,366 · -19.3%
- By 2100
- 208,786 · -28.4%
Race, ethnicity, and origin ACS 2023
- Neighborhood character
- Predominantly White (85%)
- Race & ethnicity
- White 85% Two or more races 8% Hispanic / Latino 7% Pacific Islander 2% Asian 2%
- Hispanic origin (detail)
- Mexican 4%
- Common ancestry
- Iranian 3% Scotch-Irish 2% Romanian 2%
- Foreign-born
- 5% · Canada
- Languages at home
- 95% English-only · Spanish 3% Tagalog/Filipino 1%
Political lean MEDSL · Dutchess
- 2024 margin
- Lean D (+5.4) · D 52.7% · R 47.3%
- 2008→2024 swing
- -3.2pp toward R · 2008: 8.6pp · 2024: 5.4pp
- All cycles
- 2024: D+5.4 2020: D+9.6 2016: R+1.1 2012: D+6.6 2008: D+8.6
Not yet ingested
- Civics
- —
Market trends
- HPI YoY
- ▲ 50.77%
- Current HPI
- 322.2342
- Rent YoY
- —
- Metro
- —
- State GDP YoY
- ▲ 2.60%
- F500 in state
- 92
Industry mix (Fortune 500 HQ in NY)
| Industry | F500 HQs | Revenue |
|---|---|---|
| Financial Services | 10 | $950B |
|
||
| Consumer Goods | 9 | $162B |
|
||
| Insurance | 4 | $225B |
|
||
| Telecommunications | 2 | $144B |
|
||
| Pharmaceuticals | 2 | $112B |
|
||
| Media / Entertainment | 2 | $69B |
|
||
Price history
+170.0% since first listed5 events — show timeline
- 2026-05-30 Coming Soon $639,000 OneKey® MLS as Distributed by MLS Grid
- 2013-10-17 Sold (MLS) $236,700 HGMLS
- 2013-07-31 Price Changed $259,000 HGMLS
- 2013-07-31 Delisted — HGMLS
- 2011-11-22 Listed $236,700 HGMLS
Property tax history
+2.8%/yrLatest (2025): $6,662 · +13.6% YoY. Source: county tax records.
Cash-flow waterfall
monthlySold comps — $/sqft
last 12 mo · ≤1 miLoading sold comps…