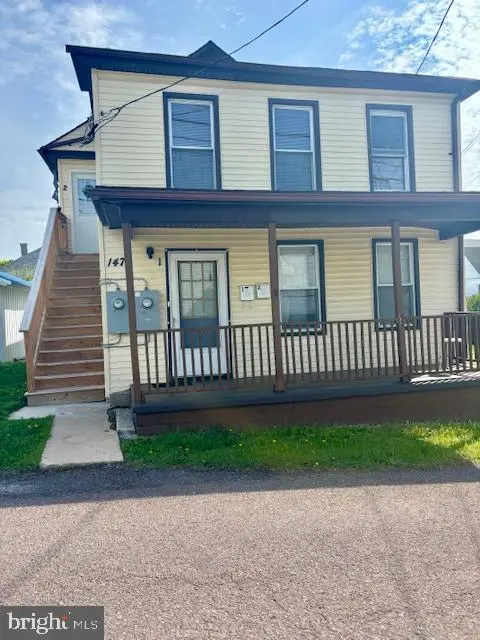
147 W Mechanic St · Frostburg, MD
Flood risk 1/10 · Minimal
- FEMA flood zone
- X (unshaded)
- Chance of flooding over 30 yrs
- 0.0%
- Est. flood insurance / yr
- $473 – $860
Fire risk 2/10 · Minimal
- Est. fire insurance / yr
- $755 – $1,403
Heat risk 2/10 · Minimal
- Hot days now (above 91°F)
- 7 days/yr
- Hot days in 30 yrs
- 17 days/yr
Wind risk 2/10 · Minimal
- Chance of severe wind over 30 yrs
- —
Air-quality risk 2/10 · Minimal
- Unhealthy air days now
- 0 days/yr
- Unhealthy air days in 30 yrs
- 1 days/yr
Risk factors via First Street. Map © Google.
Why this score? — see what drove the D grade
The composite is a weighted blend of 9 inputs, each scored 0–100. Each bar is that input's sub-score; the figure is the points it added to the 100-point composite (weight × sub-score).
- Cash flow +14.9/30.0
- ARV discount +10.4/15.0
- DSCR +4.5/10.0
- Livability +4.4/5.0
- 1% rule +3.3/10.0
- Rent growth +2.5/5.0
- Condition / age +2.5/5.0
- Schools +1.9/10.0
- Appreciation +0.0/10.0
$145,000
🖨 Deal sheet (PDF) 📄 Offer letter ✓ Due diligence
Listing remarks MLS
Duplex at its finest! Centrally located in Frostburg and has many new updates with great rental history. This property includes a second paved parcel for off street parking. The over/under units each have 2 bedrooms, seperate meters, new roof in 2021, new outdoor stairs to unit #2 and this unit also has new kitchen cabinets and granite counter tops. Please allow 48 hour notice for showings to respect the tenants.
Key facts
- Rental history
- Paved parcel
- Outdoor stairs
Tags
Neighborhood map
What this means for you Summary
Snapshot
- This is a 4-bed/2.0-bath single-family listed at $145k.
Deal economics
- At list price, monthly cash flow is $41 ($496/yr) — positive.
- The deal already cash-flows at list — no discount required.
- To meet the 1% rule (rent ≥ 1% of price), the offer needs to be $120k (17.2% below list).
- Recommended offer: $120k (17.2% below list) — sets the bar for 1% rule.
- Cap rate 6.6% vs local median 4.2% in Frostburg — top-decile yield for the area; either an underpriced asset or a hidden risk that comps aren't pricing in. Stress-test before assuming the spread holds.
Location & tenants
- Location reads 87/100 on livability (#7 in MD, #287 nationally) — a professional / high-income tenant draw. Strengths: crime A+, amenities A+, cost of living A+; Watch: employment F.
- Allegany County Public Schools (other): math 15% / reading 30% proficiency, ranked #18 of 24 in MD (top 75%) — low school quality limits family demand, transient renter base, plan for 1-2y turnover.
- Zoned schools: Beall Elementary (math 19% / reading 30%, grade F, #260 of 860 statewide, top 33%, 451 students, 63% FRL); Mount Savage Middle (math 15% / reading 38%, grade F, #86 of 225 statewide, top 40%, 425 students, 54% FRL); Mountain Ridge High School (math 32% / reading 72%, grade D+, #100 of 222 statewide, top 47%, 736 students, 48% FRL).
- Market conditions: 102 active listings in the ZIP; 1 comparable units currently listed for rent nearby; 24 units permitted in Allegany County in 2024 (0 in 5+ unit buildings).
Forward outlook
- Local home prices are declining (-3.0%/yr); year-one equity from $1k of loan paydown is wiped out by about $4k of value loss. Plan a longer hold.
- Allegany County population projected at -14% by 2050 — secular population decline; favor cash flow + early exit over multi-decade hold.
Negotiation context
- It's been on market 82 days — a 6% lower offer ($136k) is reasonable based on typical stale-listing flexibility.
- 10 sale attempts since 29y ago with the ask held roughly flat each time — persistent listings suggest the price (not the market) is what's stuck; bring a comps-based counter.
- Current owner paid $67k; list at $145k implies a 115% gain — meaningful room to come down on a strong offer.
Risks & watch-outs
- Watch-outs: built in 1920 — expect roof / HVAC / electrical / plumbing capex.
Questions for the listing agent
- It's been on market 82 days. Have you received any prior offers? Is the seller open to a 17% concession, seller financing, or rate buy-down credit?
- Built in 1920 — when were the roof, HVAC, electrical panel, plumbing, and water heater last replaced?
- Why hasn't it sold? Are there any deal-killer items the seller is aware of (foundation, flood, title, zoning, code violations)?
- Is there a deadline driving the sale (1031 exchange, divorce, estate, relocation)? That informs how much negotiation room exists.
- The area grade is low — what's the realistic commute time and amenity access for the typical tenant pool here? Any planned neighborhood developments (good or bad) we should know about?
- What's the average days-on-market for RENTAL listings here right now (not sales)? A rising rental-DOM trend means longer vacancies and softer asking-rent achievability than the comps imply.
- What's the recent tenant-quality profile in this submarket — average credit score on applications, eviction rate, late-payment / NSF rate, and stable-employment percentage? A property-management company in the area should have these aggregated.
- How much new for-sale + rental construction is in the pipeline within 1–3 miles? Heavy new supply typically softens prices + rents 12–24 months out; constrained supply supports both.
Investment metrics
- 1% rule
- 0.83% ✗
- Cap rate
- 6.64%
- Cash-on-cash
- 1.22%
- DSCR
- 1.05
- GRM
- 10.1
CMA / ARV
- ARV (median comp)
- $155,169
- List price
- $145,000
- Delta
- -6.55%
- Verdict
- FAIR
- Comps
- 20 within 1.0 mi
Show comp detail 12 sales within ~0.75 mi
| Address | Dist | Beds/Ba | Sqft | Sold | Price | $/sf | Match |
|---|---|---|---|---|---|---|---|
| 115 Main St | 0.06mi | 4/2.0 | 1,608 (-11%) | 3mo | $139,999 | $87 | 76 |
| 109 Main St | 0.05mi | 5/2.0 (+1) | 1,856 (+2%) | 16mo | $150,000 | $81 | 75 |
| 214 Albert Ave | 0.44mi | 4/2.0 | 1,806 (-0%) | 6mo | $191,000 | $106 | 74 |
| 102 Maple St | 0.44mi | 5/2.0 (+1) | 1,904 (+5%) | 10mo | $150,000 | $79 | 57 |
| 19305 Upper Consol Rd NW | 0.46mi | 3/1.5 (-1) | 1,638 (-10%) | 0mo | $210,000 | $128 | 56 |
| 28 Taylor St | 0.39mi | 3/2.0 (-1) | 1,696 (-6%) | 17mo | $100,000 | $59 | 52 |
| 131 W College Ave | 0.22mi | 3/2.0 (-1) | 1,600 (-12%) | 19mo | $340,000 | $213 | 50 |
| 153 Bowery St | 0.75mi | 5/2.0 (+1) | 1,920 (+6%) | 6mo | $130,000 | $68 | 46 |
| 16 Hill St | 0.70mi | 4/2.0 | 1,696 (-6%) | 18mo | $100,000 | $59 | 41 |
| 158 Center St | 0.61mi | 3/1.5 (-1) | 1,560 (-14%) | 1mo | $177,250 | $114 | 41 |
| 111 Wood St | 0.49mi | 5/2.0 (+1) | 1,555 (-14%) | 13mo | $220,000 | $141 | 37 |
| 180 E Mechanic St | 0.70mi | 3/2.0 (-1) | 1,604 (-12%) | 9mo | $163,000 | $102 | 36 |
Match score weights: distance 35% · size 25% · config 20% · recency 20%. Top-matched comps best support the ARV.
Projected returns pro-forma
-3.0% appreciation · 3.0% rent growth · sell at horizon
- IRR
- -14.4%
- Equity multiple
- 0.49×
- Total profit
- $-20,903
- Equity at exit
- $21,620
- IRR
- -5.7%
- Equity multiple
- 0.63×
- Total profit
- $-14,975
- Equity at exit
- $12,537
Cash invested: $40,600 (down + closing). Projections, not guarantees.
Landlord ↔ Tenant lean methodology
- Overall (STATE)
- 27 Tenant-Leaning
- State Maryland
- 27 Tenant-Leaning · D+14
- County
- — inherits STATE
- City
- — inherits STATE
ZIP-level market 21532
- Home prices YoY
- -24.2%
- Active inventory
- 102
- Price-to-rent
- 10.1×
Monthly cashflow live
- Estimated rent
- $1,200 medium interval (Pro) →
- Mortgage (P&I)
- −$760
- Tax from tax record
- −$86 /mo · $1,030/yr
- Insurance
- −$60
- HOA
- −$0
- Vacancy / Maint / Mgmt
- −$252
- Net cashflow
- $41
Break-even live
Sensitivity live
| Price | -10% $123 | -5% $82 | +0% $41 | +5% $0 | +10% $-41 |
|---|---|---|---|---|---|
| Rent | -10% $-53 | -5% $-6 | +0% $41 | +5% $89 | +10% $136 |
| Rate | -1.0pp $114 | -0.5pp $78 | base $41 | +0.5pp $4 | +1.0pp $-34 |
UW: 25.0% down · 7.5% · 30yr · 1.5% tax · 5.0% vac · 8.0% maint · 8.0% mgmt
Financing live
Cash to close
- Down payment
- $36,250
- Closing costs
- $4,350
- Reserves months
- —
- Total cash needed
- —
Loan-product check · same deal, 3 products live
Conventional
25% down · 7.5% · 30yr
- Down + closing
- —
- Monthly P&I
- —
- Monthly cashflow
- —
- DSCR
- —
- Eligible?
- —
Personal DTI + credit; lowest rate.
DSCR
20% down · 8.5% · 30yr
- Down + closing
- —
- Monthly P&I
- —
- Monthly cashflow
- —
- DSCR
- —
- Eligible?
- —
No personal income docs; deal must DSCR.
Hard money
10% down · 12.0% · 12mo
- Down + closing
- —
- Monthly P&I
- —
- Monthly cashflow
- —
- DSCR
- —
- Eligible?
- —
Short-term bridge; refi at stabilization.
Rent comps 1 comps
| Address | Beds | Baths | Sqft | Rent | $/sqft | DOM | Units | Dist |
|---|---|---|---|---|---|---|---|---|
| 2 Bob Cat Ct Frostburg, MD | 2.0–4.0 | 1.0–2.0 | 965 | $1,200 | $1.24 | 45d | 6 | 0.54mi |
Listing history 39 events
-
2026-06-22days on market $145,000 Active 82 DOM
-
2026-06-21days on market $145,000 Active 81 DOM
-
2026-06-19days on market $145,000 Active 79 DOM
-
2026-06-18days on market $145,000 Active 78 DOM
-
2026-06-17days on market $145,000 Active 77 DOM
-
2026-06-16days on market $145,000 Active 76 DOM
-
2026-06-15days on market $145,000 Active 75 DOM
-
2026-06-14days on market $145,000 Active 73 DOM
-
2026-06-12days on market $145,000 Active 72 DOM
-
2026-06-09days on market $145,000 Active 69 DOM
-
2026-06-08days on market $145,000 Active 68 DOM
-
2026-06-07days on market $145,000 Active 67 DOM
-
2026-06-02days on market $145,000 Active 62 DOM
-
2026-06-01days on market $145,000 Active 61 DOM
-
2026-05-31days on market $145,000 Active 60 DOM
-
2026-05-30days on market $145,000 Active 59 DOM
-
2026-04-01$150,000 Active 416-char remark
Show marketing remark (432 chars)
Investor alert! This duplex, located centrally in Frostburg has many new updates, great rental history, and a second paved parcel for off street parking. The over/under units have 2 bedrooms each, separate electric meters, new roof in 2021, new outdoor stairs to unit #2 and this unit also has new kitchen cabinets, granite counter and washer dryer. Please allow 48 hour notice when scheduling but don't miss this great opportunity!
-
2026-04-01$150,000 Active 432-char remark
Show marketing remark (432 chars)
Investor alert! This duplex, located centrally in Frostburg has many new updates, great rental history, and a second paved parcel for off street parking. The over/under units have 2 bedrooms each, separate electric meters, new roof in 2021, new outdoor stairs to unit #2 and this unit also has new kitchen cabinets, granite counter and washer dryer. Please allow 48 hour notice when scheduling but don't miss this great opportunity!
-
2026-01-27historical
-
2025-10-24status Active
-
2025-08-18status Pending
-
2025-08-18historical
-
2025-06-19status Active
-
2025-06-11status Pending
-
2025-06-11historical
-
2025-05-01$150,000 Active
-
2025-05-01$150,000 Active
-
2021-01-07soldstatus $67,491
-
2018-11-30soldstatus $85,000
-
2018-11-20soldstatus $85,000 Closed
-
2018-10-15status Pending
-
2018-07-26$90,000 Active
-
2009-11-17historical Withdrawn
-
2009-11-17historical
-
2009-06-25
-
2009-06-25$125,000
-
1997-09-30historical
-
1997-02-13
-
1992-04-08soldstatus $26,500
ⓘ Source: listings_history table (triggers on properties + properties_extension) + one-shot
backfill from property_details.listing_events for pre-trigger history.
Tax reassessment forecast MD · Partial reset (capped growth)
- Current annual tax
- $1,030 · $86/mo
- Projected year-2 tax
- $1,305 · $109/mo
- Expected delta
- +$275/yr (+$23/mo · 26.7%)
ⓘ Screening estimate from a state-policy table — verify with the county assessor before closing.
Climate risk First Street
- Flood 1/10 Low FEMA zone X (unshaded) · 0% chance over 30 yrs
- Wildfire 2/10 Low
- Heat 2/10 Low 7 d/yr ≥91°F today · 17 d/yr by 30 yrs out
- Wind 2/10 Low
- Air quality 2/10 Low 0 unhealthy d/yr today · 1 by 30 yrs out
Nearby sold comps map
Loading sold comps map…
Walkable amenities ~0.75 mi
Loading nearby amenities…
Taxation est. · year 1
- Rental income
- $14,400
- − Mortgage interest
- −$8,122
- − Property taxes
- −$1,030
- − Insurance
- −$725
- − Repairs & maintenance
- −$1,152
- − Management
- −$1,152
- − Depreciation
- −$4,218
- Taxable loss
- −$1,999
- Est. tax savings @ 24.0%
- +$480
- After-tax cash flow
- $976/yr
For passive investors: Depreciation is non-cash, so a rental often shows a tax loss while cash-flowing — sheltering income. Rental losses are passive: they offset passive income freely, and up to $25,000/yr can offset ordinary (W-2) income if you actively participate and your MAGI is under $100k (phasing out to $0 by $150k); unused losses carry forward. On sale, claimed depreciation is recaptured at up to 25%, and gains may owe capital-gains tax (a 1031 exchange can defer both). Figures are a year-1 estimate at your 24.0% rate — not tax advice; consult a CPA.
Schools (NCES district)
- District
- Allegany County Public Schools
- NCES district ID
- 2400030
- Math proficiency
- 15% ▼ -26.00%
- Reading proficiency
- 30% ▼ -20.00%
- Median HH income
- $39,760
- Composite
- 18.95/100
- National rank
- #8854
- State rank
- #18 of 24 in MD
Livability — Frostburg
- Score
- 87/100
- State rank
- #7
- US rank
- #287
Category grades
Schools grade is shown separately in the Schools card above.
Census & demographics
- Census place
- Frostburg, MD
- Population (ZIP)
- 13,123
Population outlook (Allegany County) Hauer SSP2
- Today (2025)
- 68,778 people
- By 2030
- 66,766 · -2.9%
- By 2040
- 62,784 · -8.7%
- By 2050
- 59,179 · -14.0%
- By 2075
- 50,732 · -26.2%
- By 2100
- 40,837 · -40.6%
Race, ethnicity, and origin ACS 2023
- Neighborhood character
- Predominantly White (89%)
- Race & ethnicity
- White 89% Black 6% Two or more races 2% Hispanic / Latino 2% Asian 2%
- Common ancestry
- Slovak 5% Romanian 2% Italian 1%
- Foreign-born
- 3% · Canada, China
- Languages at home
- 96% English-only · Spanish 2% Chinese 1%
Political lean MEDSL · Allegany
- 2024 margin
- Solid R (+40.3) · D 28.9% · R 69.2% · Other 2.0%
- 2008→2024 swing
- -14.4pp toward R · 2008: -25.9pp · 2024: -40.3pp
- All cycles
- 2024: R+40.3 2020: R+38.3 2016: R+48.0 2012: R+32.9 2008: R+25.9
Not yet ingested
- Civics
- —
Market trends
- HPI YoY
- ▼ -78.31%
- Current HPI
- 244.5937
- Rent YoY
- —
- Metro
- —
- State GDP YoY
- ▲ 2.97%
- F500 in state
- 12
Industry mix (Fortune 500 HQ in MD)
| Industry | F500 HQs | Revenue |
|---|---|---|
| Aerospace / Defense | 1 | $71B |
|
||
| Utilities | 1 | $25B |
|
||
| Hotels | 1 | $24B |
|
||
| Consumer Goods | 1 | $7B |
|
||
| Real Estate | 1 | $6B |
|
||
| Chemicals | 1 | $2B |
|
||
Price history
+466.0% since first listed23 events — show timeline
- 2026-04-01 Listed $150,000 BRIGHT MLS
- 2026-04-01 Listed $150,000 BRIGHT MLS
- 2026-01-27 Listing Removed — BRIGHT MLS
- 2025-10-24 Relisted — BRIGHT MLS
- 2025-08-18 Pending — BRIGHT MLS
- 2025-08-18 Listing Removed — BRIGHT MLS
- 2025-06-19 Relisted — BRIGHT MLS
- 2025-06-11 Pending — BRIGHT MLS
- 2025-06-11 Listing Removed — BRIGHT MLS
- 2025-05-01 Listed $150,000 BRIGHT MLS
- 2025-05-01 Listed $150,000 BRIGHT MLS
- 2021-01-07 Sold (Public Records) $67,491 Public Records
- 2018-11-30 Sold (Public Records) $85,000 Public Records
- 2018-11-20 Sold (MLS) $85,000 BRIGHT MLS
- 2018-10-15 Pending — BRIGHT MLS
- 2018-07-26 Listed $90,000 BRIGHT MLS
- 2009-11-17 Delisted — MRIS
- 2009-11-17 Listing Removed — BRIGHT MLS
- 2009-06-25 Listed — MRIS
- 2009-06-25 Listed $125,000 BRIGHT MLS
- 1997-09-30 Delisted — MRIS
- 1997-02-13 Listed — MRIS
- 1992-04-08 Sold (Public Records) $26,500 Public Records
Property tax history
+0.8%/yrLatest (2025): $1,030 · +5.5% YoY. Source: county tax records.
Cash-flow waterfall
monthlySold comps — $/sqft
last 12 mo · ≤1 miLoading sold comps…