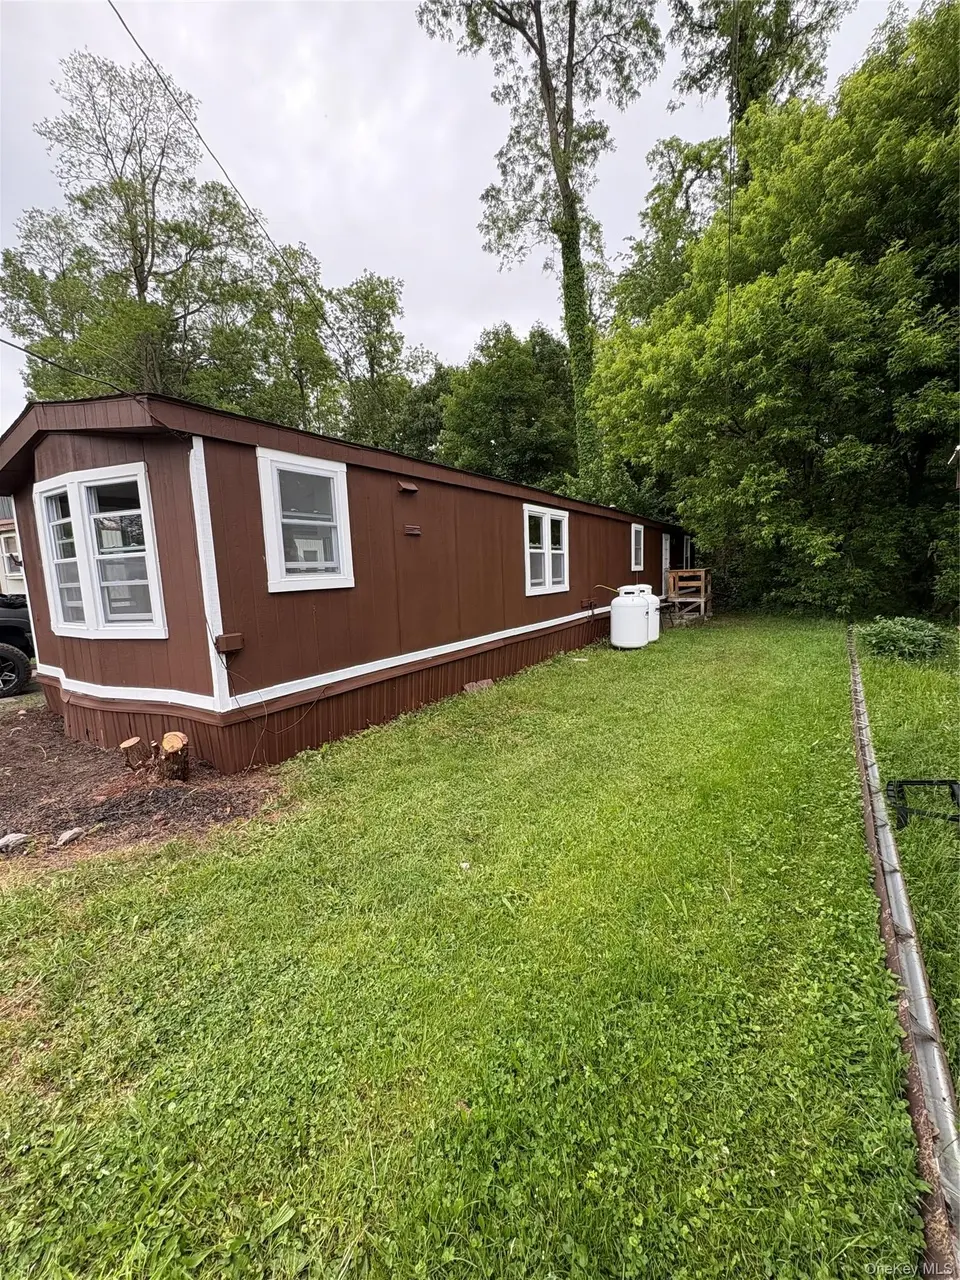
112 Jefferson Hts #13 · Jefferson Heights, NY
Flood risk 1/10 · Minimal
- FEMA flood zone
- X (unshaded)
- Chance of flooding over 30 yrs
- 0.0%
- Est. flood insurance / yr
- $507 – $1,088
Fire risk 2/10 · Minimal
- Est. fire insurance / yr
- $691 – $1,283
Heat risk 4/10 · Minor
- Hot days now (above 99°F)
- 7 days/yr
- Hot days in 30 yrs
- 16 days/yr
Wind risk 3/10 · Minor
- Chance of severe wind over 30 yrs
- 7.0%
Air-quality risk 2/10 · Minimal
- Unhealthy air days now
- 0 days/yr
- Unhealthy air days in 30 yrs
- 1 days/yr
Risk factors via First Street. Map © Google.
Why this score? — see what drove the C grade
The composite is a weighted blend of 9 inputs, each scored 0–100. Each bar is that input's sub-score; the figure is the points it added to the 100-point composite (weight × sub-score).
- Cash flow +12.8/30.0
- 1% rule +10.0/10.0
- Appreciation +10.0/10.0
- ARV discount +7.5/15.0
- Schools +4.1/10.0
- Condition / age +4.0/5.0
- DSCR +3.8/10.0
- Livability +3.1/5.0
- Rent growth +2.5/5.0
$89,000
🖨 Deal sheet 📄 Offer letter ✓ Due diligence
Listing remarks
Affordable homeownership awaits! This charming 2-bedroom, 1-bath mobile home is located in a well-maintained, pet-friendly community with new management and ongoing improvements throughout the park. Featuring comfortable single-level living, this home is perfect for first-time buyers, downsizers, or investors, as rentals are permitted. Conveniently located near shopping, dining, medical facilities, and major commuter routes. A rare opportunity to own or invest in a growing community at an affordable price. Schedule your showing today!
Key facts
- Built 1994
- Listed 20 days
Property features AI
Finance
- Other: Located in Greene County
- HOA & community: Association with monthly fee of $700; Association fee covers common area maintenance, grounds care, sewer, snow removal, trash and water
Exterior
- Parking: Assigned parking; Off-street parking; No carport
- Utilities: Shared septic; Cable connected; Electricity connected; Sewer connected; Water connected
- Home design: Manufactured home (mobile home)
- Construction: Wood siding construction; Fiberglass insulation; Foam insulation
- Exterior features: Wood siding; Fiberglass and foam insulation; Not waterfront; No additional parcels
Interior
- Kitchen: Cooktop; Gas range; Oven; Refrigerator; Exhaust fan; Stainless steel appliances; ENERGY STAR qualified appliances; Electric water heater
- Bedrooms: Total rooms: 5
- Bathrooms: 1 full bathroom
- Heating & cooling: Natural gas heating; Wall/window air conditioning
- Interior features: First-floor bedroom; First-floor full bathroom; Home office
- Laundry & utility: No basement
Neighborhood map
What this means for you Summary
Snapshot
- This is a 2-bed/1.0-bath manufactured listed at $89k. Condition is rated good.
Deal economics
- At list price, monthly cash flow is $-8 ($-97/yr) — negative.
- To cash-flow at today's rent, offer at most $88k (1.3% below list).
- Meets the 1% rule at list price ($2k rent vs $89k).
- Recommended offer: $88k (1.5% below list) — sets the bar for market timing.
Location & tenants
- Location reads 62/100 on livability (#860 in NY) — a middle-class / working-renter tenant base. Strengths: crime A, health & safety A, cost of living B; Watch: employment C-, schools F, amenities F.
- Catskill Central School District (town): math 45% / reading 51% proficiency, ranked #429 of 590 in NY (top 73%) — families likely to look elsewhere, expect single-tenant / working-renter base with shorter leases.
- Market conditions: 104 active listings in the ZIP; 3 comparable units currently listed for rent nearby; rentals lingering (median 44d on market — plan ~5-8 weeks vacancy on turnover, expect pricing pressure); 67% of comp listings sitting > 30 days — soft ceiling on asking rent; 97 units permitted in Greene County in 2024 (0 in 5+ unit buildings).
Forward outlook
- In year one you build about $10k of equity ($615 loan paydown + $9k appreciation (10.0% local appreciation)).
- Greene County population projected at -22% by 2050 — secular population decline; favor cash flow + early exit over multi-decade hold.
- At projected returns (10.0% appreciation + 3.0% rent growth), your $25k cash investment doubles in ~3 years — after that, you're playing with house money.
- By year 4, paydown + projected appreciation supports a ~$34k cash-out refi (75% LTV) — recoverable capital for the next deal without selling this one.
Negotiation context
- It's been on market 21 days — a 2% lower offer ($88k) is reasonable based on typical stale-listing flexibility.
Risks & watch-outs
- Watch-outs: HOA is 42% of rent.
Questions for the listing agent
- What do current leases actually rent for vs. the listed asking? Can we see a recent rent roll and the last 12 months of T-12 income?
- What does the HOA fee cover, when was the last increase, and are there any pending special assessments or reserve-fund shortfalls?
- Is there a deadline driving the sale (1031 exchange, divorce, estate, relocation)? That informs how much negotiation room exists.
- Schools are F-rated, which usually means shorter tenancies and higher turnover. Who's the typical renter profile here, and what's been the actual vacancy rate?
- What's the average days-on-market for RENTAL listings here right now (not sales)? A rising rental-DOM trend means longer vacancies and softer asking-rent achievability than the comps imply.
- What's the recent tenant-quality profile in this submarket — average credit score on applications, eviction rate, late-payment / NSF rate, and stable-employment percentage? A property-management company in the area should have these aggregated.
- How much new for-sale + rental construction is in the pipeline within 1–3 miles? Heavy new supply typically softens prices + rents 12–24 months out; constrained supply supports both.
Investment metrics
- 1% rule
- 1.86% ✓
- Cap rate
- 6.18%
- Cash-on-cash
- -0.39%
- DSCR
- 0.98
- GRM
- 4.5
CMA / ARV
No comps found within radius.
Projected returns pro-forma
10.0% appreciation · 3.0% rent growth · sell at horizon
- IRR
- 24.2%
- Equity multiple
- 2.94×
- Total profit
- $48,414
- Equity at exit
- $80,178
- IRR
- 21.6%
- Equity multiple
- 6.77×
- Total profit
- $143,879
- Equity at exit
- $172,907
Cash invested: $24,920 (down + closing). Projections, not guarantees.
Landlord ↔ Tenant lean methodology
- Overall (STATE)
- 15 Strongly Tenant-Friendly
- State New York
- 15 Strongly Tenant-Friendly · D+10
- County
- — inherits STATE
- City
- — inherits STATE
ZIP-level market 12414
- Home prices YoY
- 11.9%
- Active inventory
- 104
- Price-to-rent
- 4.5×
Monthly cashflow live
- Estimated rent
- $1,654 medium interval (Pro) →
- Mortgage (P&I)
- −$467
- Tax est. 1.5%
- −$111 /mo · $1,335/yr
- Insurance
- −$37
- HOA
- −$700
- Vacancy / Maint / Mgmt
- −$347
- Net cashflow
- $-8
Break-even live
UW: 25.0% down · 7.5% · 30yr · 1.5% tax · 5.0% vac · 8.0% maint · 8.0% mgmt
Financing live
Cash to close
- Down payment
- $22,250
- Closing costs
- $2,670
- Reserves months
- —
- Total cash needed
- —
Loan-product check · same deal, 3 products live
Conventional
25% down · 7.5% · 30yr
- Down + closing
- —
- Monthly P&I
- —
- Monthly cashflow
- —
- DSCR
- —
- Eligible?
- —
Personal DTI + credit; lowest rate.
DSCR
20% down · 8.5% · 30yr
- Down + closing
- —
- Monthly P&I
- —
- Monthly cashflow
- —
- DSCR
- —
- Eligible?
- —
No personal income docs; deal must DSCR.
Hard money
10% down · 12.0% · 12mo
- Down + closing
- —
- Monthly P&I
- —
- Monthly cashflow
- —
- DSCR
- —
- Eligible?
- —
Short-term bridge; refi at stabilization.
Rent comps 3 comps
| Address | Beds | Baths | Sqft | Rent | $/sqft | DOM | Units | Dist |
|---|---|---|---|---|---|---|---|---|
| 139 Jefferson Hts Unit 2 Catskill, NY | 1.0 | 1.0 | 700 | $1,300 | $1.86 | 23d | 1 | 0.26mi |
| 473 Main St Unit 1 Catskill, NY | 2.0 | 1.0 | 550 | $1,650 | $3.00 | 43d | 1 | 0.55mi |
| 114 Main St Catskill, NY | 3.0 | 1.0 | 1000 | $2,400 | $2.40 | 43d | 1 | 1.37mi |
HOA detail
- Monthly dues
- $700 · $8,400/yr
Listing history 14 events
-
2026-06-19days on market $89,000 Active 21 DOM
-
2026-06-18days on market $89,000 Active 20 DOM
-
2026-06-17days on market $89,000 Active 19 DOM
-
2026-06-16days on market $89,000 Active 18 DOM
-
2026-06-15days on market $89,000 Active 17 DOM
-
2026-06-14days on market $89,000 Active 15 DOM
-
2026-06-12days on market $89,000 Active 14 DOM
-
2026-06-09days on market $89,000 Active 11 DOM
-
2026-06-08days on market $89,000 Active 10 DOM
-
2026-06-07days on market $89,000 Active 9 DOM
-
2026-06-02days on market $89,000 Active 4 DOM
-
2026-06-01days on market $89,000 Active 3 DOM
-
2026-05-31days on market $89,000 Active 2 DOM
-
2026-05-29$89,000 Active
ⓘ Source: listings_history table (triggers on properties + properties_extension) + one-shot
backfill from property_details.listing_events for pre-trigger history.
Climate risk First Street
- Flood 1/10 Low FEMA zone X (unshaded) · 0% chance over 30 yrs
- Wildfire 2/10 Low
- Heat 4/10 Moderate 7 d/yr ≥99°F today · 16 d/yr by 30 yrs out
- Wind 3/10 Moderate 7% chance of damaging wind over 30 yrs
- Air quality 2/10 Low 0 unhealthy d/yr today · 1 by 30 yrs out
Nearby sold comps map
Loading sold comps map…
Walkable amenities ~0.75 mi
Loading nearby amenities…
Taxation est. · year 1
- Rental income
- $19,853
- − Mortgage interest
- −$4,985
- − Property taxes
- −$1,335
- − Insurance
- −$445
- − Repairs & maintenance
- −$1,588
- − Management
- −$1,588
- − HOA
- −$8,400
- − Depreciation
- −$2,589
- Taxable loss
- −$1,078
- Est. tax savings @ 24.0%
- +$259
- After-tax cash flow
- $162/yr
For passive investors: Depreciation is non-cash, so a rental often shows a tax loss while cash-flowing — sheltering income. Rental losses are passive: they offset passive income freely, and up to $25,000/yr can offset ordinary (W-2) income if you actively participate and your MAGI is under $100k (phasing out to $0 by $150k); unused losses carry forward. On sale, claimed depreciation is recaptured at up to 25%, and gains may owe capital-gains tax (a 1031 exchange can defer both). Figures are a year-1 estimate at your 24.0% rate — not tax advice; consult a CPA.
Condition & rehab AI · 4 photos
This charming 2-bedroom mobile home is in good condition with a fresh paint job and well-maintained exterior. It offers a great opportunity for first-time buyers, downsizers, or investors looking for an affordable and move-in-ready property.
Value-add opportunities
- Both Painting exterior and interior walls — Fresh paint enhances curb appeal and interior aesthetics.
- Both Landscaping improvements — Enhances curb appeal and adds value for both resale and rental.
- Resale Upgrading appliances — Modern appliances improve the home's appeal and functionality.
- Rental Adding a small deck or patio — Increases living space and appeal for renters.
Renovation cost estimate screening
Value-add ROI direction
- Both Painting exterior and interior walls — Fresh paint enhances curb appeal and interior aesthetics. ↑
- Both Landscaping improvements — Enhances curb appeal and adds value for both resale and rental. ↑
- Resale Upgrading appliances — Modern appliances improve the home's appeal and functionality. ↑
- Rental Adding a small deck or patio — Increases living space and appeal for renters. ↑
ⓘ Cost ranges are severity-bucket heuristics (US national rule-of-thumb). Get contractor quotes + a written scope before underwriting a rehab budget.
Schools (NCES district)
- District
- Catskill Central School District
- NCES district ID
- 3606720
- Math proficiency
- 45% ▼ -9.00%
- Reading proficiency
- 51% ▲ 8.00%
- Median HH income
- $44,960
- Composite
- 40.63/100
- National rank
- #3685
- State rank
- #429 of 590 in NY
Livability — Jefferson Heights
- Score
- 62/100
- State rank
- #860
- US rank
- #16594
Category grades
Schools grade is shown separately in the Schools card above.
Census & demographics
- Census place
- Jefferson Heights, NY
- County
- Greene County · 10,169 people
- Metro
- nan
- Population (ZIP)
- 10,169
- Household income
- $73,036
- Rent vs Own
- Severe rent burden
- 318.0
Population outlook (Greene County) Hauer SSP2
- Today (2025)
- 44,963 people
- By 2030
- 43,126 · -4.1%
- By 2040
- 38,756 · -13.8%
- By 2050
- 34,913 · -22.4%
- By 2075
- 28,156 · -37.4%
- By 2100
- 22,296 · -50.4%
Race, ethnicity, and origin ACS 2023
- Neighborhood character
- Predominantly White (77%)
- Race & ethnicity
- White 77% Hispanic / Latino 10% Two or more races 8% Black 6%
- Hispanic origin (detail)
- Puerto Rican 7%
- Common ancestry
- Scotch-Irish 3% Iranian 3% Lithuanian 3%
- Foreign-born
- 4% · Canada, Mexico
- Languages at home
- 91% English-only · Spanish 5% Other Indo-European 2% Russian/Polish/Slavic 1%
Political lean MEDSL · Greene
- 2024 margin
- R (+17.0) · D 41.5% · R 58.5%
- 2008→2024 swing
- -7.1pp toward R · 2008: -9.9pp · 2024: -17.0pp
- All cycles
- 2024: R+17.0 2020: R+15.6 2016: R+27.4 2012: R+11.1 2008: R+9.9
Not yet ingested
- Civics
- —
Market trends
- HPI YoY
- ▲ 52.47%
- Current HPI
- 494.3394
- Rent YoY
- —
- Metro
- nan
- State GDP YoY
- ▲ 2.60%
- F500 in state
- 92
Industry mix (Fortune 500 HQ in NY)
| Industry | F500 HQs | Revenue |
|---|---|---|
| Financial Services | 10 | $950B |
|
||
| Consumer Goods | 9 | $162B |
|
||
| Insurance | 4 | $225B |
|
||
| Telecommunications | 2 | $144B |
|
||
| Pharmaceuticals | 2 | $112B |
|
||
| Media / Entertainment | 2 | $69B |
|
||
Price history
1 event — show timeline
- 2026-05-29 Listed $89,000 OneKey® MLS as Distributed by MLS Grid
Cash-flow waterfall
monthlySold comps — $/sqft
last 12 mo · ≤1 miLoading sold comps…