 🏷️ Likely Rental
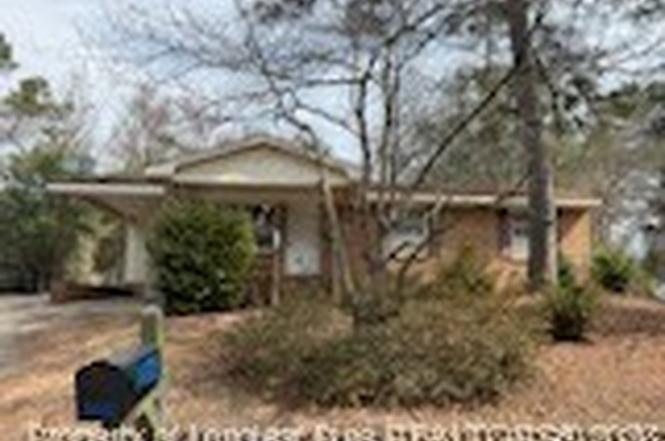
1469 Thelbert Dr · Fayetteville, NC
Flood risk 1/10 · Minimal
- FEMA flood zone
- X (unshaded)
- Chance of flooding over 30 yrs
- 0.0%
- Est. flood insurance / yr
- $507 – $1,088
Fire risk 2/10 · Minimal
- Est. fire insurance / yr
- $906 – $1,684
Heat risk 7/10 · Major
- Hot days now (above 106°F)
- 7 days/yr
- Hot days in 30 yrs
- 16 days/yr
Wind risk 7/10 · Major
- Chance of severe wind over 30 yrs
- 75.0%
Air-quality risk 2/10 · Minimal
- Unhealthy air days now
- 0 days/yr
- Unhealthy air days in 30 yrs
- 1 days/yr
Risk factors via First Street. Map © Google.
Why this score? — see what drove the C grade
The composite is a weighted blend of 9 inputs, each scored 0–100. Each bar is that input's sub-score; the figure is the points it added to the 100-point composite (weight × sub-score).
- Cash flow +19.1/30.0
- ARV discount +15.0/15.0
- DSCR +6.0/10.0
- 1% rule +4.9/10.0
- Livability +3.8/5.0
- Rent growth +3.4/5.0
- Schools +3.1/10.0
- Condition / age +2.5/5.0
- Appreciation +0.0/10.0
$167,000
🖨 Deal sheet 📄 Offer letter ✓ Due diligence
Listing remarks
Spacious brick ranch home offering 3 bedrooms, 2 bathrooms. Enjoy two large living areas — one anchored by a cozy fireplace and built-in bookshelves. Hardwood, tile and carpet flooring create character and warmth, while ceiling fans and central air ensure year-round comfort. Slide into the carport for easy parking. Convenient to schools, shopping, and Fort Bragg. Home is tenant occupied.
Key facts
- Ceiling fans
- Brick ranch home
- Cozy fireplace
Tags
Property features AI
Exterior
- Parking: Attached carport; 1 covered parking space; 1-car carport
- Utilities: Public water; Public sewer
- Home design: Single-family residence; One story
- Construction: Brick veneer construction
- Exterior features: Located in the SEABROOK HL subdivision; Zoned SF6 (Single Family Res 6)
Interior
- Flooring: Vinyl
- Bathrooms: 2 full bathrooms
- Heating & cooling: Electric heating
- Interior features: Vinyl flooring; Den fireplace (1 total); Crawl space basement
Neighborhood map
What this means for you Summary
Snapshot
- This is a 3-bed/2.0-bath single-family listed at $167k.
Deal economics
- At list price, monthly cash flow is $178 ($2k/yr) — positive.
- The deal already cash-flows at list — no discount required.
- To meet the 1% rule (rent ≥ 1% of price), the offer needs to be $165k (0.9% below list).
- Recommended offer: $147k (12.0% below list) — sets the bar for market timing.
- Cap rate 7.6% vs local median 4.9% in Fayetteville — top-decile yield for the area; either an underpriced asset or a hidden risk that comps aren't pricing in. Stress-test before assuming the spread holds.
Location & tenants
- Location reads 75/100 on livability (#45 in NC, #4,031 nationally) — a middle-class / working-renter tenant base. Strengths: commute A+, cost of living A+, housing A+; Watch: schools C-, crime F, employment D-.
- Cumberland County Schools (urban): math 32% / reading 41% proficiency, ranked #126 of 178 in NC (top 71%) — families likely to look elsewhere, expect single-tenant / working-renter base with shorter leases.
- Market conditions: Rents rising (+3.5%/yr); 132 active listings in the ZIP; 30 comparable units currently listed for rent nearby; rentals at typical pace (median 21d on market — plan ~3-4 weeks tenant-placement turnaround); lower-income renter base — watch delinquency; 1,125 units permitted in Cumberland County in 2024 (104 in 5+ unit buildings).
- At $1,655/mo this rent would consume 51% of the median local household income ($39k/yr) (locally 1389% of renters already pay >50% of income on rent) — very limited rent-growth headroom before tenants either downsize or default.
Forward outlook
- Local home prices are declining (-3.0%/yr); year-one equity from $1k of loan paydown is wiped out by about $5k of value loss. Plan a longer hold.
Negotiation context
- It's been on market 150 days — a 12% lower offer ($147k) is reasonable based on typical stale-listing flexibility.
- 6 sale attempts since 9y ago with the ask held roughly flat each time — persistent listings suggest the price (not the market) is what's stuck; bring a comps-based counter.
- Current owner paid $92k; list at $167k implies a 81% gain — meaningful room to come down on a strong offer.
Risks & watch-outs
- Climate carrying-cost: major wind risk, 75% chance of damaging wind over 30y; extreme-heat days projected 7→16/yr by 2055 (HVAC capex compounding) — expect insurance premiums to compound above CPI over the hold.
Questions for the listing agent
- It's been on market 150 days. Have you received any prior offers? Is the seller open to a 12% concession, seller financing, or rate buy-down credit?
- Built in 1963 — when were the roof, HVAC, electrical panel, plumbing, and water heater last replaced?
- Why hasn't it sold? Are there any deal-killer items the seller is aware of (foundation, flood, title, zoning, code violations)?
- Is there a deadline driving the sale (1031 exchange, divorce, estate, relocation)? That informs how much negotiation room exists.
- Crime grade is F in this area — have there been break-ins, vandalism, or insurance claims at this property in the last 3 years? What carrier currently insures it and at what premium?
- What's the average days-on-market for RENTAL listings here right now (not sales)? A rising rental-DOM trend means longer vacancies and softer asking-rent achievability than the comps imply.
- What's the recent tenant-quality profile in this submarket — average credit score on applications, eviction rate, late-payment / NSF rate, and stable-employment percentage? A property-management company in the area should have these aggregated.
- How much new for-sale + rental construction is in the pipeline within 1–3 miles? Heavy new supply typically softens prices + rents 12–24 months out; constrained supply supports both.
Investment metrics
- 1% rule
- 0.99% ✗
- Cap rate
- 7.57%
- Cash-on-cash
- 4.57%
- DSCR
- 1.20
- GRM
- 8.4
CMA / ARV
- ARV (on-the-fly)
- $218,519
- Comps found
- 12
Show comp detail 12 sales within ~0.75 mi
| Address | Dist | Beds/Ba | Sqft | Sold | Price | $/sf | Match |
|---|---|---|---|---|---|---|---|
| 1901 Bain Dr | 0.31mi | 4/2.0 (+1) | 1,644 (+0%) | 2mo | $189,000 | $115 | 78 |
| 901 Edenwood Dr | 0.25mi | 4/2.5 (+1) | 1,612 (-2%) | 2mo | $249,900 | $155 | 76 |
| 807 Cape Fear Ave | 0.48mi | 3/2.0 | 1,670 (+2%) | 0mo | $190,000 | $114 | 74 |
| 830 Edenwood Dr | 0.23mi | 3/2.5 | 1,740 (+6%) | 8mo | $205,000 | $118 | 71 |
| 1900 Torrey Dr | 0.10mi | 4/2.0 (+1) | 1,527 (-7%) | 10mo | $203,000 | $133 | 70 |
| 833 Anarine St | 0.44mi | 2/2.0 (-1) | 1,680 (+2%) | 4mo | $155,000 | $92 | 67 |
| 1612 Rogers Dr | 0.43mi | 3/2.0 | 1,541 (-6%) | 8mo | $252,000 | $164 | 62 |
| 1813 Spruce St | 0.58mi | 4/3.0 (+1) | 1,638 (-0%) | 4mo | $262,000 | $160 | 60 |
| 1717 Mcgougan Rd | 0.51mi | 4/2.0 (+1) | 1,739 (+6%) | 9mo | $224,900 | $129 | 54 |
| 1061 Mohawk Ave | 0.74mi | 3/3.0 | 1,547 (-6%) | 1mo | $223,000 | $144 | 51 |
| 1810 Catawba St | 0.65mi | 4/2.5 (+1) | 1,772 (+8%) | 1mo | $140,000 | $79 | 49 |
| 936 Mckimmon Rd | 0.57mi | 3/2.0 | 1,396 (-15%) | 4mo | $252,000 | $181 | 45 |
Match score weights: distance 35% · size 25% · config 20% · recency 20%. Top-matched comps best support the ARV.
Projected returns pro-forma
-3.0% appreciation · 3.49% rent growth · sell at horizon
- IRR
- -8.6%
- Equity multiple
- 0.68×
- Total profit
- $-14,890
- Equity at exit
- $24,900
- IRR
- 1.5%
- Equity multiple
- 1.11×
- Total profit
- $5,076
- Equity at exit
- $14,439
Cash invested: $46,760 (down + closing). Projections, not guarantees.
Landlord ↔ Tenant lean methodology
- Overall (STATE)
- 85 Strongly Landlord-Friendly
- State North Carolina
- 85 Strongly Landlord-Friendly · R+3
- County
- — inherits STATE
- City
- — inherits STATE
ZIP-level market 28301
- Home prices YoY
- -12.5%
- Rents YoY
- 3.5%
- Active inventory
- 132
- Price-to-rent
- 8.4×
Monthly cashflow live
- Estimated rent
- $1,655 high interval (Pro) →
- Mortgage (P&I)
- −$876
- Tax from tax record
- −$184 /mo · $2,208/yr
- Insurance
- −$70
- HOA
- −$0
- Vacancy / Maint / Mgmt
- −$348
- Net cashflow
- $178
Break-even live
UW: 25.0% down · 7.5% · 30yr · 1.5% tax · 5.0% vac · 8.0% maint · 8.0% mgmt
Financing live
Cash to close
- Down payment
- $41,750
- Closing costs
- $5,010
- Reserves months
- —
- Total cash needed
- —
Loan-product check · same deal, 3 products live
Conventional
25% down · 7.5% · 30yr
- Down + closing
- —
- Monthly P&I
- —
- Monthly cashflow
- —
- DSCR
- —
- Eligible?
- —
Personal DTI + credit; lowest rate.
DSCR
20% down · 8.5% · 30yr
- Down + closing
- —
- Monthly P&I
- —
- Monthly cashflow
- —
- DSCR
- —
- Eligible?
- —
No personal income docs; deal must DSCR.
Hard money
10% down · 12.0% · 12mo
- Down + closing
- —
- Monthly P&I
- —
- Monthly cashflow
- —
- DSCR
- —
- Eligible?
- —
Short-term bridge; refi at stabilization.
Rent comps 30 comps
| Address | Beds | Baths | Sqft | Rent | $/sqft | DOM | Units | Dist |
|---|---|---|---|---|---|---|---|---|
| 1628 Murchison Rd Fayetteville, NC | 3.0 | 1.0 | 1700 | $1,295 | $0.76 | 23d | 1 | 0.43mi |
| 809 Cape Fear Ave Fayetteville, NC | 2.0 | 1.0 | 1225 | $1,450 | $1.18 | 21d | 1 | 0.50mi |
| 808 Ethelored St Fayetteville, NC | 2.0 | 2.0 | 1701 | $1,395 | $0.82 | 23d | 1 | 0.52mi |
| 1704 Newark Ave Fayetteville, NC | 2.0 | 1.0 | 1100 | $850 | $0.77 | 23d | 1 | 0.55mi |
| 1000 Ivy Rd Fayetteville, NC | 3.0 | 1.0 | 1200 | $1,400 | $1.17 | 23d | 1 | 0.59mi |
| 1817 McGougan Rd Fayetteville, NC | 3.0 | 2.0 | 1811 | $2,100 | $1.16 | 14d | 1 | 0.62mi |
| 1820 McGougan Rd Fayetteville, NC | 3.0 | 2.5 | 1967 | $1,850 | $0.94 | 23d | 1 | 0.64mi |
| 536 Pearl St Fayetteville, NC | 2.0 | 1.0 | 1101 | $1,349 | $1.23 | 14d | 1 | 0.67mi |
| 530 Pearl St Unit 1367379P Fayetteville, NC | 3.0 | 2.0 | 1194 | $3,577 | $3.00 | 14d | 1 | 0.70mi |
| 600 Glenville Ave Fayetteville, NC | 2.0 | 1.5 | 1105 | $1,295 | $1.17 | 14d | 1 | 0.74mi |
| 2328 Barrington Cir Fayetteville, NC | 2.0 | 1.0 | 1050 | $1,000 | $0.95 | 21d | 1 | 0.80mi |
| 2326 Barrington Cir Fayetteville, NC | 2.0 | 1.0 | 1050 | $1,200 | $1.14 | 14d | 1 | 0.81mi |
| 2326 Barrington Cir Fayetteville, NC | 2.0 | 1.0 | 1050 | $1,200 | $1.14 | 23d | 1 | 0.81mi |
| 424 Pearl St Unit 1367380P Fayetteville, NC | 4.0 | 3.0 | 2077 | $4,419 | $2.13 | 14d | 1 | 0.85mi |
| 1228 Woodland Dr Unit 1 Fayetteville, NC | 2.0 | 2.0 | 1465 | $1,595 | $1.09 | 14d | 1 | 0.88mi |
| 1014 Enclave Dr Fayetteville, NC | 1.0–3.0 | 1.0–2.0 | 1112 | $1,685 | $1.52 | 14d | 19 | 0.97mi |
| 1713 Fort Bragg Rd Unit 1367383P Fayetteville, NC | 4.0 | 2.0 | 1894 | $3,565 | $1.88 | 14d | 1 | 1.01mi |
| 104 Brett Ct Fayetteville, NC | 2.0 | 2.5 | 1210 | $1,400 | $1.16 | 21d | 1 | 1.05mi |
| 501 Lambert St Fayetteville, NC | 2.0 | 2.0 | 1200 | $1,230 | $1.02 | 14d | 3 | 1.05mi |
| 1547 Londonderry Pl Fayetteville, NC | 3.0 | 2.5 | 1636 | $1,750 | $1.07 | 23d | 1 | 1.17mi |
| 1216 Superior Pointe Pl Fayetteville, NC | 3.0 | 2.5 | 1288 | $1,450 | $1.13 | 23d | 1 | 1.19mi |
| 2532 Sourwood Dr Fayetteville, NC | 4.0 | 2.0 | 1562 | $1,700 | $1.09 | 23d | 1 | 1.23mi |
| 1507 Westlawn Ave Fayetteville, NC | 2.0 | 2.0 | 1386 | $1,500 | $1.08 | 23d | 1 | 1.25mi |
| 2012 Fig Ct Fayetteville, NC | 3.0 | 2.5 | 1676 | $1,945 | $1.16 | 23d | 1 | 1.29mi |
| 2209 Morganton Rd Fayetteville, NC | 2.0 | 2.0 | 1163 | $1,317 | $1.13 | 14d | 7 | 1.30mi |
| 318 Fairwood Ct Fayetteville, NC | 3.0 | 2.0 | 1126 | $1,550 | $1.38 | 23d | 1 | 1.34mi |
| 112 Quincy St Fayetteville, NC | 3.0 | 1.0 | 1080 | $1,320 | $1.22 | 14d | 1 | 1.36mi |
| 3318 Rogers Dr Fayetteville, NC | 3.0 | 2.0 | 1392 | $1,750 | $1.26 | 14d | 1 | 1.38mi |
| 1100 Clarendon St #402 Fayetteville, NC | 2.0 | 2.0 | 1073 | $1,400 | $1.30 | 21d | 1 | 1.40mi |
| 211 Ellington St Fayetteville, NC | 2.0 | 1.5 | 1050 | $1,395 | $1.33 | 23d | 1 | 1.45mi |
Listing history 29 events
-
2026-06-18days on market $167,000 Active 150 DOM
-
2026-06-17days on market $167,000 Active 149 DOM
-
2026-06-16days on market $167,000 Active 148 DOM
-
2026-06-15days on market $167,000 Active 147 DOM
-
2026-06-14days on market $167,000 Active 145 DOM
-
2026-06-13days on market $167,000 Active 144 DOM
-
2026-06-10days on market $167,000 Active 142 DOM
-
2026-06-09days on market $167,000 Active 141 DOM
-
2026-06-08days on market $167,000 Active 140 DOM
-
2026-06-07days on market $167,000 Active 139 DOM
-
2026-06-03days on market $167,000 Active 135 DOM
-
2026-06-02days on market $167,000 Active 134 DOM
-
2026-06-01days on market $167,000 Active 133 DOM
-
2026-05-31days on market $167,000 Active 132 DOM
-
2026-05-30days on market $167,000 Active 131 DOM
-
2026-05-13price $167,000
-
2026-02-05price $170,000
-
2026-01-19$175,000 Active
-
2025-11-04$175,000 Active
-
2025-09-24$175,000 Active
-
2025-05-16historical $1,475
-
2025-04-15price $1,475
-
2025-03-22$1,499
-
2025-03-21historical $1,499
-
2025-03-03$1,499
-
2021-09-16soldstatus $92,500
-
2017-06-29soldstatus $32,000
-
2017-05-08$45,000
-
1996-08-08soldstatus $69,000
ⓘ Source: listings_history table (triggers on properties + properties_extension) + one-shot
backfill from property_details.listing_events for pre-trigger history.
Tax reassessment forecast NC · Resets to sale price
- Current annual tax
- $2,208 · $184/mo
- Projected year-2 tax
- $2,208 · $184/mo
- Expected delta
- $0/yr ($0/mo · 0.0%)
ⓘ Screening estimate from a state-policy table — verify with the county assessor before closing.
Climate risk First Street
- Flood 1/10 Low FEMA zone X (unshaded) · 0% chance over 30 yrs
- Wildfire 2/10 Low
- Heat 7/10 Severe 7 d/yr ≥106°F today · 16 d/yr by 30 yrs out
- Wind 7/10 Severe 75% chance of damaging wind over 30 yrs
- Air quality 2/10 Low 0 unhealthy d/yr today · 1 by 30 yrs out
Nearby sold comps map
Loading sold comps map…
Walkable amenities ~0.75 mi
Loading nearby amenities…
Taxation est. · year 1
- Rental income
- $19,859
- − Mortgage interest
- −$9,355
- − Property taxes
- −$2,208
- − Insurance
- −$835
- − Repairs & maintenance
- −$1,589
- − Management
- −$1,589
- − Depreciation
- −$4,858
- Taxable loss
- −$574
- Est. tax savings @ 24.0%
- +$138
- After-tax cash flow
- $2,275/yr
For passive investors: Depreciation is non-cash, so a rental often shows a tax loss while cash-flowing — sheltering income. Rental losses are passive: they offset passive income freely, and up to $25,000/yr can offset ordinary (W-2) income if you actively participate and your MAGI is under $100k (phasing out to $0 by $150k); unused losses carry forward. On sale, claimed depreciation is recaptured at up to 25%, and gains may owe capital-gains tax (a 1031 exchange can defer both). Figures are a year-1 estimate at your 24.0% rate — not tax advice; consult a CPA.
Schools (NCES district)
- District
- Cumberland County Schools
- NCES district ID
- 3700011
- Math proficiency
- 32% ▼ -2.00%
- Reading proficiency
- 41% ▼ -1.00%
- Median HH income
- $44,168
- Composite
- 31.0/100
- National rank
- #6096
- State rank
- #126 of 178 in NC
Livability — Fayetteville
- Score
- 75/100
- State rank
- #45
- US rank
- #4031
Category grades
Schools grade is shown separately in the Schools card above.
Census & demographics
- Census place
- Fayetteville, NC
- County
- Cumberland County · 265,314 people
- City population
- 226,118
- Metro
- Fayetteville, NC
- Population (ZIP)
- 16,798
- Household income
- $39,198
- Rent vs Own
- Severe rent burden
- 1389.0
Population outlook (Cumberland County) Hauer SSP2
- Today (2025)
- 330,855 people
- By 2030
- 333,523 · +0.8%
- By 2040
- 335,583 · +1.4%
- By 2050
- 335,325 · +1.4%
- By 2075
- 342,853 · +3.6%
- By 2100
- 340,698 · +3.0%
Race, ethnicity, and origin ACS 2023
- Neighborhood character
- Predominantly Black (68%)
- Race & ethnicity
- Black 68% White 19% Two or more races 6% Hispanic / Latino 5%
- Common ancestry
- Serbian 1% Slovak 1% Romanian 1%
- Foreign-born
- 3% · Canada
- Languages at home
- 95% English-only · Spanish 3% French/Haitian/Cajun 1%
Political lean MEDSL · Cumberland
- 2024 margin
- D (+13.4) · D 56.1% · R 42.7% · Other 1.2%
- 2008→2024 swing
- -4.3pp toward R · 2008: 17.7pp · 2024: 13.4pp
- All cycles
- 2024: D+13.4 2020: D+16.6 2016: D+16.0 2012: D+19.7 2008: D+17.7
Not yet ingested
- Civics
- —
Market trends
- HPI YoY
- ▼ -37.92%
- Current HPI
- 265.98
- Rent YoY
- ▲ 3.49%
- Metro
- Fayetteville, NC
- State GDP YoY
- ▲ 3.28%
- F500 in state
- 26
Industry mix (Fortune 500 HQ in NC)
| Industry | F500 HQs | Revenue |
|---|---|---|
| Financial Services | 2 | $213B |
|
||
| Retail | 2 | $95B |
|
||
| Industrial Conglomerate | 1 | $38B |
|
||
| Metals / Steel | 1 | $35B |
|
||
| Utilities | 1 | $30B |
|
||
| Industrial Machinery | 1 | $19B |
|
||
Price history
+142.0% since first listed14 events — show timeline
- 2026-05-13 Price Changed $167,000 LPRMLS
- 2026-02-05 Price Changed $170,000 LPRMLS
- 2026-01-19 Listed $175,000 LPRMLS
- 2025-11-04 Listed $175,000 LPRMLS
- 2025-09-24 Listed $175,000 LPRMLS
- 2025-05-16 Rental Removed $1,475 TMLS
- 2025-04-15 Price Changed $1,475 TMLS
- 2025-03-22 Listed for Rent $1,499 TMLS
- 2025-03-21 Rental Removed $1,499 TMLS
- 2025-03-03 Listed for Rent $1,499 TMLS
- 2021-09-16 Sold (Public Records) $92,500 Public Records
- 2017-06-29 Sold (MLS) $32,000 LPRMLS
- 2017-05-08 Listed $45,000 LPRMLS
- 1996-08-08 Sold (Public Records) $69,000 Public Records
Property tax history
+6.2%/yrLatest (2025): $2,208 · +51.6% YoY. Source: county tax records.
Cash-flow waterfall
monthlySold comps — $/sqft
last 12 mo · ≤1 miLoading sold comps…