 🏷️ Likely Rental
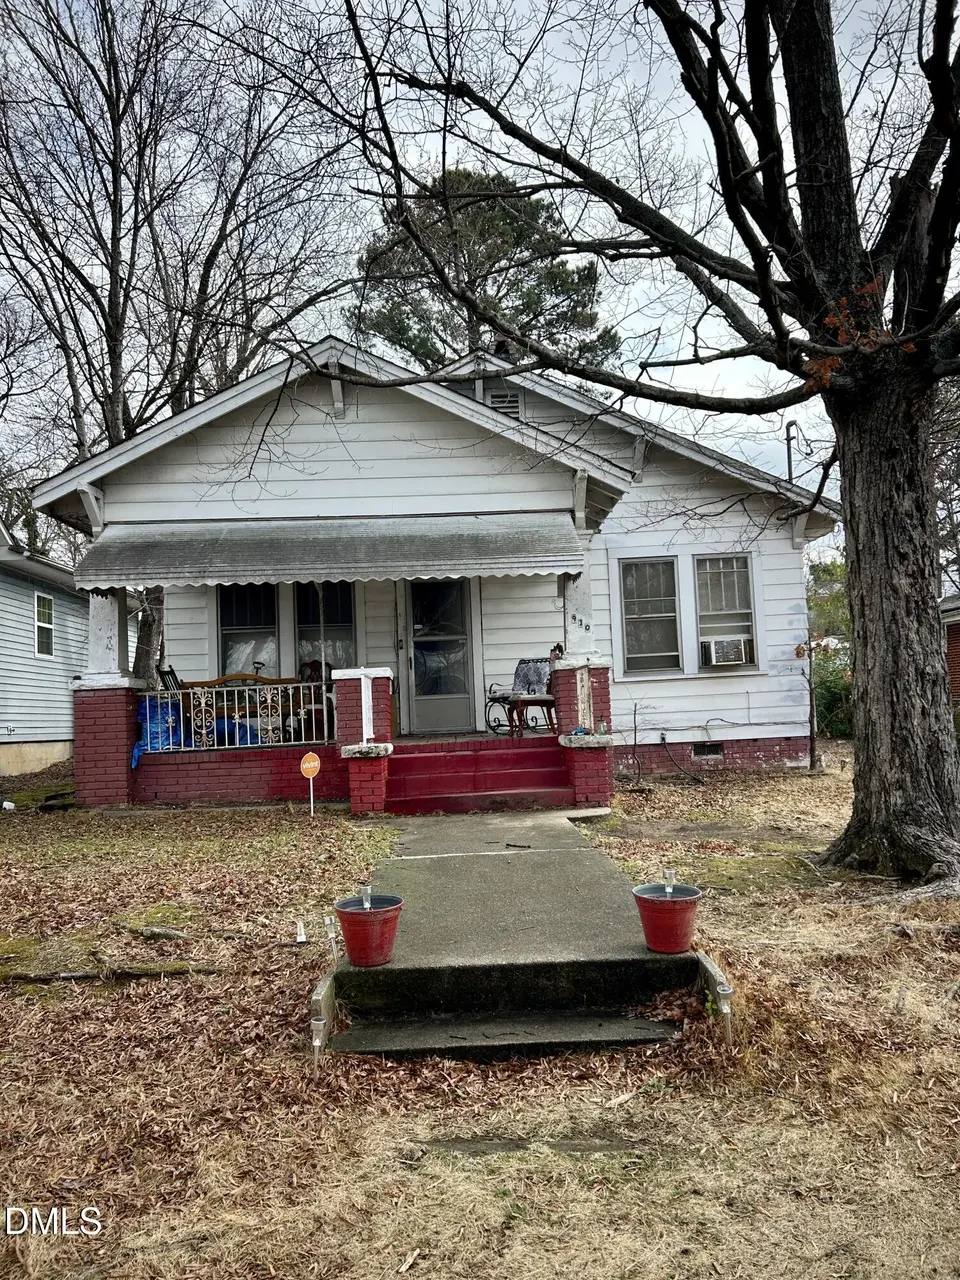
910 Chester St · Durham, NC
Flood risk 1/10 · Minimal
- FEMA flood zone
- X (unshaded)
- Chance of flooding over 30 yrs
- 0.0%
- Est. flood insurance / yr
- $507 – $1,088
Fire risk 1/10 · Minimal
- Est. fire insurance / yr
- $906 – $1,684
Heat risk 6/10 · Moderate
- Hot days now (above 106°F)
- 7 days/yr
- Hot days in 30 yrs
- 16 days/yr
Wind risk 6/10 · Moderate
- Chance of severe wind over 30 yrs
- 27.0%
Air-quality risk 2/10 · Minimal
- Unhealthy air days now
- 1 days/yr
- Unhealthy air days in 30 yrs
- 1 days/yr
Risk factors via First Street. Map © Google.
Why this score? — see what drove the B grade
The composite is a weighted blend of 9 inputs, each scored 0–100. Each bar is that input's sub-score; the figure is the points it added to the 100-point composite (weight × sub-score).
- Cash flow +30.0/30.0
- DSCR +10.0/10.0
- 1% rule +9.8/10.0
- ARV discount +7.5/15.0
- Livability +4.0/5.0
- Rent growth +3.3/5.0
- Schools +3.0/10.0
- Condition / age +2.5/5.0
- Appreciation +0.0/10.0
$135,000
🖨 Deal sheet (PDF) 📄 Offer letter ✓ Due diligence
Listing remarks
Call agent for more information. Whether you're an investor, renovator, or buyer looking to customize your next home, this property presents a great opportunity in Durham. Bring your ideas and transform this house into something special! Property is subject to 10 Day Upset Period Period at Clerk Of Courts, Tenant in property must reach for showings-no lockbox. .. may need 30 days to vacate. Property is in fair condition, No heat, original kitchen, lots of potential. SEE Court Documents in Documents folder-Call agent for more information. See Survey in file also.
Key facts
- 6,534 sq ft lot
- Built 1943
- Listed 40 days
Property features AI
Finance
- Other: Lot approximately 0.15 acres; Property located in Durham County, postal code 27701; Directions: Alston Avenue to Holloway Street, left on Chester, house on right
- Financial info: No investor/multifamily income or expense details provided
- HOA & community: No association
Exterior
- Parking: Driveway
- Utilities: Public water; Public sewer; Electricity connected; Sewer connected; Water connected
- Home design: One-story house; R-3 zoning
- Construction: Aluminum siding; Shingle roof; House structure; Built area approximately 1,240 (above grade)
- Exterior features: Front porch; Chain link and partial fencing; City street frontage; Public maintained road
Interior
- Kitchen: Washer hookup in kitchen
- Bedrooms: 3 bedrooms (all on the main level)
- Flooring: Vinyl flooring; Wood flooring
- Bathrooms: 1 full bathroom; 1 half bathroom
- Heating & cooling: Baseboard heating; Window unit(s) for cooling (no central air)
- Interior features: Electric water heater; Fixer condition
- Laundry & utility: Washer hookup; In-kitchen laundry location
Neighborhood map
What this means for you Summary
Snapshot
- This is a 3-bed/2.0-bath single-family listed at $135k.
Deal economics
- At list price, monthly cash flow is $630 ($8k/yr) — positive.
- The deal already cash-flows at list — no discount required.
- Meets the 1% rule at list price ($2k rent vs $135k).
- Recommended offer: $131k (3.0% below list) — sets the bar for market timing.
- Cap rate 11.9% vs local median 3.0% in Durham — top-decile yield for the area; either an underpriced asset or a hidden risk that comps aren't pricing in. Stress-test before assuming the spread holds.
Location & tenants
- Location reads 81/100 on livability (#15 in NC, #1,411 nationally) — a professional / high-income tenant draw. Strengths: amenities A+, commute A+, housing A+; Watch: crime F.
- Durham Public Schools (urban): math 29% / reading 39% proficiency, ranked #132 of 178 in NC (top 74%) — families likely to look elsewhere, expect single-tenant / working-renter base with shorter leases.
- Zoned schools: Holt Elementary (math 10% / reading 26%, grade F, #1,280 of 1,410 statewide, top 91%, 636 students, 83% FRL); Brogden Middle (math 17% / reading 23%, grade F, #429 of 475 statewide, top 91%, 742 students, 100% FRL); Riverside High (math 49% / reading 42%, grade D-, #347 of 535 statewide, top 65%, 1,812 students, 51% FRL) — zoned schools average 78% FRL vs 58% district-wide (20 pts higher); higher-poverty schools than district average — tighter screening recommended.
- Market conditions: Rents rising (+3.2%/yr); 198 active listings in the ZIP; 40 comparable units currently listed for rent nearby; rentals at typical pace (median 16d on market — plan ~3-4 weeks tenant-placement turnaround); 2,905 units permitted in Durham County in 2024 (955 in 5+ unit buildings).
- This rent runs 34% of the median local income ($70k/yr) — at the standard rent-burdened threshold; future hikes will face affordability resistance.
Forward outlook
- Local home prices are declining (-3.0%/yr); year-one equity from $933 of loan paydown is wiped out by about $4k of value loss. Plan a longer hold.
- Durham County population projected at +44% by 2050 — long-run rental-demand tailwind backs the buy-and-hold thesis.
- At projected returns (-3.0% appreciation + 3.2% rent growth), your $38k cash investment doubles in ~6 years — after that, you're playing with house money.
Negotiation context
- It's been on market 40 days — a 3% lower offer ($131k) is reasonable based on typical stale-listing flexibility.
- 2 sale attempts with the ask held roughly flat each time — persistent listings suggest the price (not the market) is what's stuck; bring a comps-based counter.
Risks & watch-outs
- Watch-outs: built in 1943 — expect roof / HVAC / electrical / plumbing capex.
- Climate carrying-cost: major wind risk, 27% chance of damaging wind over 30y; extreme-heat days projected 7→16/yr by 2055 (HVAC capex compounding) — expect insurance premiums to compound above CPI over the hold.
Questions for the listing agent
- It's been on market 40 days. Have you received any prior offers? Is the seller open to a 3% concession, seller financing, or rate buy-down credit?
- Built in 1943 — when were the roof, HVAC, electrical panel, plumbing, and water heater last replaced?
- Is there a deadline driving the sale (1031 exchange, divorce, estate, relocation)? That informs how much negotiation room exists.
- Schools are D-rated, which usually means shorter tenancies and higher turnover. Who's the typical renter profile here, and what's been the actual vacancy rate?
- Crime grade is F in this area — have there been break-ins, vandalism, or insurance claims at this property in the last 3 years? What carrier currently insures it and at what premium?
- What's the average days-on-market for RENTAL listings here right now (not sales)? A rising rental-DOM trend means longer vacancies and softer asking-rent achievability than the comps imply.
- What's the recent tenant-quality profile in this submarket — average credit score on applications, eviction rate, late-payment / NSF rate, and stable-employment percentage? A property-management company in the area should have these aggregated.
- How much new for-sale + rental construction is in the pipeline within 1–3 miles? Heavy new supply typically softens prices + rents 12–24 months out; constrained supply supports both.
Investment metrics
- 1% rule
- 1.48% ✓
- Cap rate
- 11.89%
- Cash-on-cash
- 20.01%
- DSCR
- 1.89
- GRM
- 5.6
CMA / ARV
- ARV (on-the-fly)
- $319,060
- Comps found
- 12
Show comp detail 12 sales within ~0.75 mi
| Address | Dist | Beds/Ba | Sqft | Sold | Price | $/sf | Match |
|---|---|---|---|---|---|---|---|
| 807 Eva St | 0.25mi | 3/2.0 | 1,171 (-3%) | 5mo | $309,900 | $265 | 80 |
| 1318 N Alston Ave | 0.39mi | 3/2.0 | 1,242 (+3%) | 6mo | $307,000 | $247 | 72 |
| 608 Canal St | 0.47mi | 3/2.0 | 1,277 (+6%) | 1mo | $460,000 | $360 | 67 |
| 1410 Braxton St | 0.47mi | 4/2.0 (+1) | 1,245 (+3%) | 2mo | $363,000 | $292 | 66 |
| 707 Gray Ave | 0.39mi | 3/2.0 | 1,307 (+9%) | 6mo | $290,000 | $222 | 62 |
| 907 N Elizabeth St | 0.60mi | 3/2.5 | 1,227 (+2%) | 6mo | $475,000 | $387 | 62 |
| 1319 Fay St | 0.35mi | 3/2.0 | 1,334 (+11%) | 7mo | $265,000 | $199 | 60 |
| 310 Peachtree Pl | 0.62mi | 3/2.5 | 1,280 (+6%) | 4mo | $295,000 | $230 | 56 |
| 1704 E Main St | 0.69mi | 3/2.0 | 1,107 (-8%) | 2mo | $205,000 | $185 | 53 |
| 1112 N Driver St | 0.30mi | 2/1.0 (-1) | 1,036 (-14%) | 4mo | $268,500 | $259 | 50 |
| 307 N Guthrie Ave | 0.57mi | 2/2.0 (-1) | 1,304 (+8%) | 6mo | $350,000 | $268 | 50 |
| 407a Edward St | 0.73mi | 2/1.0 (-1) | 1,133 (-6%) | 1mo | $374,000 | $330 | 46 |
Match score weights: distance 35% · size 25% · config 20% · recency 20%. Top-matched comps best support the ARV.
Projected returns pro-forma
-3.0% appreciation · 3.25% rent growth · sell at horizon
- IRR
- 12.5%
- Equity multiple
- 1.50×
- Total profit
- $18,807
- Equity at exit
- $20,129
- IRR
- 21.6%
- Equity multiple
- 2.86×
- Total profit
- $70,304
- Equity at exit
- $11,672
Cash invested: $37,800 (down + closing). Projections, not guarantees.
Landlord ↔ Tenant lean methodology
- Overall (STATE)
- 85 Strongly Landlord-Friendly
- State North Carolina
- 85 Strongly Landlord-Friendly · R+3
- County
- — inherits STATE
- City
- — inherits STATE
ZIP-level market 27701
- Rents YoY
- 3.2%
- Active inventory
- 198
- Price-to-rent
- 5.6×
Monthly cashflow live
- Estimated rent
- $2,000 high interval (Pro) →
- Mortgage (P&I)
- −$708
- Tax from tax record
- −$185 /mo · $2,224/yr
- Insurance
- −$56
- HOA
- −$0
- Vacancy / Maint / Mgmt
- −$420
- Net cashflow
- $630
Break-even live
Sensitivity live
| Price | -10% $707 | -5% $668 | +0% $630 | +5% $592 | +10% $554 |
|---|---|---|---|---|---|
| Rent | -10% $472 | -5% $551 | +0% $630 | +5% $709 | +10% $788 |
| Rate | -1.0pp $698 | -0.5pp $665 | base $630 | +0.5pp $595 | +1.0pp $560 |
UW: 25.0% down · 7.5% · 30yr · 1.5% tax · 5.0% vac · 8.0% maint · 8.0% mgmt
Financing live
Cash to close
- Down payment
- $33,750
- Closing costs
- $4,050
- Reserves months
- —
- Total cash needed
- —
Loan-product check · same deal, 3 products live
Conventional
25% down · 7.5% · 30yr
- Down + closing
- —
- Monthly P&I
- —
- Monthly cashflow
- —
- DSCR
- —
- Eligible?
- —
Personal DTI + credit; lowest rate.
DSCR
20% down · 8.5% · 30yr
- Down + closing
- —
- Monthly P&I
- —
- Monthly cashflow
- —
- DSCR
- —
- Eligible?
- —
No personal income docs; deal must DSCR.
Hard money
10% down · 12.0% · 12mo
- Down + closing
- —
- Monthly P&I
- —
- Monthly cashflow
- —
- DSCR
- —
- Eligible?
- —
Short-term bridge; refi at stabilization.
Rent comps 40 comps
| Address | Beds | Baths | Sqft | Rent | $/sqft | DOM | Units | Dist |
|---|---|---|---|---|---|---|---|---|
| 603 N Elm St Unit A Durham, NC | 3.0 | 2.0 | 1200 | $1,495 | $1.25 | 25d | 1 | 0.32mi |
| 721 Liberty St Unit C Durham, NC | 2.0 | 1.0 | 800 | $1,495 | $1.87 | 25d | 1 | 0.33mi |
| 406 N Hyde Park Ave Durham, NC | 3.0 | 1.0 | 1160 | $1,730 | $1.49 | 22d | 1 | 0.40mi |
| 607 Dowd St Durham, NC | 2.0 | 1.0 | 720 | $1,550 | $2.15 | 25d | 1 | 0.48mi |
| 1609 Evergreen St Durham, NC | 2.0 | 1.0 | 1051 | $1,695 | $1.61 | 22d | 1 | 0.50mi |
| 1136 Drew St Unit A Durham, NC | 3.0 | 2.5 | 1390 | $1,550 | $1.12 | 15d | 1 | 0.50mi |
| 506 Gurley St Unit A Durham, NC | 2.0 | 1.0 | 775 | $1,300 | $1.68 | 15d | 1 | 0.51mi |
| 910 Fiske St Unit B Durham, NC | 2.0 | 1.0 | 750 | $1,025 | $1.37 | 25d | 1 | 0.52mi |
| 1600 N Alston Ave Unit C Durham, NC | 2.0 | 1.0 | 800 | $1,150 | $1.44 | 15d | 1 | 0.53mi |
| 916 Fiske St Unit A Durham, NC | 2.0 | 1.0 | 800 | $1,050 | $1.31 | 25d | 1 | 0.53mi |
| 1516 London Cir Durham, NC | 3.0 | 1.0 | 1118 | $1,650 | $1.48 | 25d | 1 | 0.63mi |
| 1809 E Main St Durham, NC | 3.0 | 1.0 | 1200 | $1,700 | $1.42 | 15d | 1 | 0.66mi |
| 500 E Main St Durham, NC | 3.0 | 1.0–2.0 | 1002 | $3,556 | $3.55 | 15d | 40 | 0.71mi |
| 208 Gray Ave Apt 4H Durham, NC | 2.0 | 1.0 | 800 | $1,250 | $1.56 | 25d | 1 | 0.73mi |
| 1828 Liberty St Unit B Durham, NC | 2.0 | 1.0 | 1100 | $1,450 | $1.32 | 15d | 1 | 0.76mi |
| 1104 Raynor St Durham, NC | 4.0 | 2.0 | 1388 | $1,720 | $1.24 | 15d | 1 | 0.82mi |
| 464 E Pettigrew St Durham, NC | 2.0 | 2.0 | 1091 | $2,786 | $2.55 | 15d | 1 | 0.91mi |
| 510 E Pettigrew St Durham, NC | 3.0 | 1.0–2.0 | 996 | $3,130 | $3.14 | 15d | 29 | 0.91mi |
| 1911 Fidelity Dr Durham, NC | 3.0 | 2.0 | 1209 | $1,815 | $1.50 | 25d | 1 | 0.92mi |
| 2408 Hart St Durham, NC | 3.0 | 1.0 | 960 | $1,445 | $1.51 | 25d | 1 | 0.93mi |
| 504 E Pettigrew St Durham, NC | 3.0 | 1.0–2.0 | 1092 | $2,528 | $2.32 | 22d | 30 | 0.94mi |
| 504 E Pettigrew St Durham, NC | 2.0 | 1.0–2.0 | 1025 | $2,219 | $2.16 | 15d | 35 | 0.94mi |
| 441 S Dillard St Durham, NC | 1.0–3.0 | 1.0–2.5 | 1153 | $3,389 | $2.94 | 15d | 21 | 0.96mi |
| 200 W Geer St Unit 200-C Durham, NC | 2.0 | 1.0 | 850 | $1,400 | $1.65 | 15d | 1 | 0.97mi |
| 2113 Angier Ave Apt B Durham, NC | 2.0 | 1.0 | 925 | $1,300 | $1.41 | 25d | 1 | 0.98mi |
| 311 W Corporation St Durham, NC | 2.0 | 1.0–2.0 | 691 | $3,505 | $5.07 | 22d | 5 | 1.01mi |
| 311 W Corporation St Unit 3-201 Durham, NC | 2.0 | 2.0 | 985 | $3,355 | $3.41 | 25d | 1 | 1.01mi |
| 615 N Hardee St Durham, NC | 3.0 | 2.0 | 1250 | $1,690 | $1.35 | 15d | 1 | 1.01mi |
| 321 W Corporation St Durham, NC | 2.0 | 2.0 | 977 | $2,530 | $2.59 | 15d | 1 | 1.01mi |
| 109 W Main St #402 Durham, NC | 2.0 | 1.5 | 1296 | $2,695 | $2.08 | 25d | 1 | 1.02mi |
| 110 N Corcoran St Durham, NC | 1.0–2.0 | 1.0–2.0 | 1219 | $4,594 | $3.77 | 15d | 8 | 1.02mi |
| 701 Grant St Durham, NC | 3.0 | 2.0 | 1145 | $1,850 | $1.62 | 25d | 1 | 1.03mi |
| 815 Madison St Durham, NC | 2.0 | 1.0–2.0 | 859 | $2,854 | $3.32 | 22d | 5 | 1.05mi |
| 318 W Corporation St Durham, NC | 3.0 | 1.0–2.0 | 900 | $3,750 | $4.17 | 15d | 55 | 1.05mi |
| 518 N Hardee St Durham, NC | 1.0–2.0 | 1.0–1.5 | 665 | $1,299 | $1.95 | 25d | 1 | 1.09mi |
| 511 S Mangum St Durham, NC | 3.0 | 1.0–2.0 | 1159 | $4,115 | $3.55 | 15d | 29 | 1.10mi |
| 530 Foster St Durham, NC | 2.0 | 1.0–2.0 | 918 | $2,750 | $3.00 | 15d | 18 | 1.11mi |
| 1237 Naples Pl Durham, NC | 1.0–4.0 | 1.0–2.0 | 995 | $1,567 | $1.57 | 13d | 1 | 1.13mi |
| 620 Foster St Durham, NC | 2.0 | 1.0–2.0 | 888 | $3,303 | $3.72 | 15d | 43 | 1.14mi |
| 545 Foster St Durham, NC | 2.0 | 1.0–2.0 | 910 | $2,722 | $2.99 | 15d | 2 | 1.14mi |
Listing history 5 events
-
2026-05-30status $135,000 Pending 40 DOM
-
2026-05-14status Active
-
2026-05-02historical
-
2026-03-24status Pending
-
2026-02-27$135,000 Active
ⓘ Source: listings_history table (triggers on properties + properties_extension) + one-shot
backfill from property_details.listing_events for pre-trigger history.
Tax reassessment forecast NC · Resets to sale price
- Current annual tax
- $2,224 · $185/mo
- Projected year-2 tax
- $2,224 · $185/mo
- Expected delta
- $0/yr ($0/mo · 0.0%)
ⓘ Screening estimate from a state-policy table — verify with the county assessor before closing.
Climate risk First Street
- Flood 1/10 Low FEMA zone X (unshaded) · 0% chance over 30 yrs
- Wildfire 1/10 Low
- Heat 6/10 Major 7 d/yr ≥106°F today · 16 d/yr by 30 yrs out
- Wind 6/10 Major 27% chance of damaging wind over 30 yrs
- Air quality 2/10 Low 1 unhealthy d/yr today · 1 by 30 yrs out
Nearby sold comps map
Loading sold comps map…
Walkable amenities ~0.75 mi
Loading nearby amenities…
Taxation est. · year 1
- Rental income
- $23,997
- − Mortgage interest
- −$7,562
- − Property taxes
- −$2,224
- − Insurance
- −$675
- − Repairs & maintenance
- −$1,920
- − Management
- −$1,920
- − Depreciation
- −$3,927
- Taxable income
- $5,768
- Est. tax owed @ 24.0%
- −$1,384
- After-tax cash flow
- $6,178/yr
For passive investors: Depreciation is non-cash, so a rental often shows a tax loss while cash-flowing — sheltering income. Rental losses are passive: they offset passive income freely, and up to $25,000/yr can offset ordinary (W-2) income if you actively participate and your MAGI is under $100k (phasing out to $0 by $150k); unused losses carry forward. On sale, claimed depreciation is recaptured at up to 25%, and gains may owe capital-gains tax (a 1031 exchange can defer both). Figures are a year-1 estimate at your 24.0% rate — not tax advice; consult a CPA.
Schools (NCES district)
- District
- Durham Public Schools
- NCES district ID
- 3701260
- Math proficiency
- 29% ▼ -3.00%
- Reading proficiency
- 39% ▲ 2.00%
- Median HH income
- $52,143
- Composite
- 29.69/100
- National rank
- #6457
- State rank
- #132 of 178 in NC
Livability — Durham
- Score
- 81/100
- State rank
- #15
- US rank
- #1411
Category grades
Schools grade is shown separately in the Schools card above.
Census & demographics
- Census place
- Durham, NC
- County
- Durham County · 288,747 people
- City population
- 288,747
- Metro
- Durham-Chapel Hill, NC
- Population (ZIP)
- 24,793
- Household income
- $69,740
- Rent vs Own
- Severe rent burden
- 1402.0
Population outlook (Durham County) Hauer SSP2
- Today (2025)
- 368,962 people
- By 2030
- 402,686 · +9.1%
- By 2040
- 468,677 · +27.0%
- By 2050
- 531,727 · +44.1%
- By 2075
- 660,446 · +79.0%
- By 2100
- 739,971 · +100.6%
Race, ethnicity, and origin ACS 2023
- Neighborhood character
- Diverse neighborhood (Simpson 0.69)
- Race & ethnicity
- White 40% Black 32% Hispanic / Latino 19% Two or more races 9% Asian 3%
- Hispanic origin (detail)
- Mexican 9%
- Common ancestry
- Romanian 2% Italian 2% Slovak 2%
- Foreign-born
- 18% · Canada, Vietnam
- Languages at home
- 76% English-only · Spanish 18% Other Indo-European 2% German/W. Germanic 1%
Political lean MEDSL · Durham
- 2024 margin
- Solid D (+61.9) · D 80.2% · R 18.2% · Other 1.6%
- 2008→2024 swing
- +10.0pp toward D · 2008: 51.9pp · 2024: 61.9pp
- All cycles
- 2024: D+61.9 2020: D+62.4 2016: D+60.4 2012: D+52.7 2008: D+51.9
Not yet ingested
- Civics
- —
Market trends
- HPI YoY
- ▼ -272.19%
- Current HPI
- 347.5371
- Rent YoY
- ▲ 3.25%
- Metro
- Durham-Chapel Hill, NC
- State GDP YoY
- ▲ 3.28%
- F500 in state
- 26
Industry mix (Fortune 500 HQ in NC)
| Industry | F500 HQs | Revenue |
|---|---|---|
| Financial Services | 2 | $213B |
|
||
| Retail | 2 | $95B |
|
||
| Industrial Conglomerate | 1 | $38B |
|
||
| Metals / Steel | 1 | $35B |
|
||
| Utilities | 1 | $30B |
|
||
| Industrial Machinery | 1 | $19B |
|
||
Price history
4 events — show timeline
- 2026-05-14 Relisted — TMLS
- 2026-05-02 Listing Removed — TMLS
- 2026-03-24 Pending — TMLS
- 2026-02-27 Listed $135,000 TMLS
Property tax history
+5.6%/yrLatest (2025): $2,224 · +91.7% YoY. Source: county tax records.
Cash-flow waterfall
monthlySold comps — $/sqft
last 12 mo · ≤1 miLoading sold comps…